4.2.6. Operation
This section aims to show the workflow of the UNAC module basic operation.
The implementation of the UNAC module can include functionalities such as network segmentation (Segmentation module) and end device compliance (End Point Compliance module) to improve the security of the network environment.
The Basic Operation module will detail all those dashboards that, from a basic operation point of view, will provide us with useful information on the operation and UNAC registration of our network.
The Admon Portal Configuration module will detail the steps to follow to configure the system and make it ready to operate its UNAC functionality together with all its functionalities, network access, segmentation, compliance, etc.
Note
Before proceeding with the operation section, make sure you have completed the administration configurations to prepare the system for basic operations.
Basic Operation:
Analyze the information contained in the Business Profiles.
Understand the information available in the solution’s dashboards.
Make reconnections from the system (Toggle Port).
Quarantine devices.
Learn to filter the information within the dashboards.
4.2.6.1. Initial Dashboard
When accessing the ON Core console, the first thing that will appear will be the initial dashboard. In this first dashboard we can find basic but useful information, as detailed below:
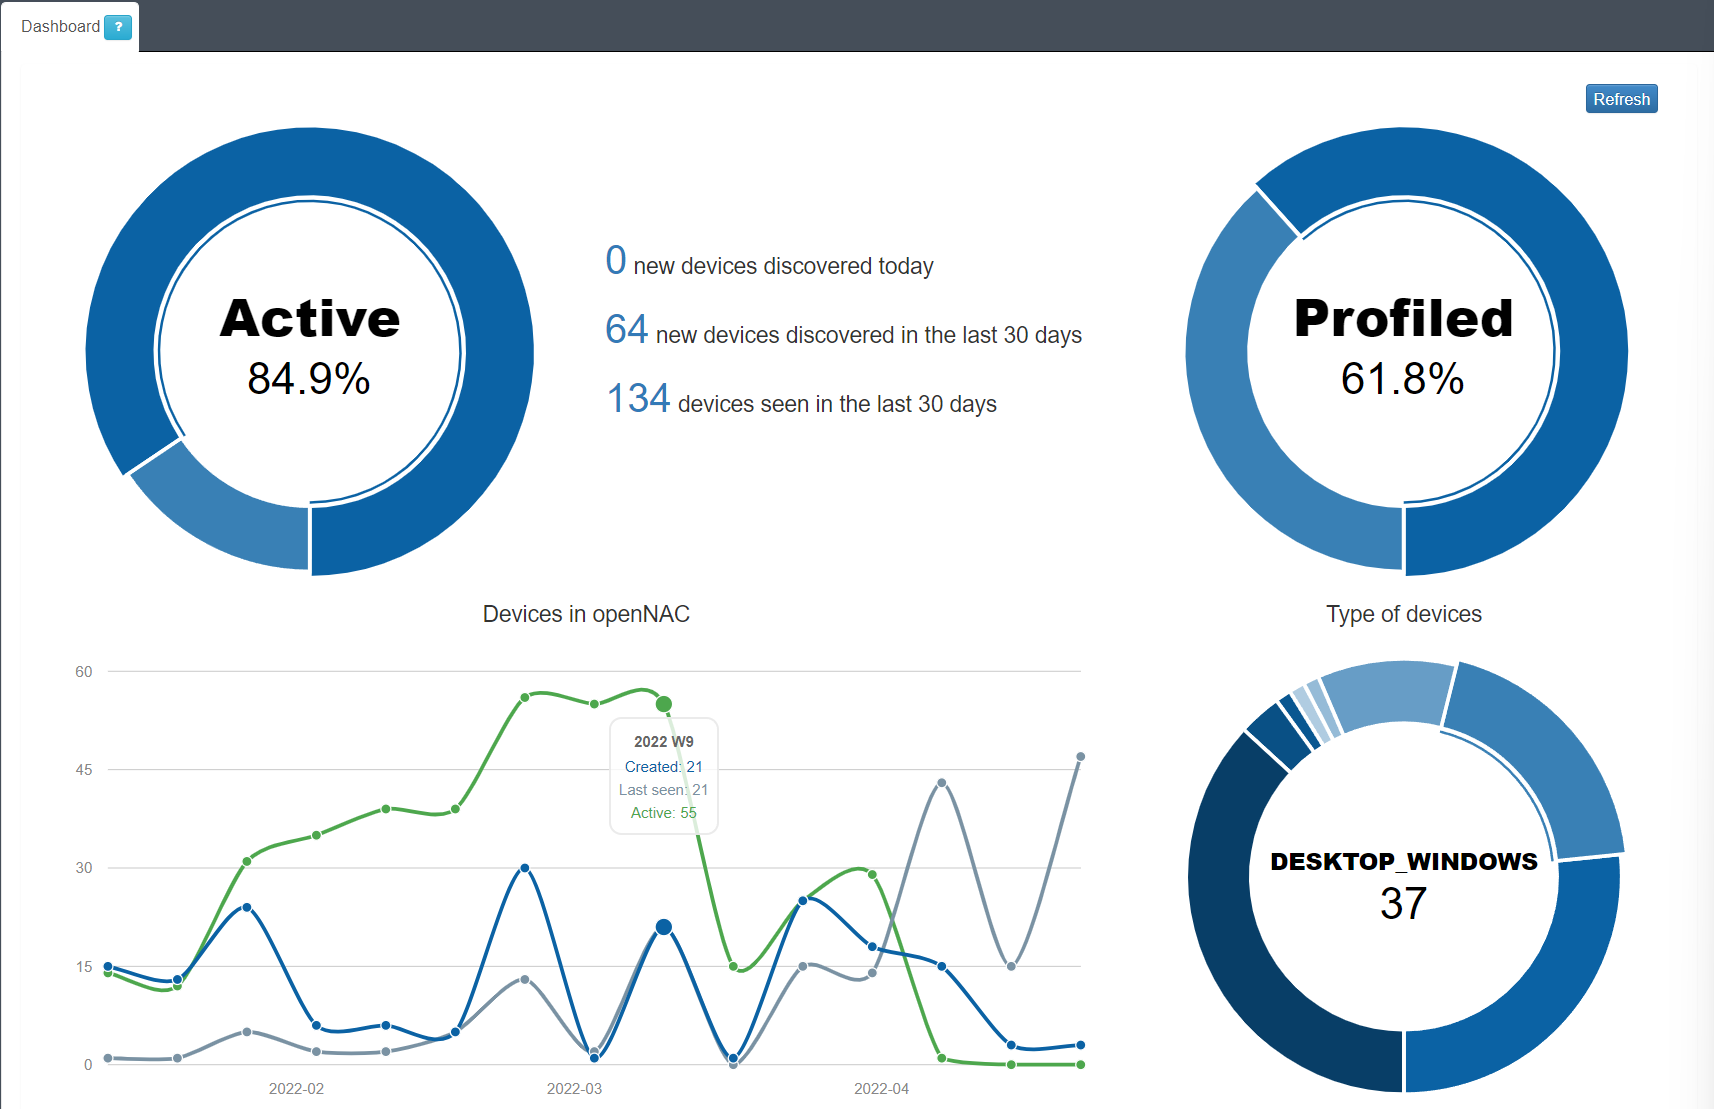
In the first “Active” pie chart, we find the percentage of devices that are currently active on the network. In the central part we find three relevant data:
Total number of devices discovered in the last 24 hours.
Total number of devices discovered in the last 30 days.
Total number of devices seen in the last 30 days. We understand as device seen all known devices (previously discovered) that have connected to the network.
The circular graph “Profiled / Not profiled” shows the percentage of total devices that have been profiled and those that have not. That is, how many have we been able to determine what type they are once discovered and how many have not. This information largely corresponds to the Visibiliy module.
In the case of the last pie chart, we can see the number of devices that have been identified in each type, for example, in this case we have discovered and profiled 259 “DESKTOP” computers on our network. Finally, we have the line chart with three variables:
Created: Devices created/discovered during the week.
Last seen: Devices seen during the week.
Active: Active devices during the week.
4.2.6.2. Business Profiles
In the Business Profiles section, we will be able to see the latest status of the connections that have been made on the network and have been detected by the system. For each of these connections we will have information related to the device and the connection itself: status, source, policy, etc.
4.2.6.2.1. Default View
In the Default View window, we see several Business Profiles, where each one of them can group the connection states depending on the policy in which they have entered. These groups are created in order to structure and organize these connections in environments where there may be many devices and connections, thus facilitating the queries in this section. There is no limitation regarding the number of Business Profiles, it is possible to have as many as necessary for the module. To access the Default View we must go to “ON NAC -> Business Profiles -> Default View”
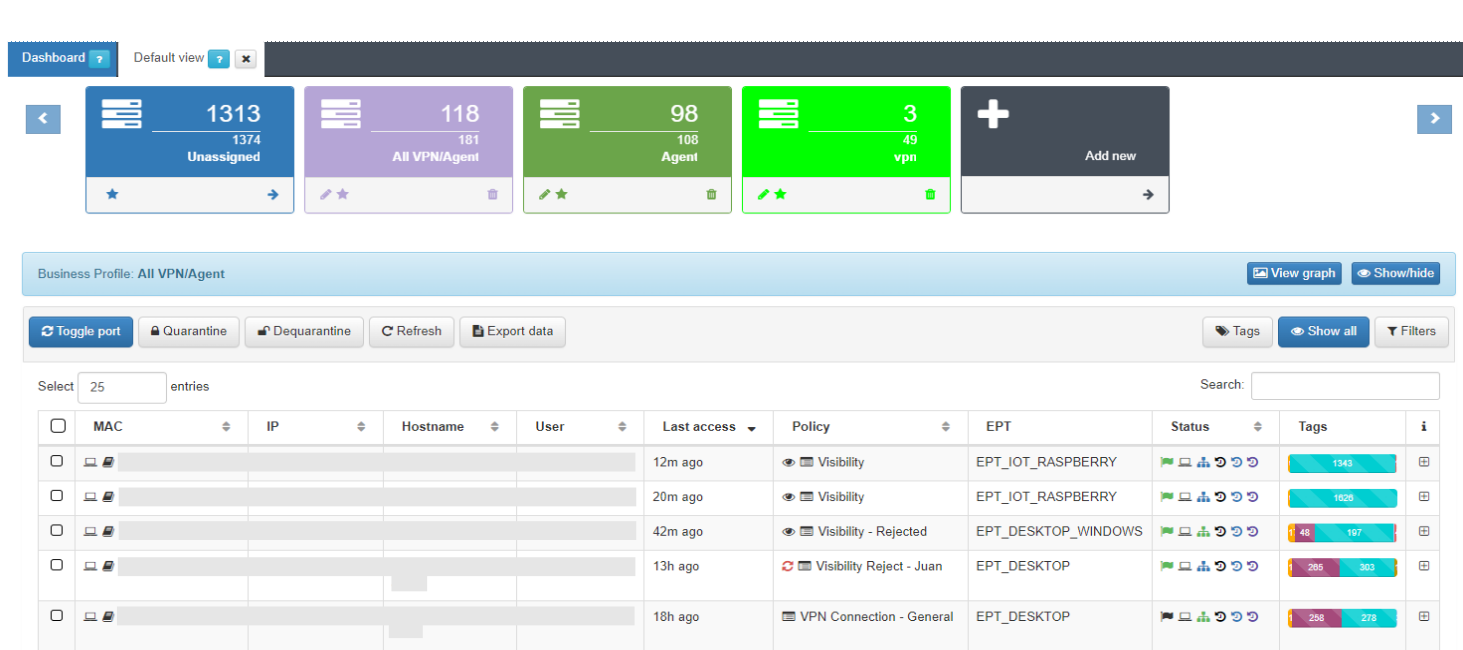
Here we can see in the form of a list, the latest states of all those connections to the network. The information of each connection is grouped in the following columns:
MAC: MAC address of the device.
IP: IP assigned to the device.
IP Switch: IP of the switch to which the device has been connected.
Hostname: Hostname of the device in case it is discovered.
User: User with which the device authenticates.
Last Access: Time elapsed since the last event related to the user.
Policy: Policy with which the device has fallen. (Section 3.1.1)
Vlan: VLAN that has been assigned to the device by evaluating the policies.
Source: Order and type of connection source (802.1x, Visibility, VPN, etc.)
EPT: Tag* referring to the type of device (End Point Type).
Status: Status of the connection (Active/Disconnected, assigned VLAN, etc.).
Tags: Numerical representation of the Tags* assigned to the device.
It is possible to access the Sensor and Discover dashboards directly with a filter of the device’s MAC by pressing the icons in the status column for each of the devices.
We can obtain more detailed information on each of the connections. For this, we must press the “+” button on the right side of the row that we want to expand.
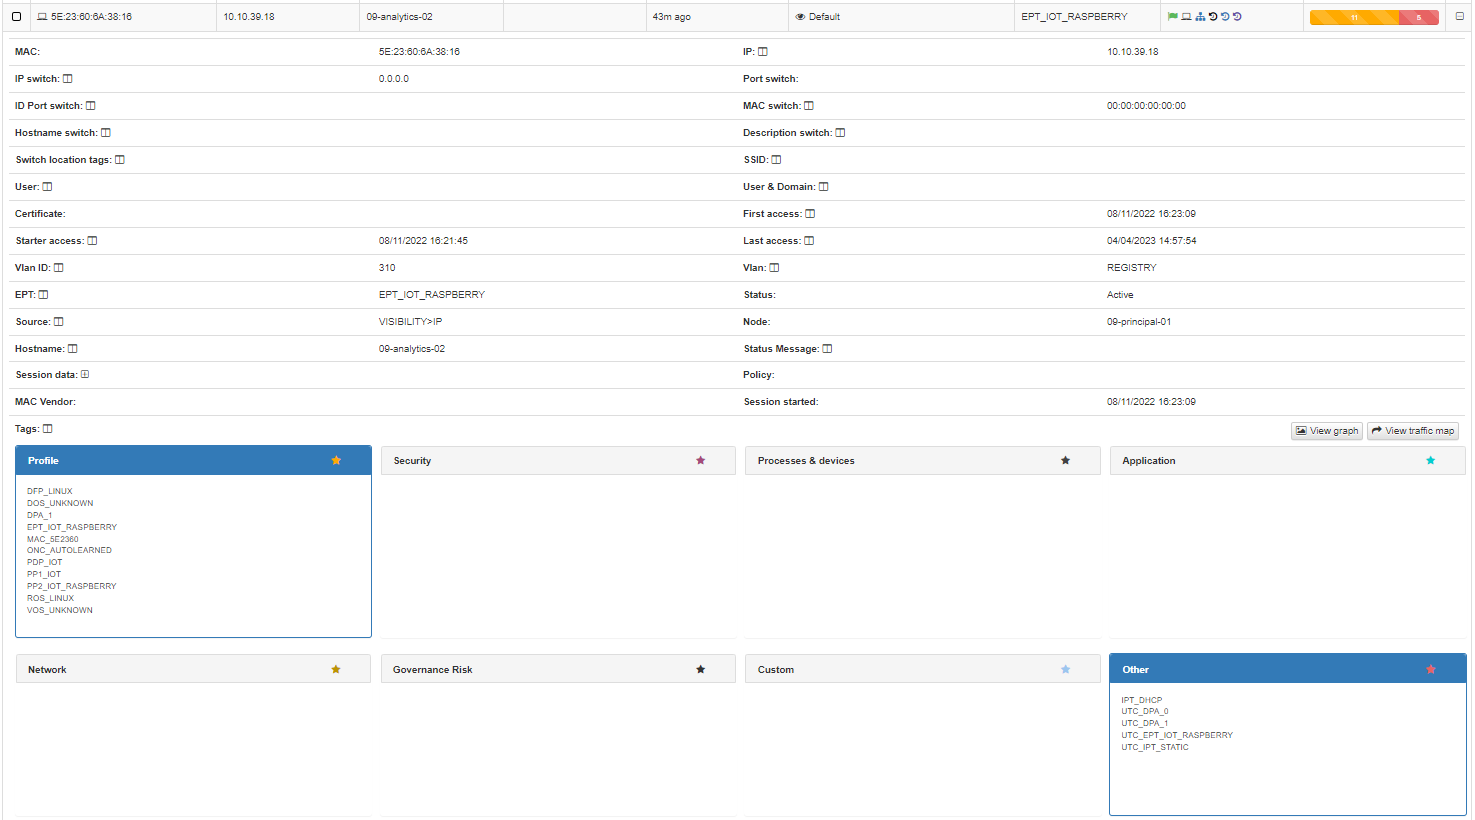
In this drop-down section, we can find all the information related to the device and the connection that has been made.
At the top, we find all the basic information of the connection, Mac, Hostname, User, policy, connection source, etc.
At the bottom we find the TAGs*, which are labels that are assigned to the devices to provide us with information about them. These tags are classified by families represented by 3 letters at the beginning of the tag followed by a “_” and the specific characteristic. For example, the tag “ROS_WINDOWS” indicates a Root Operating System of type Windows.
We can find all the existing TAGs and their description in Tags Table.
Based on the previous classification of the TAGs, these are segmented into blocks and give us relevant information in relation to the device. These blocks are:
Profile: Profiling tags, device type, operating system, system information, etc.
Security: Tags related to device security such as antivirus or firewall information.
Processes: Processes that are running on the device.
Application: Information about the applications installed on the device, as well as the versions
Network: Network information such as open ports.
Custom: Custom tags.
Other: Other tags with important information, for example, IP obtaining mode (IPT_DHCP).
To improve the information we obtain from the devices, it is possible to implement the Visibiliy module. This will help us obtain more information about the network and its devices. All the fields contained in a Business Profile entry contain the icon “column”. Clicking on this field will add the column to all Business Profile entries.
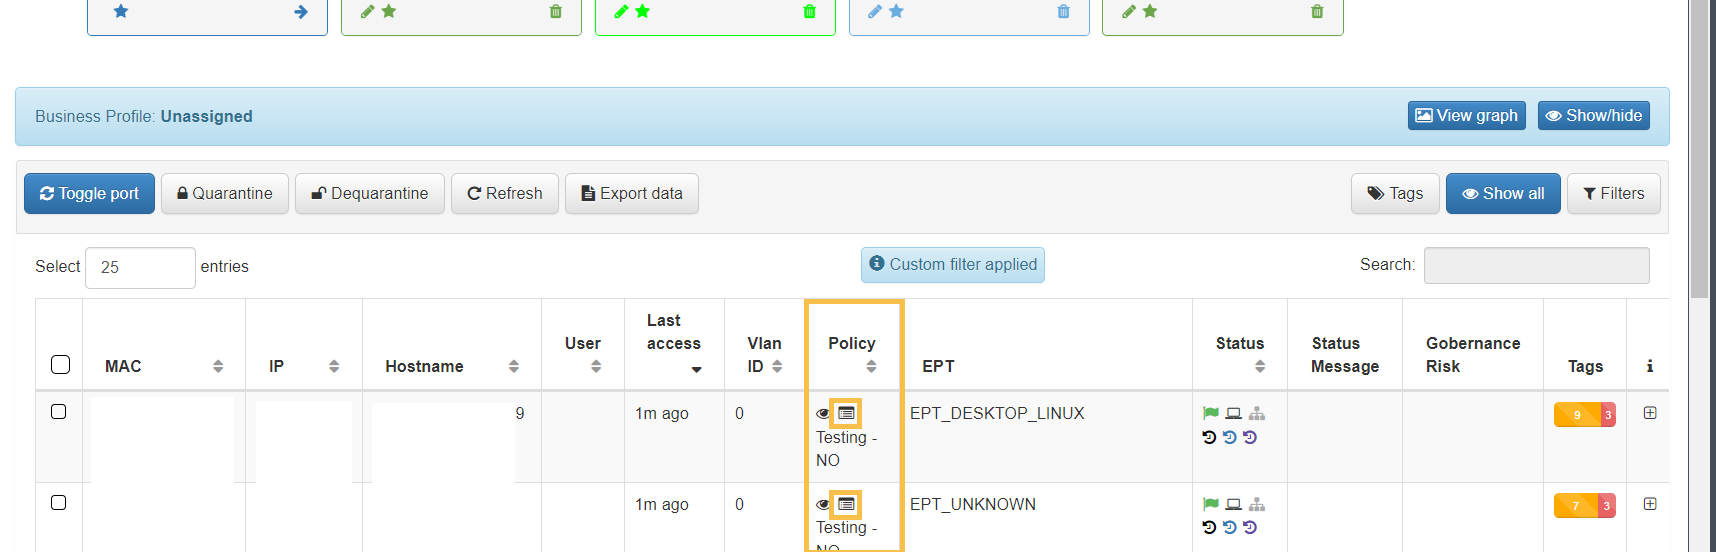
4.2.6.2.2. Policy evaluation details
For each of the entries in the list of Business Profiles, we can find the “eye” icon in the Policy column.
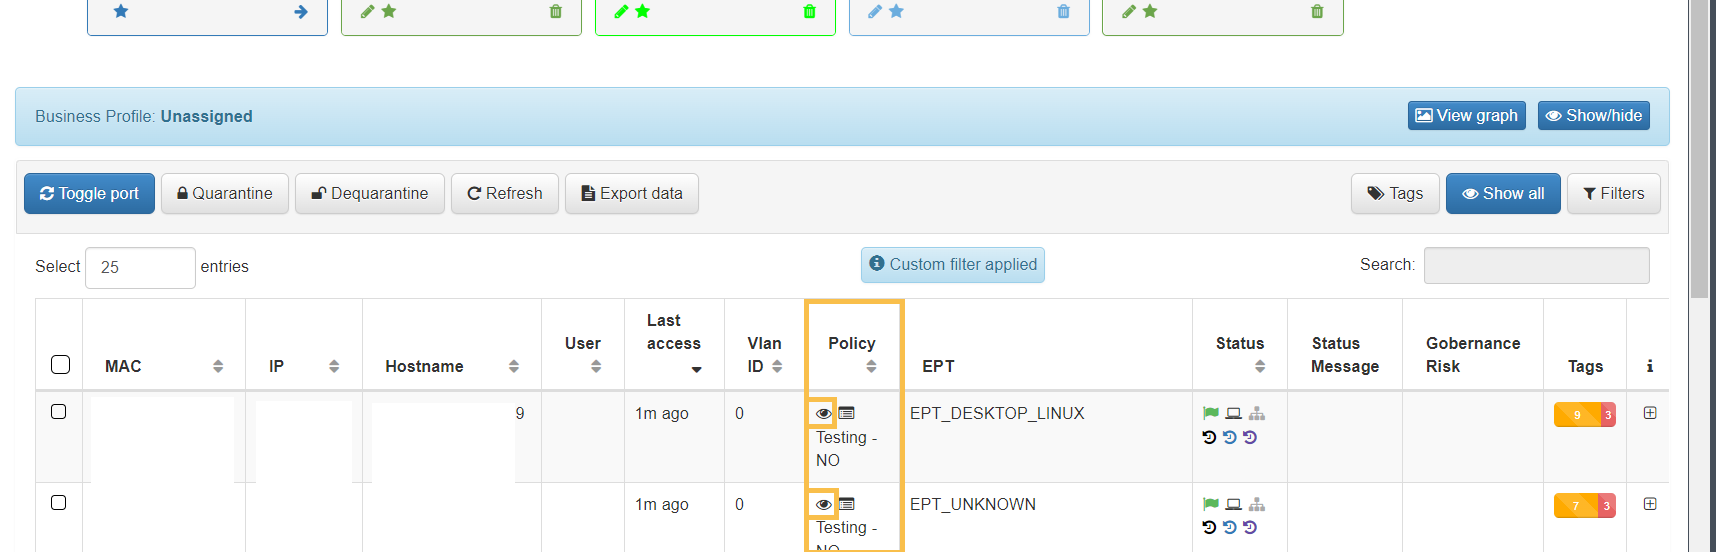
By clicking on this icon, a new window will open.
In this window we will find all the information related to the evaluation of policies for each of the events generated in the system.
On the left side we find the last 10 registered events. The initializing events, that is, those that will cause a policy evaluation (for example, authentication events such as 802.1X or MAB) will appear in blue.
For each of these events we have the following information:
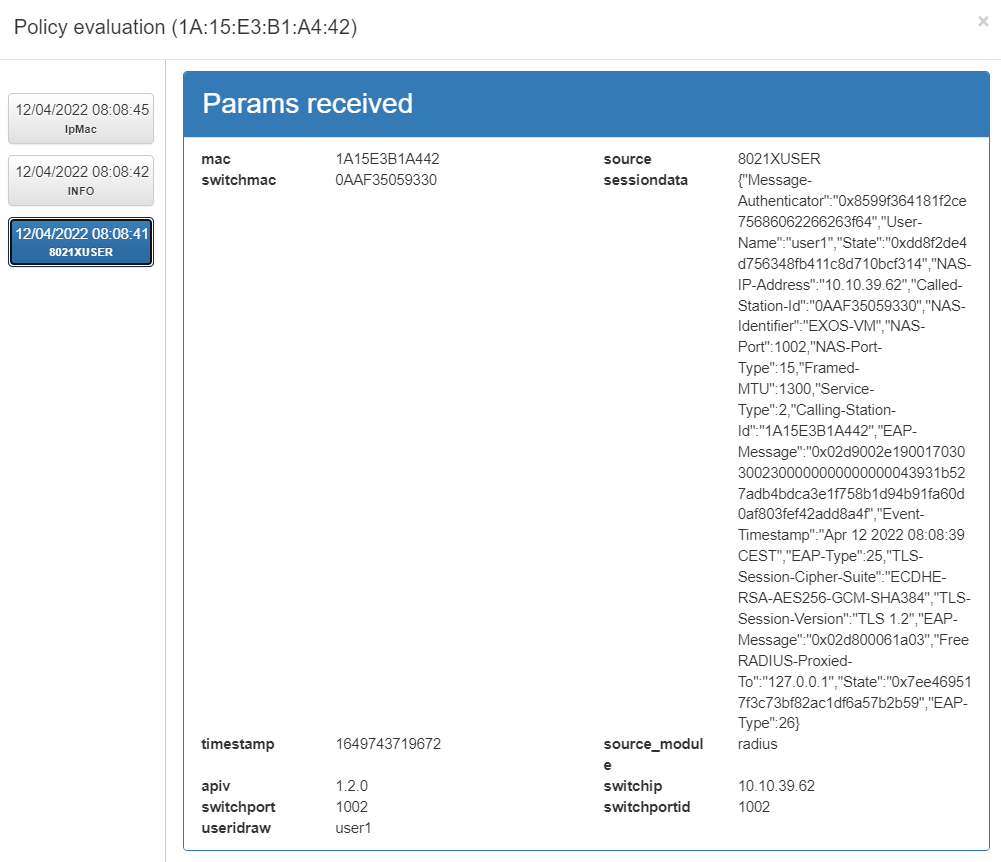
Params received: Parameters that are obtained from the event received in the system. This information includes the MAC of the device (mac), the type of event (source), IP of the switch from which it is received (switchip), etc.
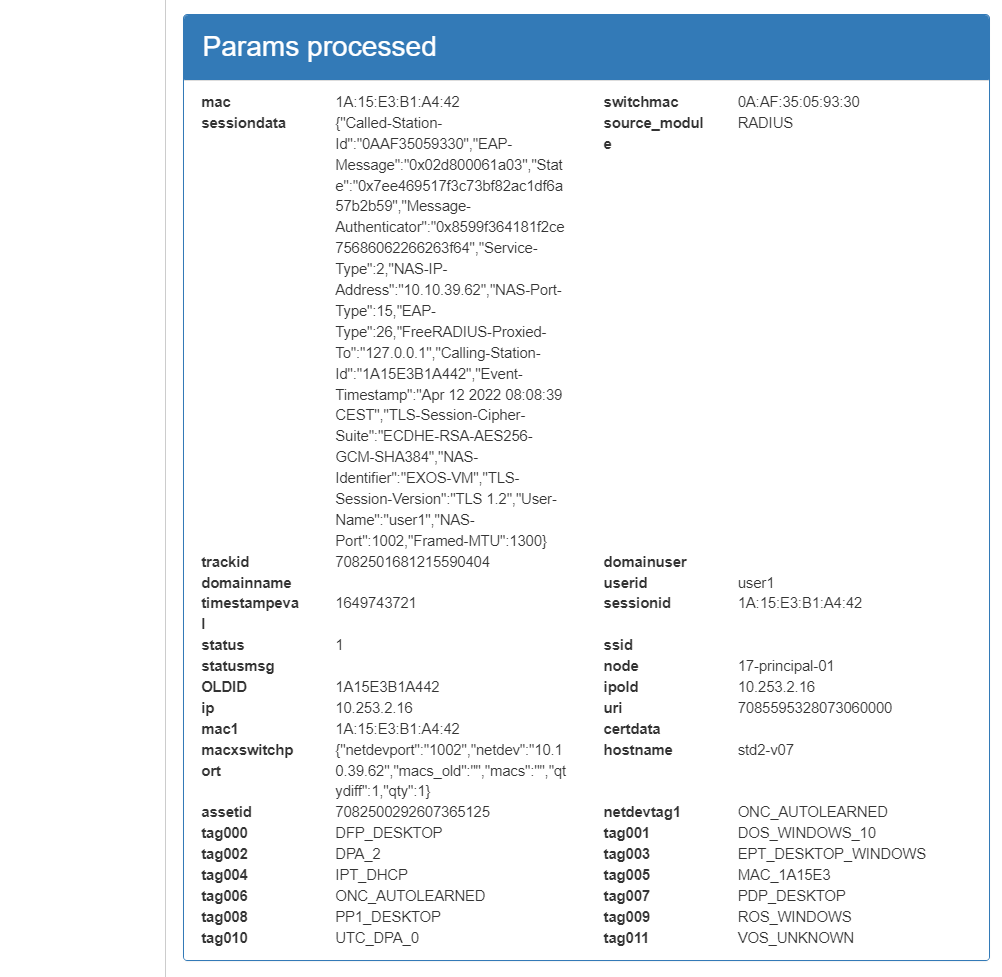
Params processed: These parameters correspond to the information that has been processed by the system and will be stored. This includes information received externally as well as information generated internally, such as device TAGS.
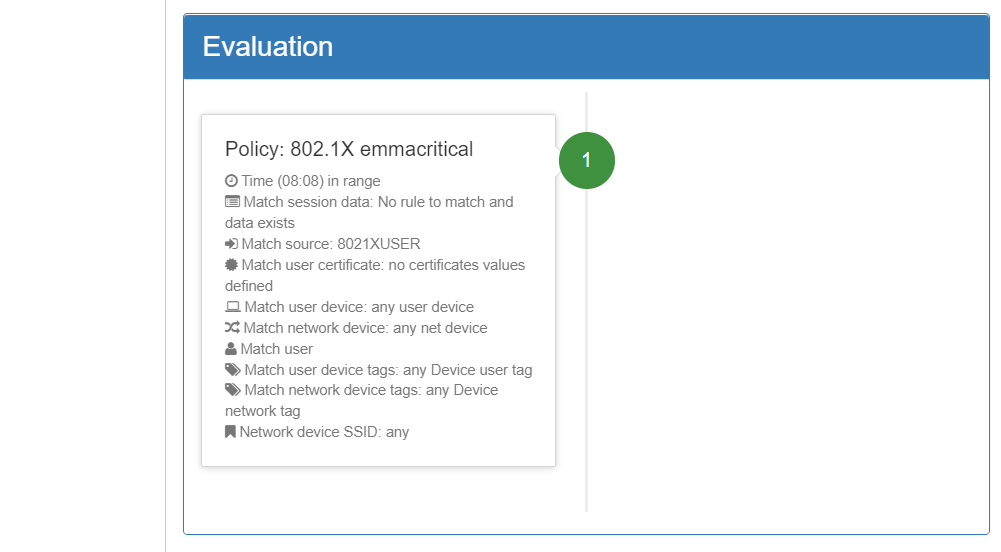
Evaluation: The policy evaluation flow is shown here. Following the order defined in policy creation, the preconditions are evaluated to determine whether or not it should fit the policy. For each evaluated policy, the first precondition that discards it will be shown (in red) until reaching the policy to which it matches. There are events that do not generate a policy evaluation, so this section will not be displayed.
The information that this window offers us is very useful to understand why a device is entering one policy or another and to be able to see the parameters received in order to make the necessary adjustments to the policies.
4.2.6.2.3. Policy Features
For each of the entries in the list of Business Profiles we can find the icon “Policy details” in the Policy column.
By clicking on this icon, a new window will open like the following one:
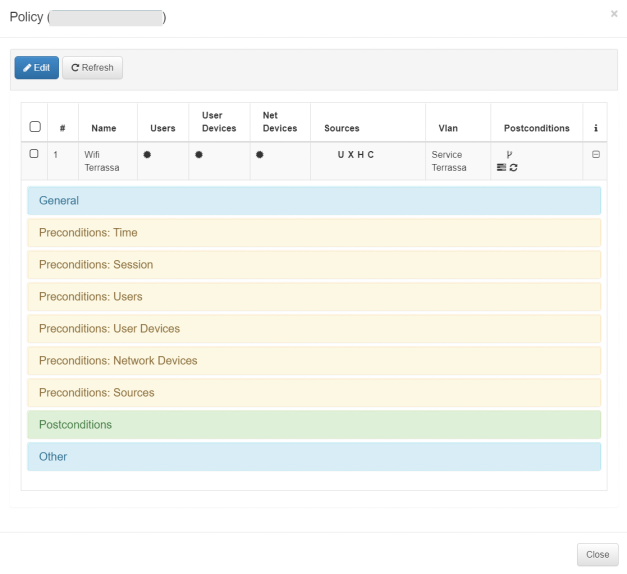
This window will show the configuration of the last policy in which the device has been included. We can see all the configured parameters of said policy:
General: General characteristics of the policy (Name, description, status).
Preconditions: Conditions that must be met for a device to fit into that policy. There are several preconditions with different functionalities.
Postconditions: Actions that will be executed in case a device fits the policy.
If you have administrator permissions, it will also be possible to edit said policy by selecting it and pressing the “Edit” button.
Note
To learn more about the configuration of policies, we can consult Admon Portal Configuration.
4.2.6.2.4. Toggle Port
Policy reassessments are sometimes required for certain sessions. This allows us to apply modifications to the sessions if any policy changes have been made or simply force a re-authentication. For this we have the Toggle Port functionality in the Business Profiles.
If we want to perform a Toggle Port to any of the sessions that exist in the Business Profiles, we simply have to select the session and click the “Toggle Port” button at the top.

Pressing the button will send a request to the network device where the client has been authenticated to perform a disconnection and a subsequent connection. It will force a reauthentication and reevaluation of the policies.
Note
The Toggle Port functionality must be previously configured for the network device.
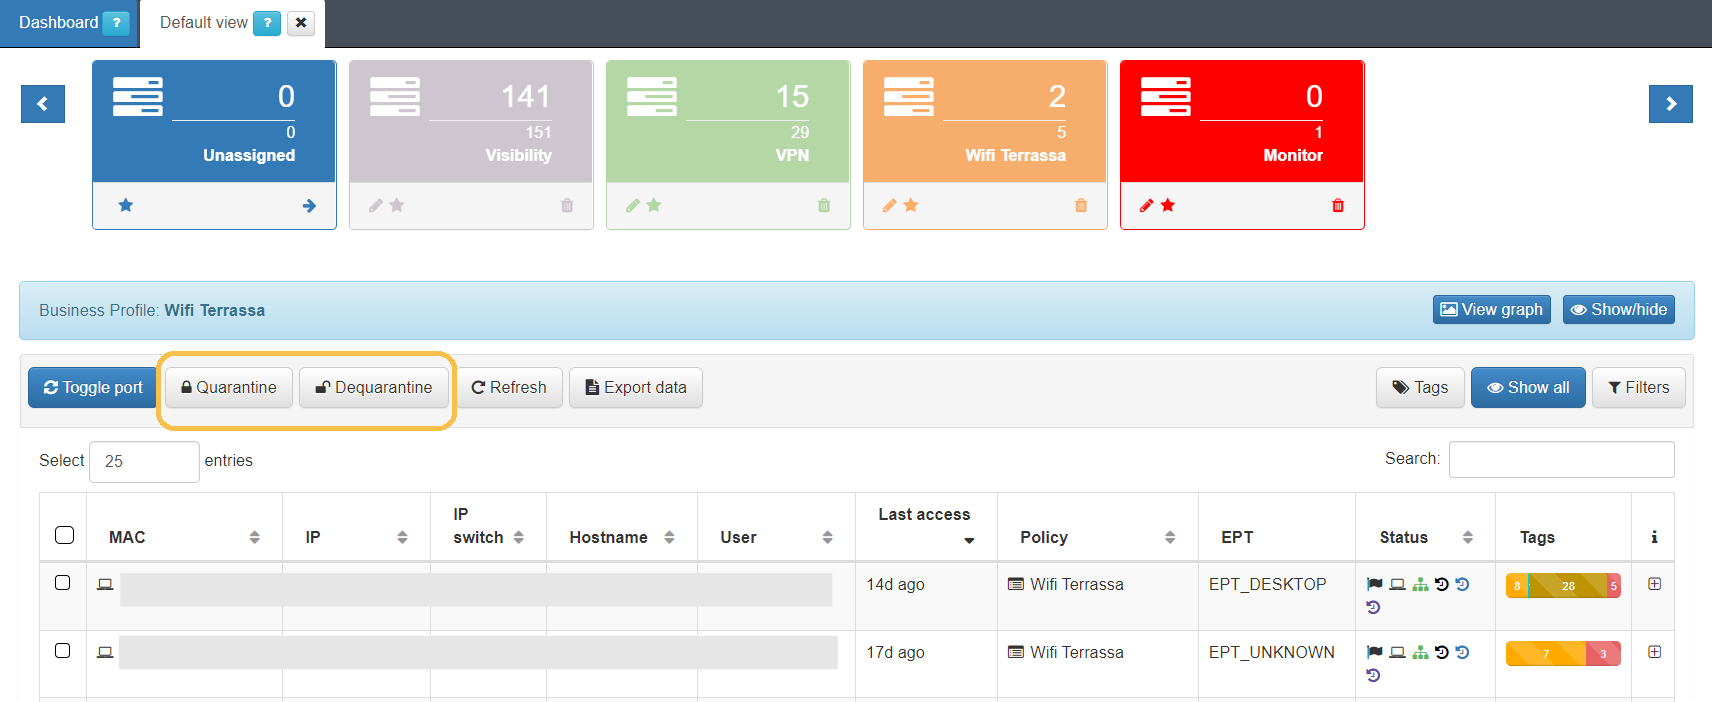
4.2.6.2.5. Quarantine/Dequarantine
There is the possibility of isolating or moving devices to the “Quarantine” through the Business Profiles. This functionality is based on the Segmentation module. To use it, we must configure said module, explained in Segmentation module.
Quarantining a device adds a tag to the quarantined user.
If we want to quarantine any of the sessions that exist in the Business Profiles, we simply have to select the session and click the “Quarantine” button at the top.
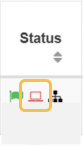
In the status column, it will appear as “User Device in quarantine”:
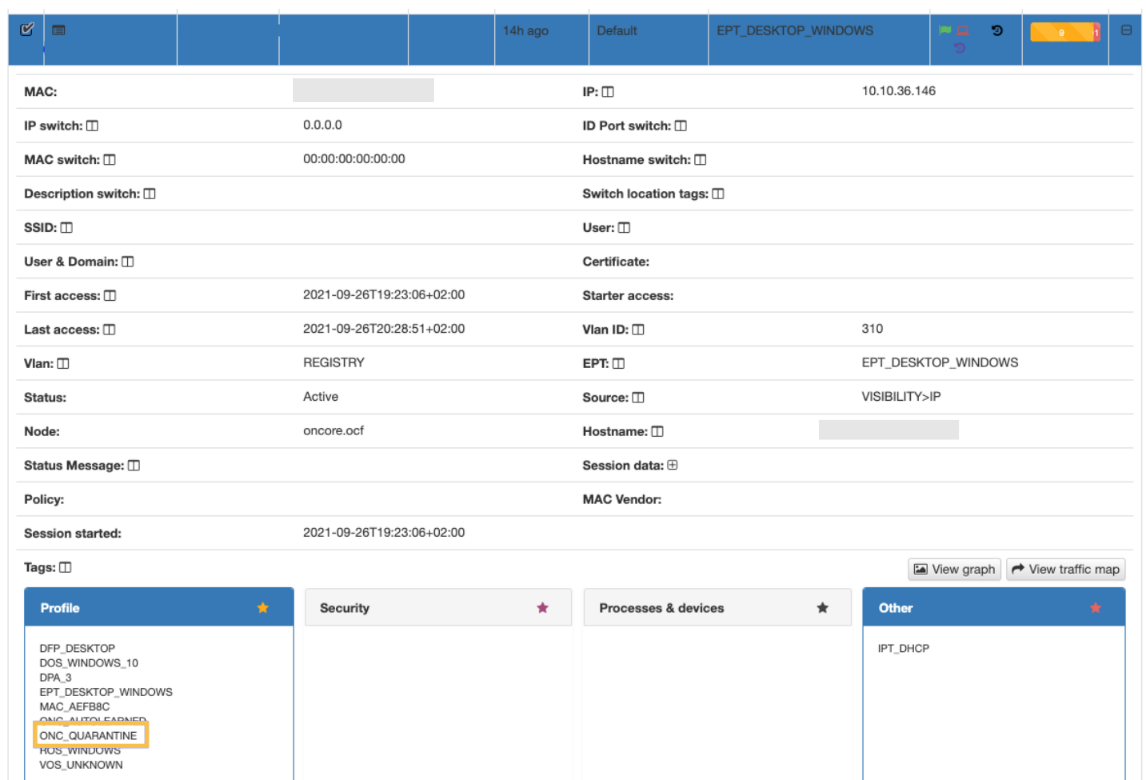
In the profile of the device we can see that the tag “ONC_QUARANTINE” has been added, indicating that this device is in quarantine.
To remove the device from quarantine, we simply have to select it and click the “Dequarentine” button.
For a correct operation of the quarantine functionality, a correct configuration of policies “ON NAC -> Policies” is necessary, where there is a policy for the group of users in quarantine.
4.2.6.2.6. Filtering in Business Profiles
Within the Business Profiles it is possible to use filters to search for specific information or a group of sessions with the same characteristics.
In the Business Profiles we have two types of filters:
Filtered by Information: This filter is based on the characteristics of the sessions. This includes all information that the system has collected during the session.
Filtering by Tag: The filtering of Tags is based on the search for specific Tags of the devices within the Business Profiles.
Important
It is not possible to filter by information and by Tags simultaneously.
4.2.6.2.6.1. Filter by Information
To apply an information filter we must open the drop-down menu within the Business Profile using the “Filters” button:
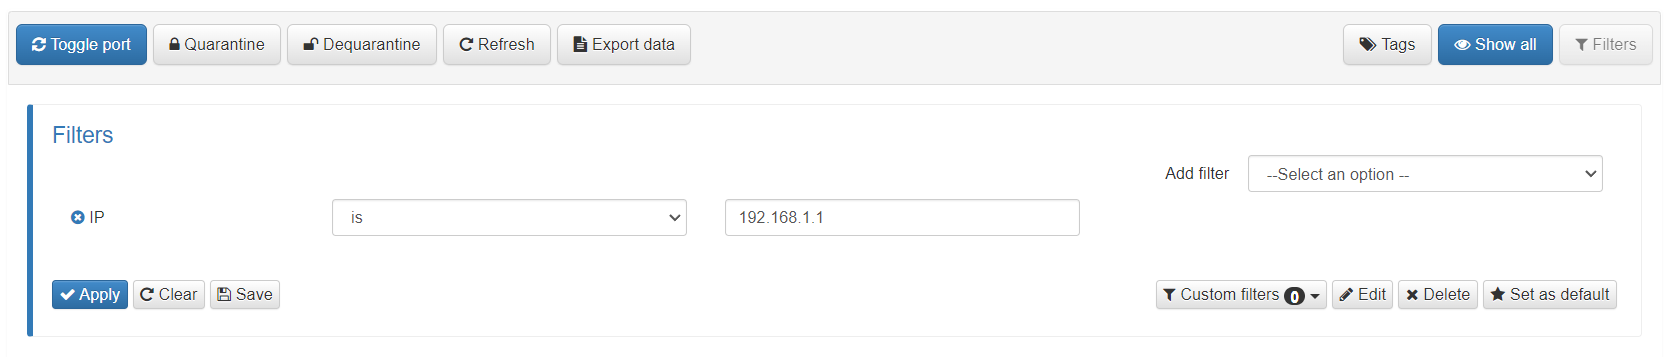
Once the dropdown is open, we can add as many filters as we want from the “Add filter” list. We can add several filters that will act in the form of AND (&&) so all the conditions must be met for the results to appear in the Business Profile list.
For each added filter, a list of said filters will appear where we can select the operator (is, less than, starts with, etc.) and the value by which we want to filter. Depending on the data to be filtered, we will have some operators or others.
To apply the filter, we must press the “Apply” button so that the Business Profile entries are updated with the filtered data.
To eliminate the applied filters, we simply have to press the “Clear” button.
There is the possibility of saving the filters that we generate by pressing the “Save” button. This way, if we wish to use the same filter another time, we will find it already defined in the list of “Custom filters”. Once these custom filters are saved, we can edit, delete, or define them by default with their corresponding button.
4.2.6.2.6.2. Filtered by Tag
To apply a Tag filter we must open the drop-down menu in the Business Profile using the “Tags” button:
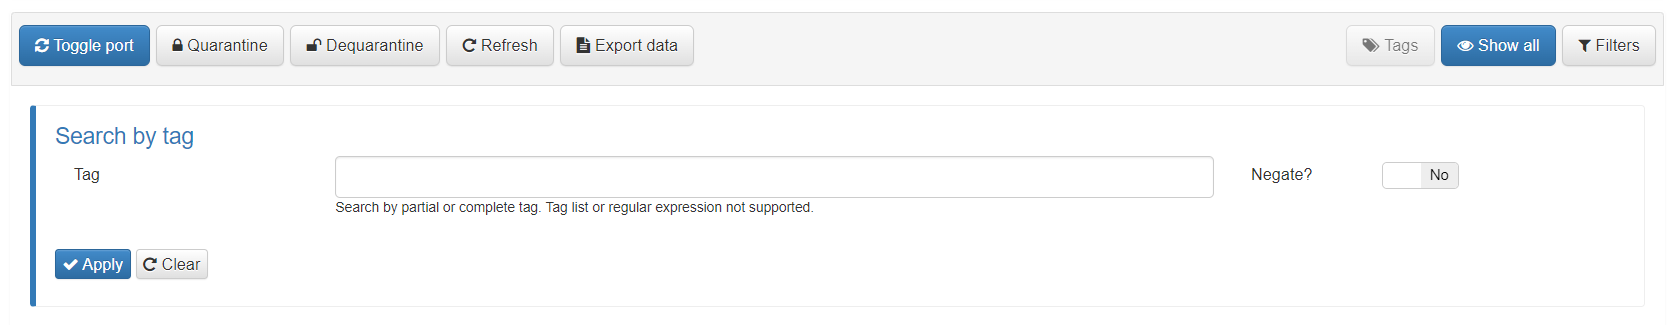
Once the dropdown is open, we can add the Tag we want to filter by in the “Tag” dialog box. Said Tag can be partially or completely defined. There is the possibility of denying the filter, that is, showing all those entries that do not contain the defined Tag. To do so we must activate the “Negate” check.
Tag filtering only allows the use of one tag at a time and the use of regular expressions is not supported.
To apply the filter we must press the “Apply” button so that the Business Profile entries are updated with the filtered data.
To eliminate the applied filters we simply have to press the “Clear” button.
4.2.6.2.7. Creation of Business Profiles
To access the “Business Profiles” window we have to go to “ON NAC -> Business Profiles -> Default View”.
There is no limit on the creation of profiles. All the necessary ones can be created to group events from our system. Remember that these events are generated by having matches with the policies that are configured.
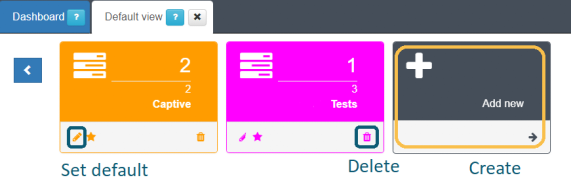
At the top of the window, we will have the section where we can create and delete profiles. To create a new one, we scroll to the end of the list of profiles and click on Add new. To delete a profile, we look for it in the list and click on the trash can icon.
You can also define a profile that will open by default when accessing the window. For this, we look for the desired profile and click on the star icon
To create a profile you have to define certain parameters:
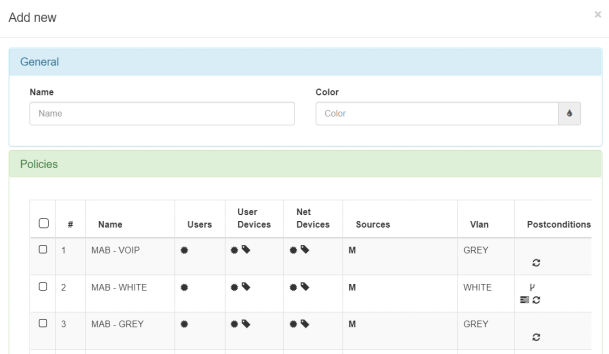
Name: Name for the “Business Profile”.
Color: A palette of colors to choose from for the profile is displayed.
Policies: All the created policies are listed from which to choose to associate them with this “Business profile”.
Although multiple policies can be chosen for a profile, it is recommended that only one policy be attached per profile. This limitation can help prevent misinformation from being displayed in our ON Analytics node.
When defining policies, two grouping criteria can be followed; managerial or technical:
Based on management requirements: Criteria can be used, such as identifying departments among themselves, classifying the users of said departments.
Based on technical requirements: Criteria can be used such as the type of authentication being used (MAB, 802.1x, etc.), the location, the characteristics of the user’s device, the type of user, the type of access to network.
Once we have the “Business Profile” created, we will be able to access it if we click on its name. Once we click on one of these profiles we will see all the different devices that have “matched” the policies of that profile.
4.2.6.2.8. Creating groups of Business Profiles
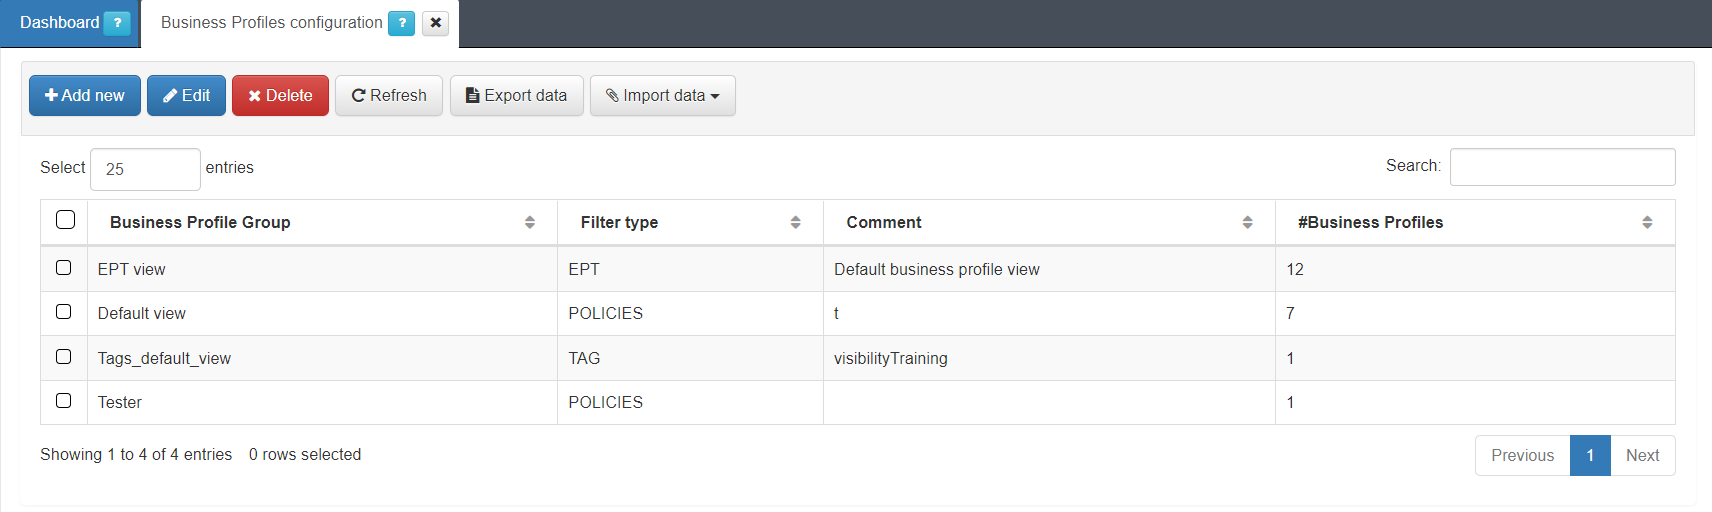
There is also the possibility of creating Business Profile Groups. For this, access the “ON NAC -> Business Profiles -> Business Profiles Configuration” section.
This window shows the different groups that have been created, with their type of filter, their comment and the total number of profiles that are included in said group.
To create a new group, click on Add new to display the following window:
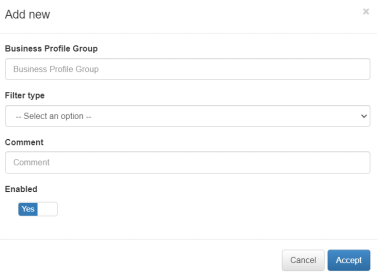
Business Profile Group: Name of the “Business Profile” group.
- Filter type: Selection of the type of filter desired for that group.
POLICE
EPT
TAG
Comment: Description of the group
Enabled: Allows you to enable or disable the group
Once we create the group, as indicated in the window, the portal will be updated in a few seconds. When the update process is finished, we will be able to see and access the group we have created.
4.2.6.3. CMDB - User Devices
The CMDB is the ON Core database, in this database we find information related to the system, infrastructure, networks, VLANs, Security Profiles, user devices, network devices, etc. In this section we will find all the “User Devices” that have accessed the network.
To access this section, go to “ON CMDB -> User Devices”. Here we will find a list with all those devices that have ever been connected to the network and have been discovered by the system.
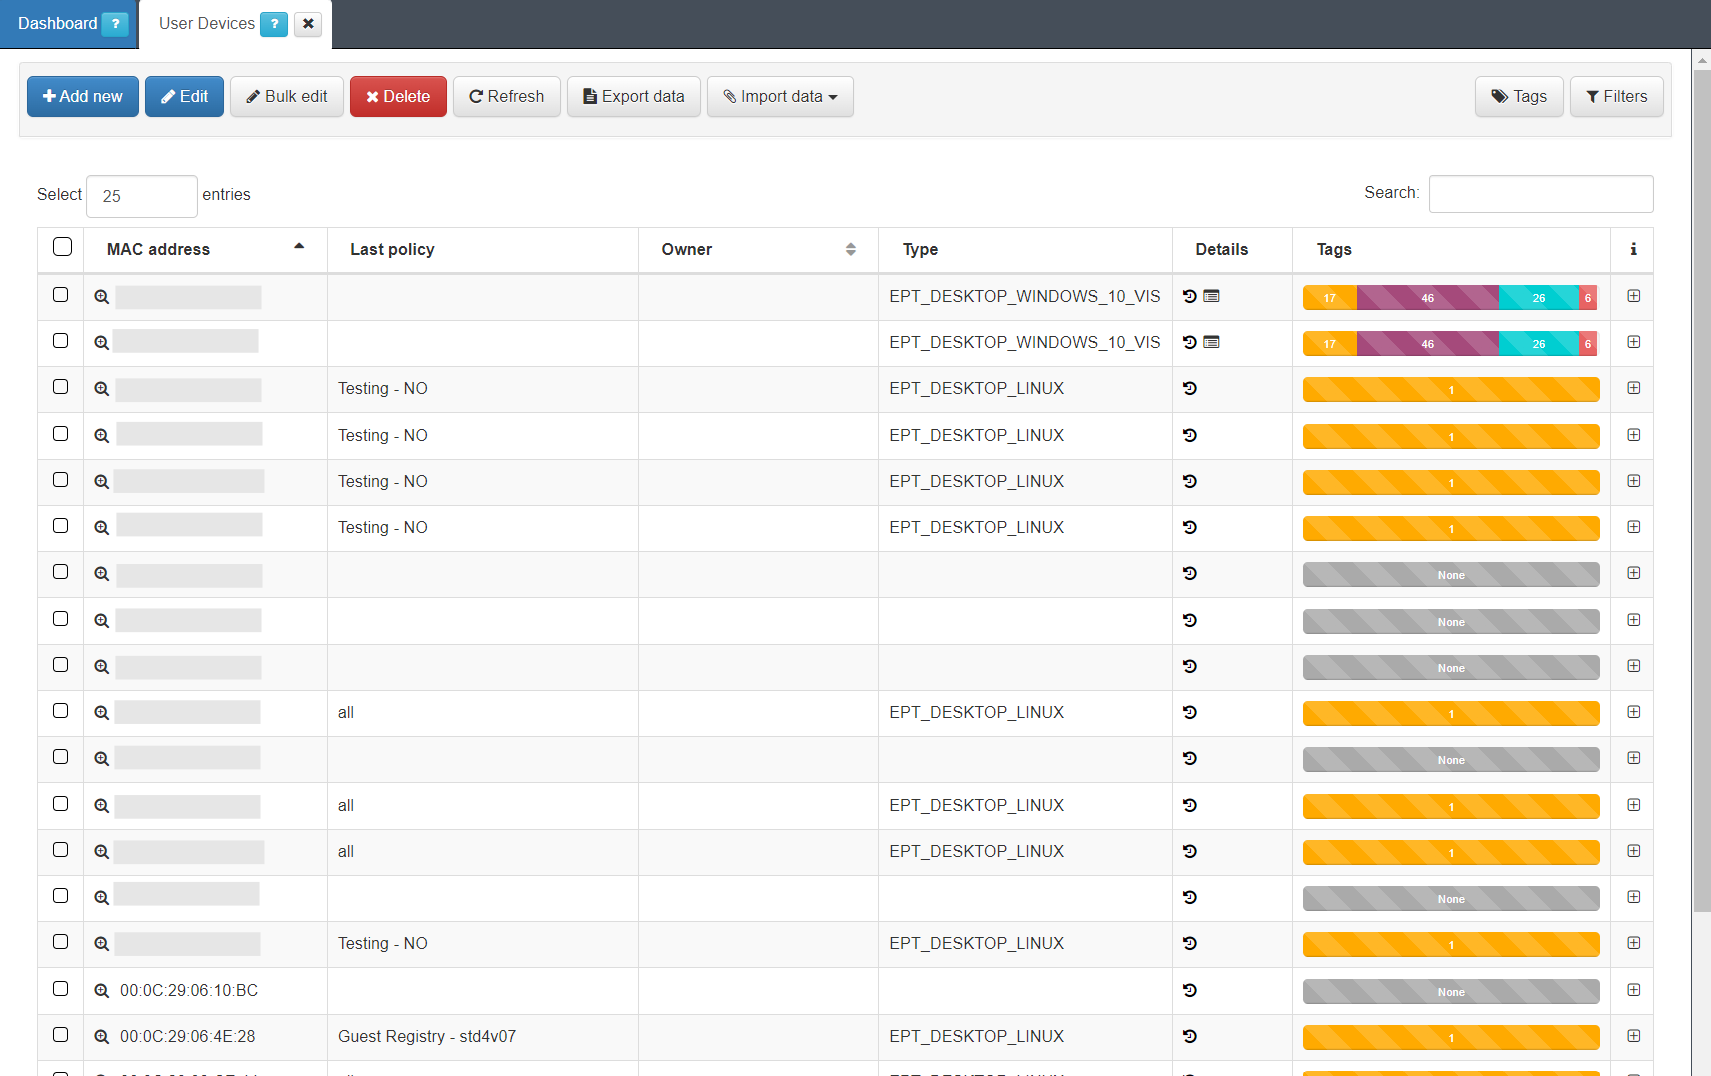
Each of the columns tells us certain information about the device. We can expand this information by pressing “+” on the right end of the device row.
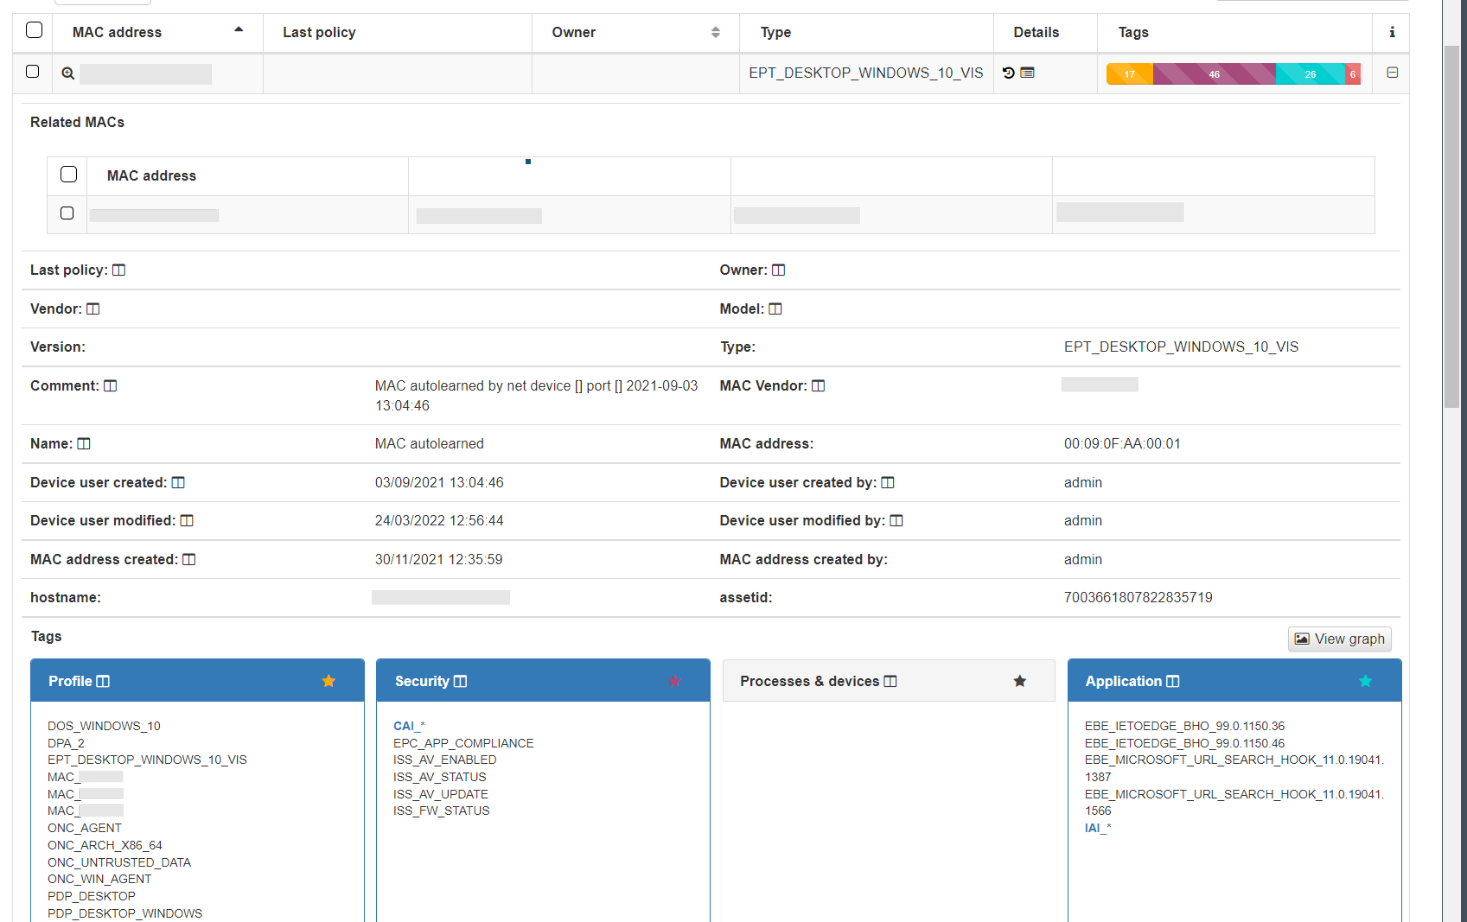
In the dropdown with the device information, we can see the basic information, MAC, Type, creation date, Hostname, etc. This information is similar to what we can have in the Business Profiles, but in this case, information about the status of the connection is not displayed, only information related to the characteristics of the device. At the bottom we find the blocks sorted by categories, where all those Tags* assigned to this device are specified.
In the CMDB - User Devices it is possible to apply the filters by information and by Tag as in the Business Profiles.