3.2.3.6.1. Payloads
Once the Agent is properly installed and established communication with the ON Core, it will start sending messages to the ON Core. These messages are called payloads and they are compressed and stored in the database (DDBB).
The API retrieves the last authentication status on each Agent response. It also sends, saves and displays the user ID of the person who authenticated the Agent.
See more details about the data exchange process in the Agent Doc section, which showcases examples of data extracted from devices by the Agent and transmitted between OpenNAC Enterprise and the Agent.
3.2.3.6.1.1. Toolbar
The toolbar helps you quickly find specific payloads, and configure Agent log setting. Let’s explore it from left to right ->.

Search: Search specific payloads from , host, MAC address, or user.
Delete all: This button deletes all payloads.
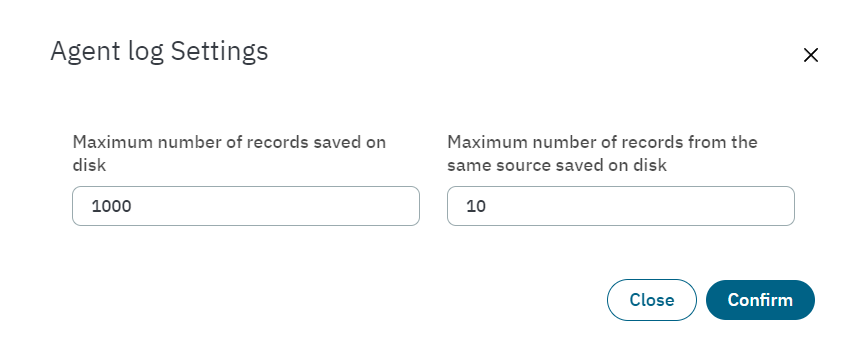
Agent log settings: Define the maximum number or records and records from the same source saved on disk.
Refresh: Refresh to the reestablish the default values.
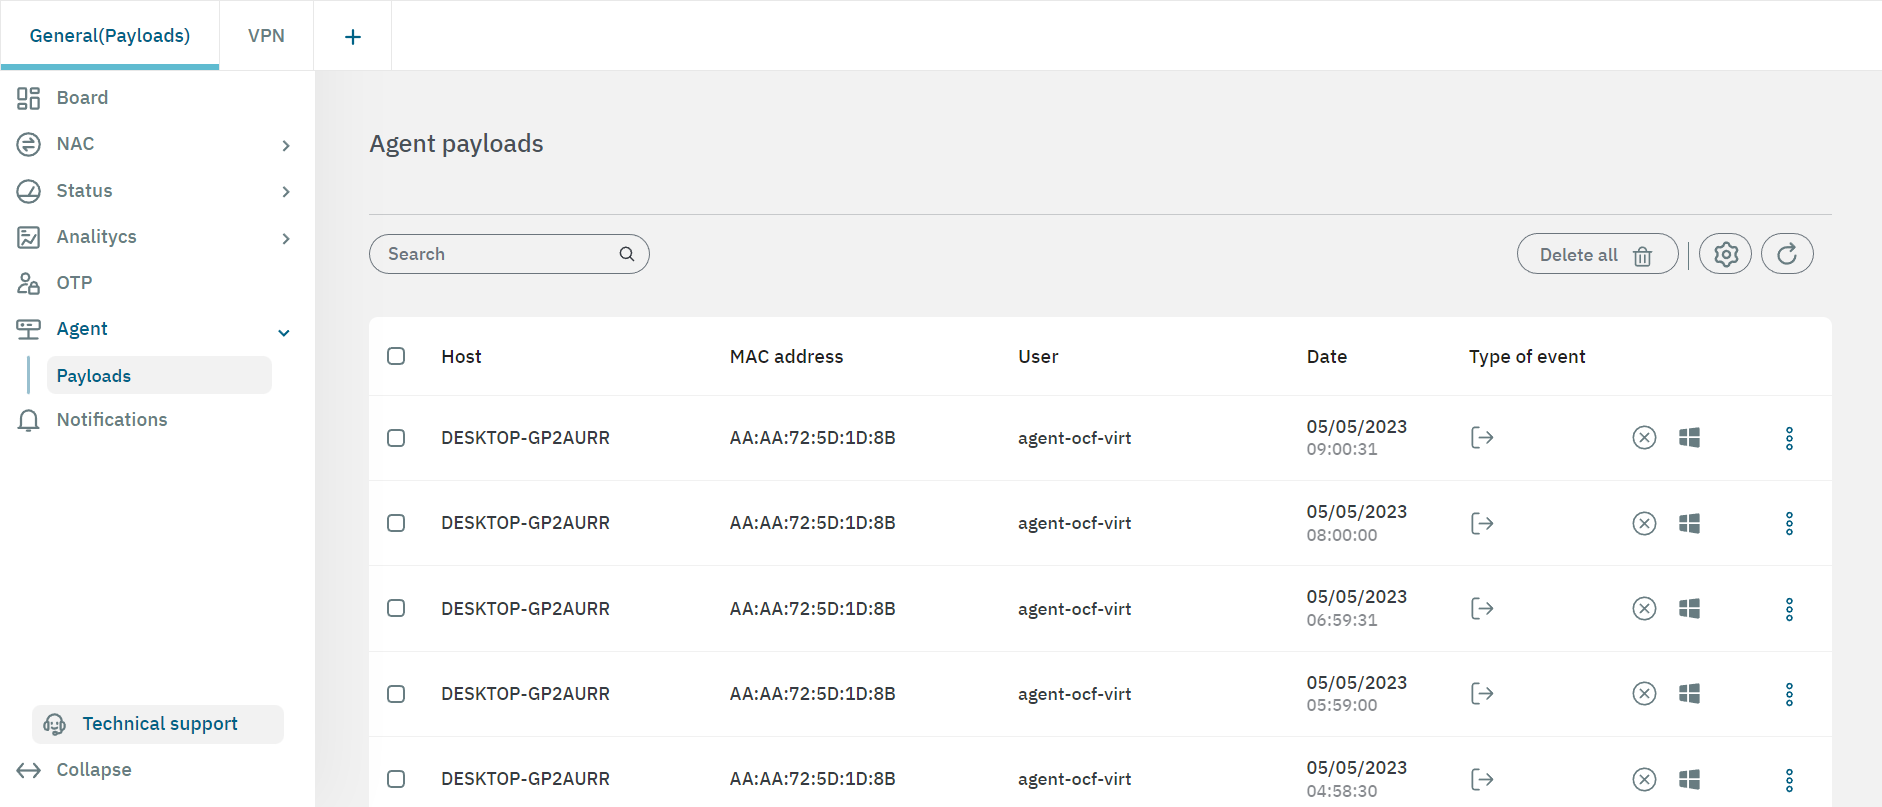
3.2.3.6.1.2. Agent Payloads table
Moving on to the Agent Payloads table, the following columns are displayed:
The table displays the Host, MAC address, User, Date of every corresponding payload, the Type of event, and the Operating System.
Hover over the type of event icon to display its meaning. The events can be:
Full scan
Network Address changed
Product changed
Scan requested by user
Security center changed
Scan
Session changed
Stop agent service
Uninstall agent service
Soluble
Firewall state changed
Server connection recovered
Apart from that, at the end of each row, there is a three-dot icon that can expand the payload information:
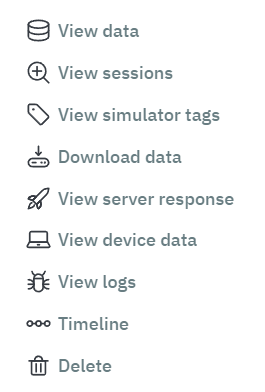
3.2.3.6.1.2.1. View data
The View data section displays the content of the payload:
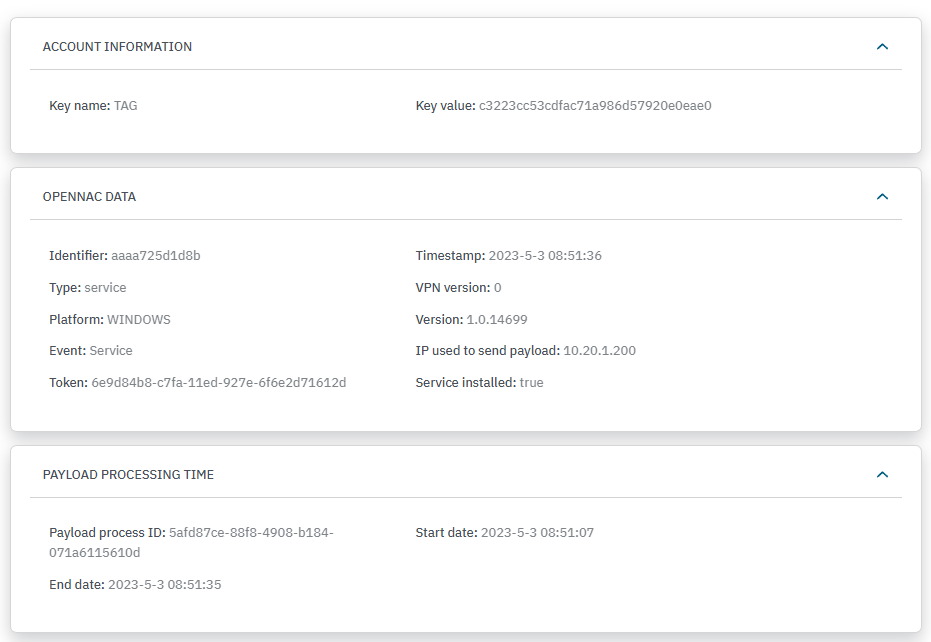
ACCOUNT INFORMATION: Displays the key name and the key value.
OPENNAC DATA: Displays the identifier, timestamp, data type, VPN version, platform, agent version, event, IP used to send the payload, if the service is stopped and finally if the service is installed.
PAYLOAD PROCESSING TIME: Displays the payloads process ID and the start and end time of the payload.
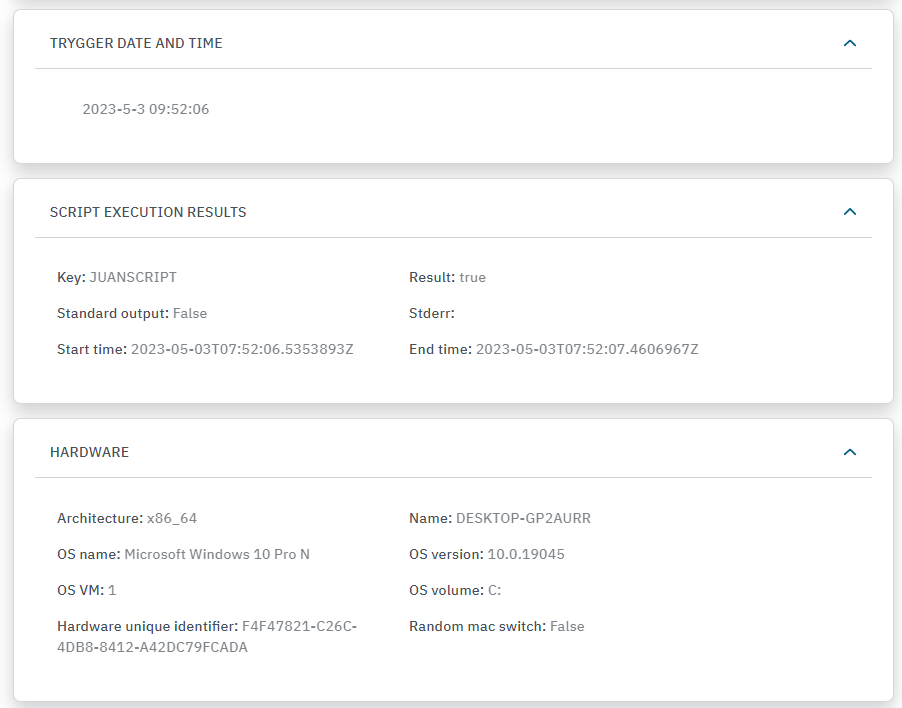
TRIGGER DATE AND TIME: Displays the date and time the trigger is finished.
SCRIPT EXECUTION RESULTS: Displays the name of the Script executing in the host, the key of the script, the result, the standard output and the start time and end type. These scripts are configured in the Configure view Agent -> Agent scripts.
HARDWARE: Displays the system architecture, the name of the system where the agent is, the OS name, the OS version, the OS VM, the OS volume, the serial number, the hardware unique identifier, and if the device is using random MAC. If the Random MAC switch is set to true, the HDT_MACRANDOM tag will be added to the device.
Note
If the Agent is soluble and is not executed as sudo, the machine UUID and OS_VM flags won’t be returned in the Hardware section.
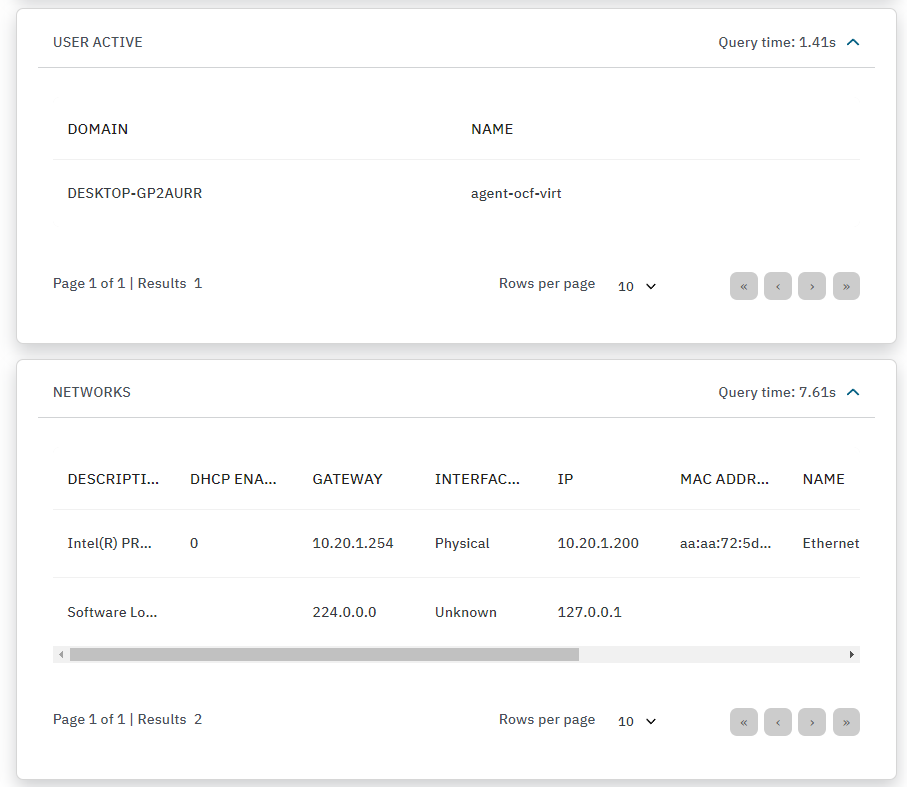
USER ACTIVE: Displays a list of the active users running on the host. We can find the domain and the name of the active user. When an OSQuery fails, this field will display the following error message: “A problem occurred when obtaining information about this entity”.
NETWORKS: Displays a list of the interfaces of the host machine. We can find the description, if the DHCP is enabled, the default gateway, the interface type, the IP of the interface, the MAC address, the name, the status, if it has a random MAC, and the type from each interface in the list.
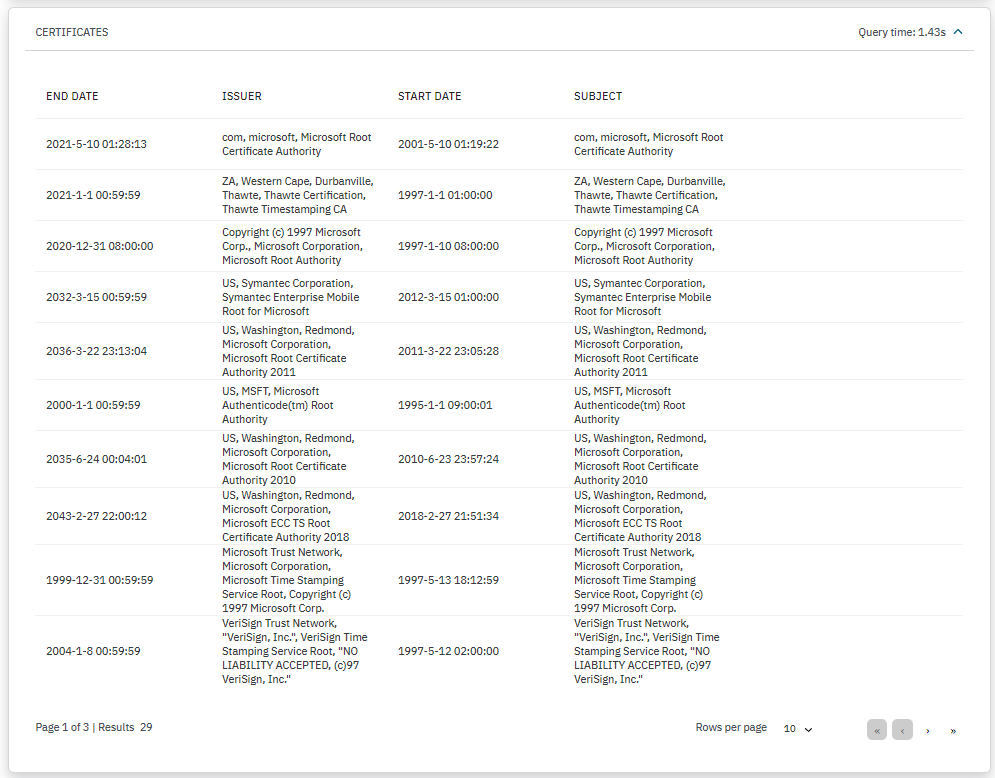
CERTIFICATES: Displays a list of the certificates found on the host. We can find the end date, the issuer, the start date, and the subject from each certificate in the list.
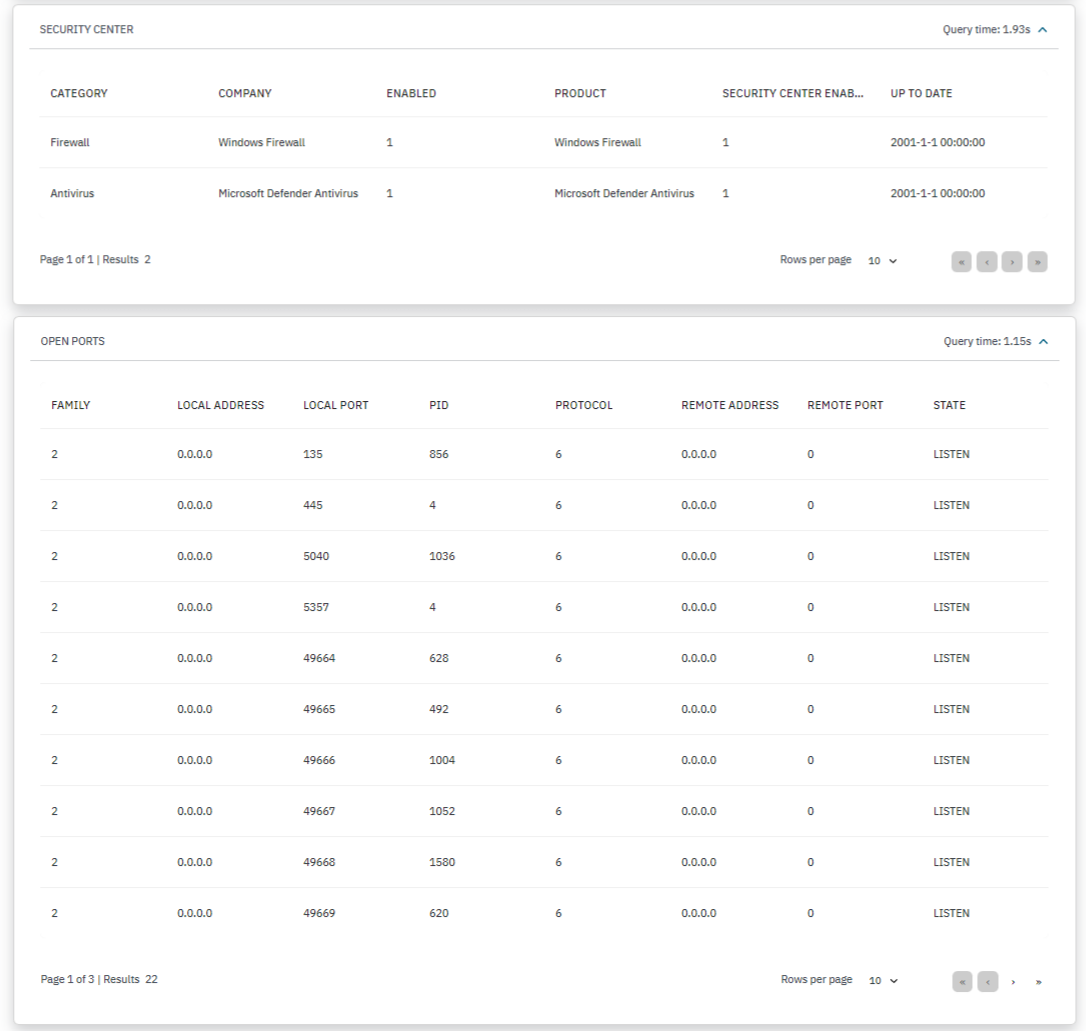
SECURITY CENTER: Displays a list of the security instances running on the host, like firewalls and antivirus. We can find the category, the company, if it is enabled, the product, if the security center is enabled, and if it is up to date from each security center in the list.
OPEN PORTS: Displays a list of all the open ports of the host. We can find the family number, the local address, the local port, the process ID, the protocol, the remote address, the remote port and the state from each open port in the list.
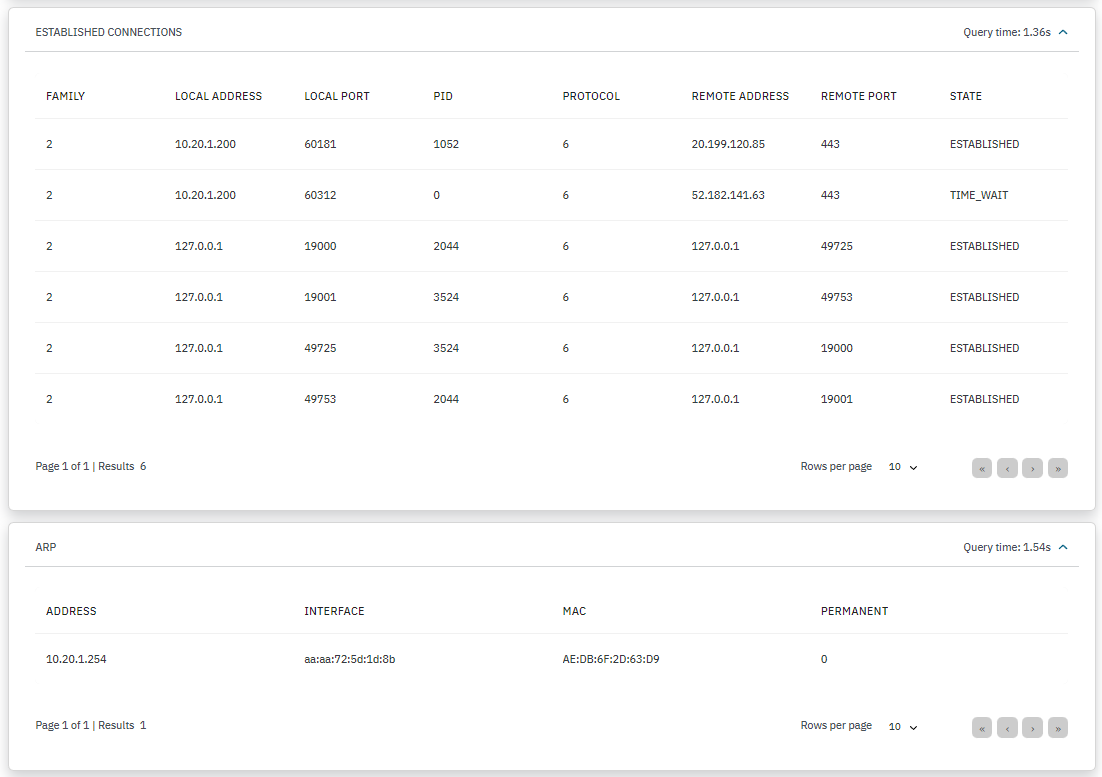
ESTABLISHED CONNECTIONS: Displays a list of the host connections: the family number, the local address, the local port, the process ID, the protocol, the remote address, the remote port, and the state from each connection in the list.
ARP: Displays the IP address, the interface, the MAC address, and ARP entries.
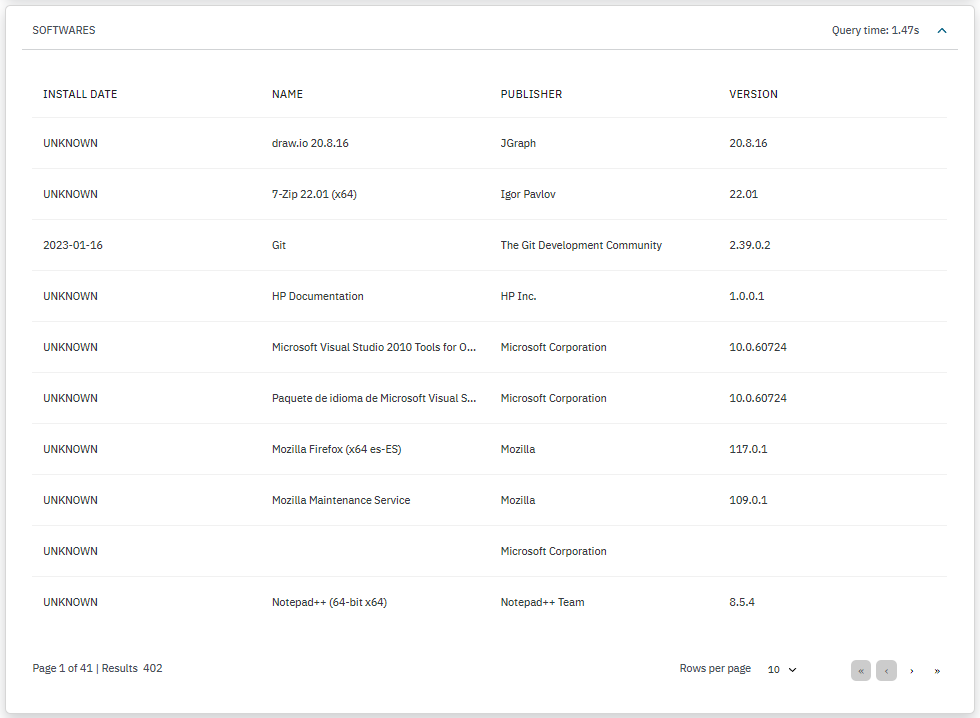
SOFTWARES: Displays a list of softwares installed detailing the installation date, their publishers, and software version.
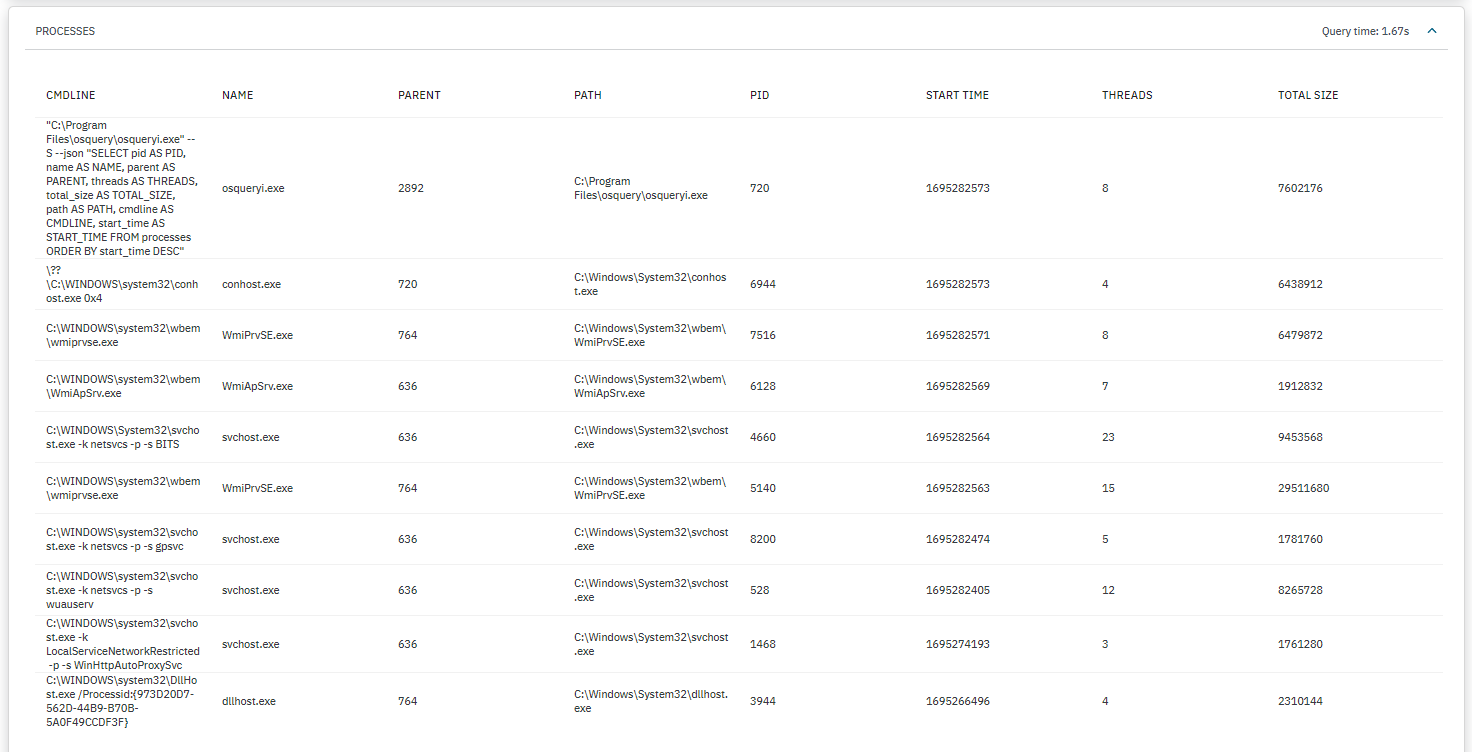
PROCESSES: Displays a list of processes detailing their command line, parent process, path, PID, start time, threads and their total size.
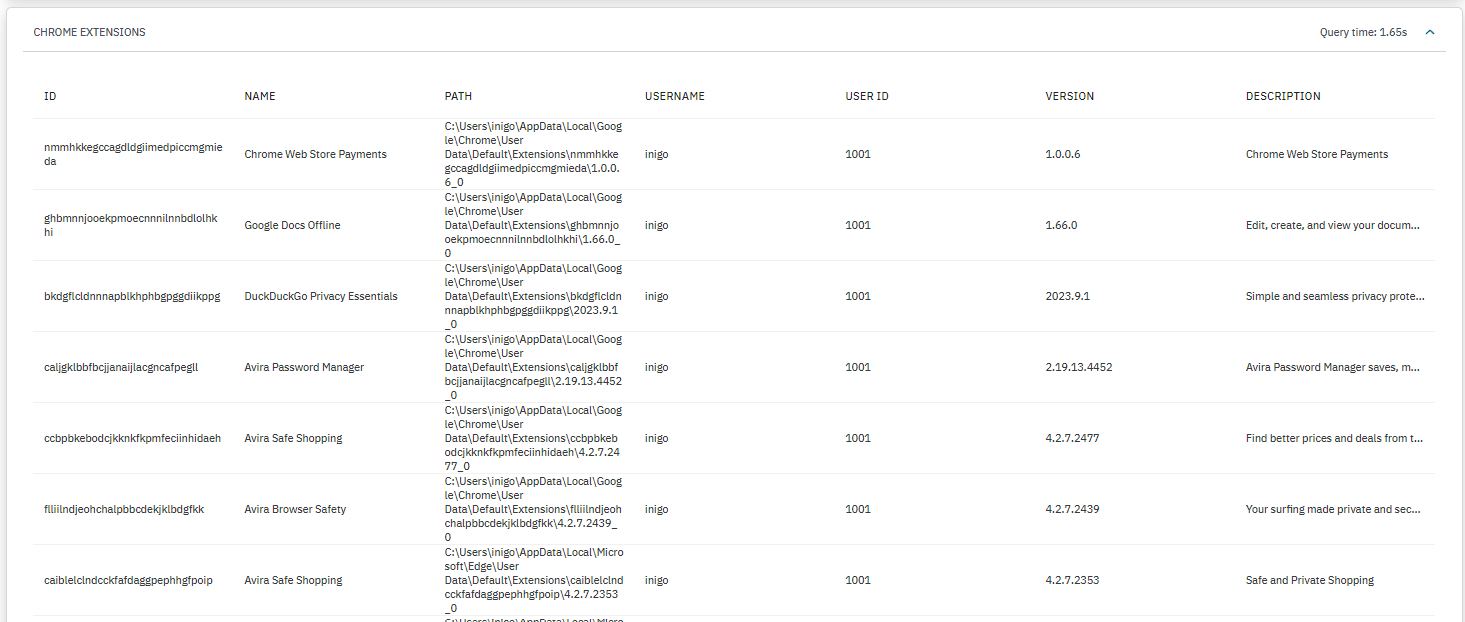
CHROME EXTENSIONS: Displays a list of Google Chrome browser extensions installed detailing their ID, path, user ID, version and description.
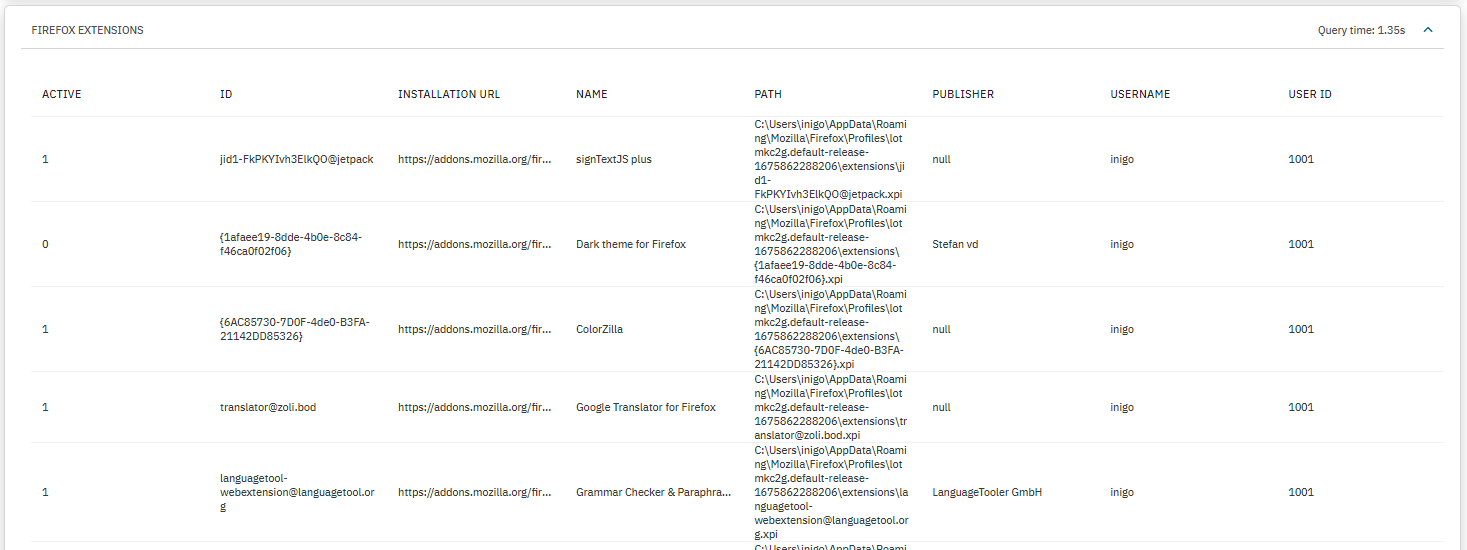
FIREFOX EXTENSIONS: Displays a list of Firefox browser extensions installed detailing if they are currently active, ID, installation URL, path, publisher, username, and user ID.
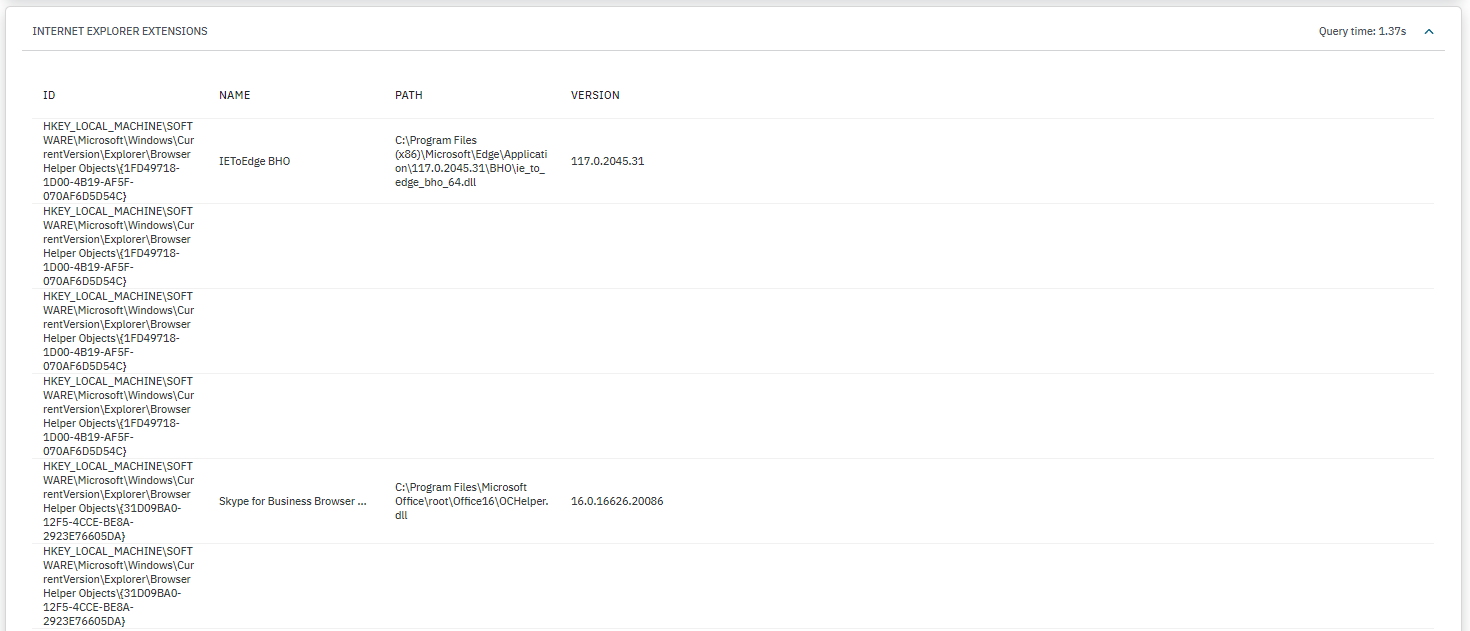
INTERNET EXPLORER EXTENSIONS: Displays a list of Internet Explorer browser extensions installed detailing their ID, path, and version.
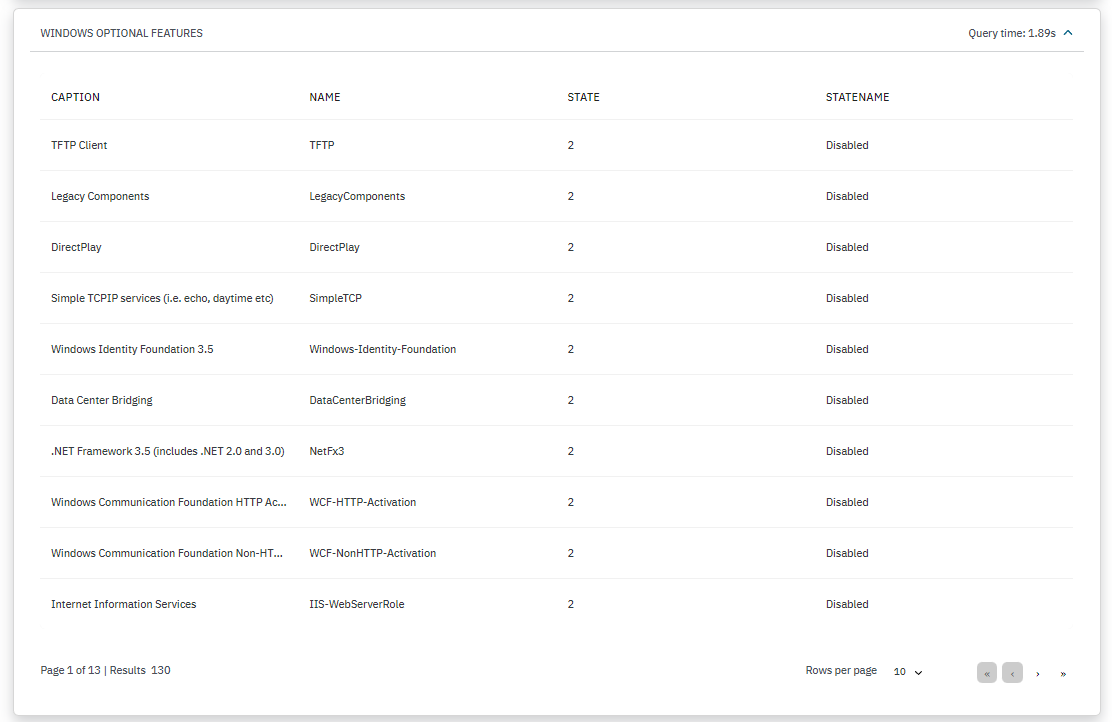
WINDOWS OPTIONAL FEATURES: Displays a caption, a name, the state and the state name for a specific Windows feature.
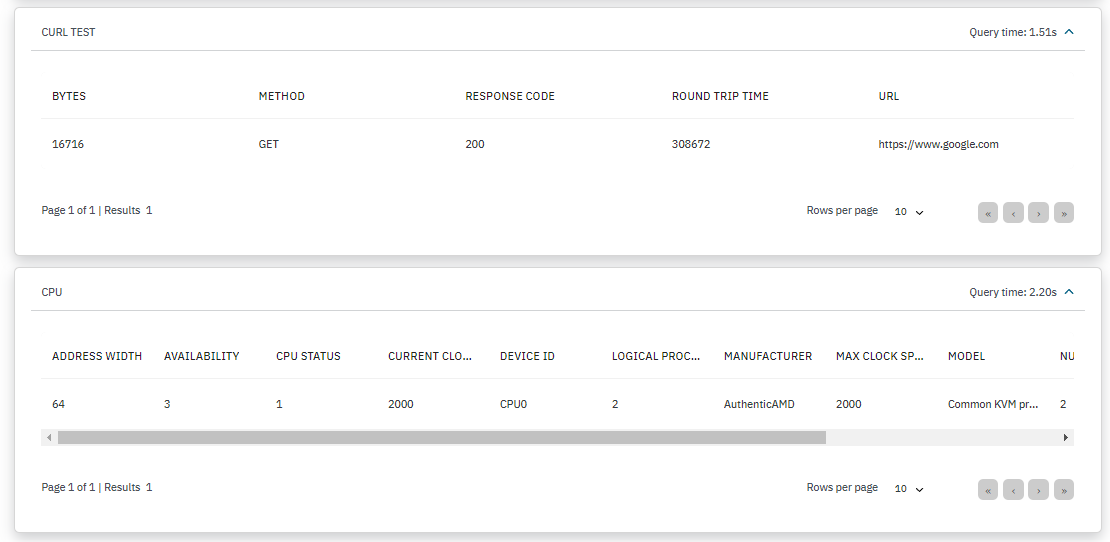
CURL TEST: Displays the bytes, method, response code, round trip, and URL.
CPU: Displays the address width, availability, CPU status, device ID, logical processors, manufacturer, max clock speed, model, number of cores, processor type, and socket designation.
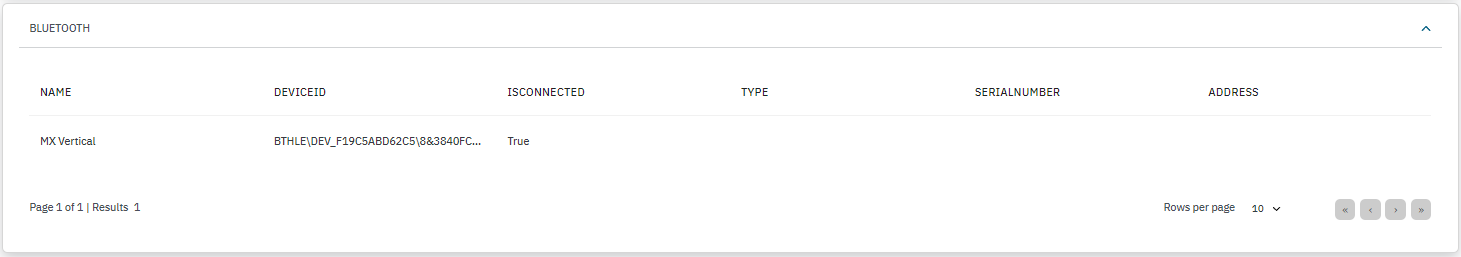
BLUETOOTH: Displays a list of bluetooth connected devices detailing their device ID, connection state, type, serial number, and address.
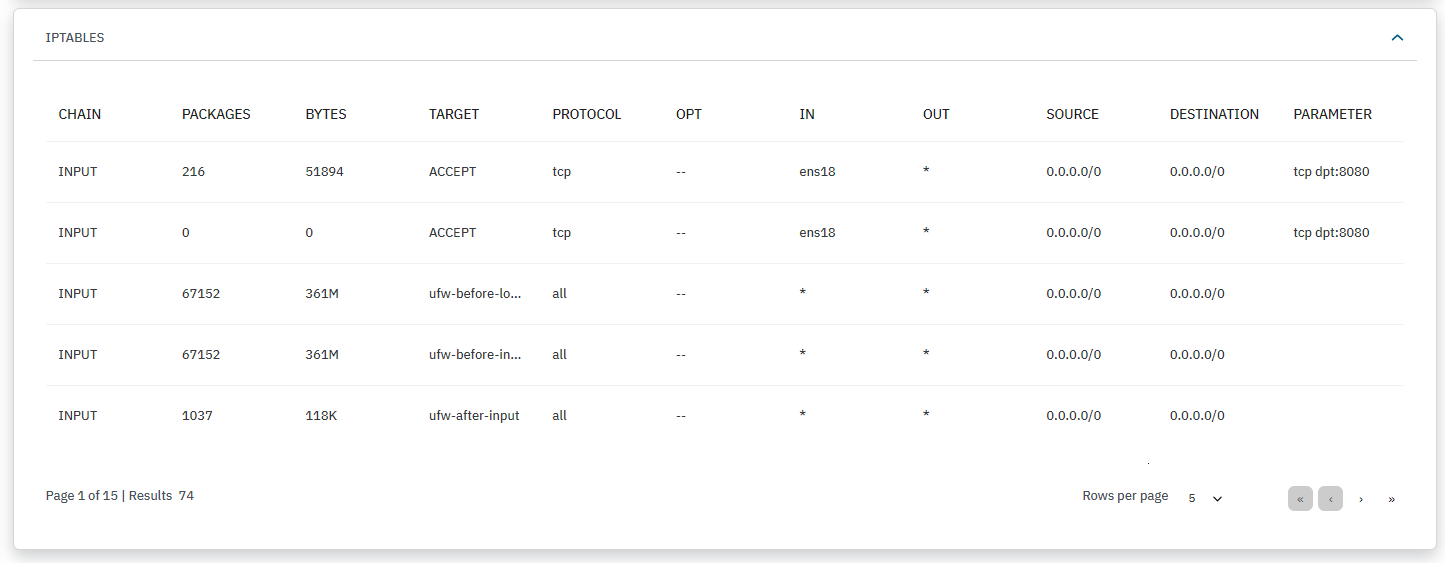
IPTABLES: Displays details about the iptables configuration, facilitating analysis of network traffic filtering.
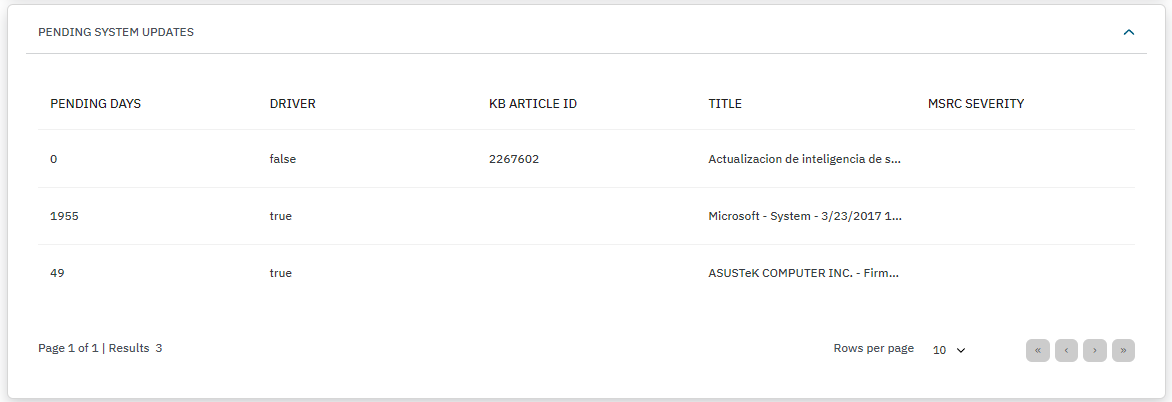
PENDING SYSTEM UPDATES: This section displays pending uninstalled updates awaiting execution. For example, Security Intelligence Update for Microsoft Defender Antivirus.
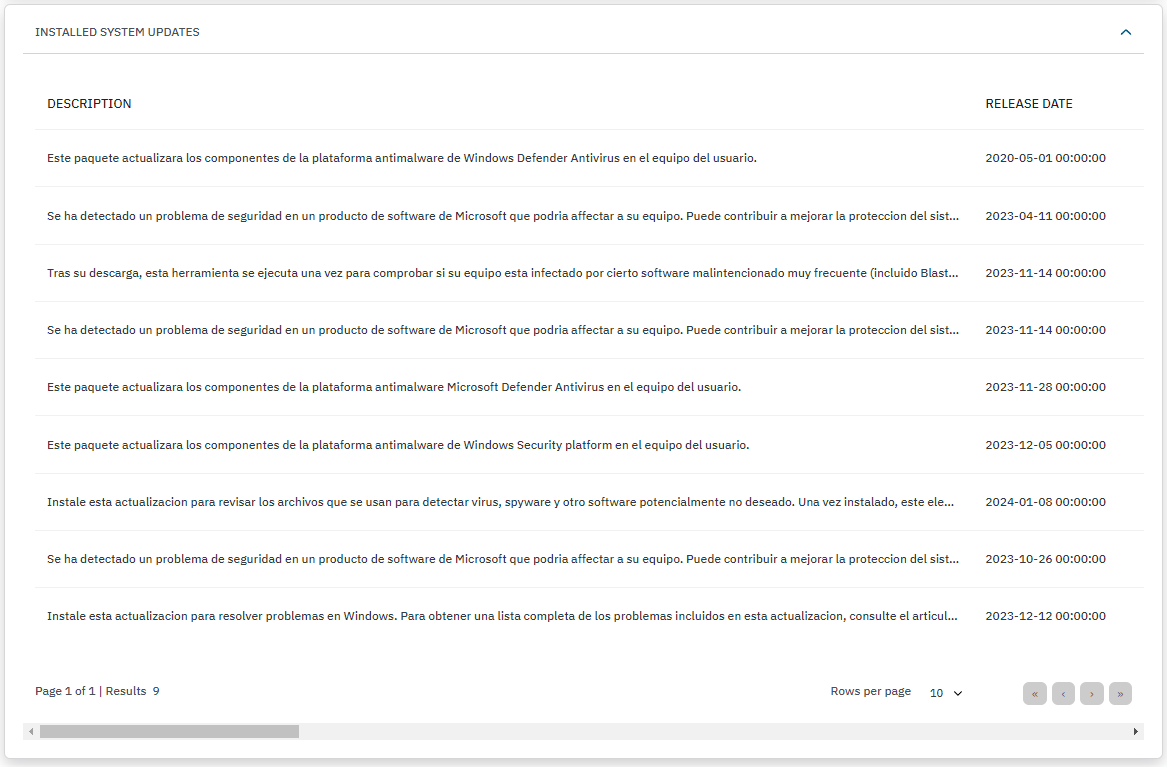
INSTALLED SYSTEM UPDATES: This section will report only Windows operating systems updates. The table displays the update title and description, the release date, its knowledge base article ID, and the Microsoft Security Response Center severity rating.
Note
When the Windows Update is disabled by the user, SYSTEM_UPDATES_ACTIVE will return false, while SYSTEM_UPDATED and PENDING_SYSTEM_UPDATES fields will be set as “”null” making it impossible to accurately determine the machine’s update status.
Regarding System Update tags, understand three possible scenarios:
Disabled Updates
Scenario: When System Updates are disabled, the system enters a state where updates are not actively managed or applied.
Tags: The ISS_SYSTEM_UPDATES_DISABLED tag will be added to indicate that System Updates are disabled.
Enabled Updates & Not Updated
Scenario: In cases where System Updates are enabled, but some updates are pending installation or the system is not yet updated.
Tags: The ISS_SYSTEM_UPDATES_ENABLED tag indicates that System Updates are enabled. Additionally, the ISS_WINDOWS_PENDING_UPDATES tag is added, and UIP_KBxx tags are included for each pending update. Note that drivers may be present in the update payload but are usually ignored for tagging purposes.
Enabled Updates & Updated
Scenario: When System Updates are enabled and the system is up-to-date with all available updates.
Tags: The ISS_SYSTEM_UPDATES_ENABLED tag confirms that System Updates are active. Additionally, the ISS_WINDOWS_UPDATED tag is added to indicate that the system has been successfully updated with all available updates.
3.2.3.6.1.2.2. View sessions
The View sessions table displays sessions details. Here you can see the payloads by sessions and the policy evaluation.
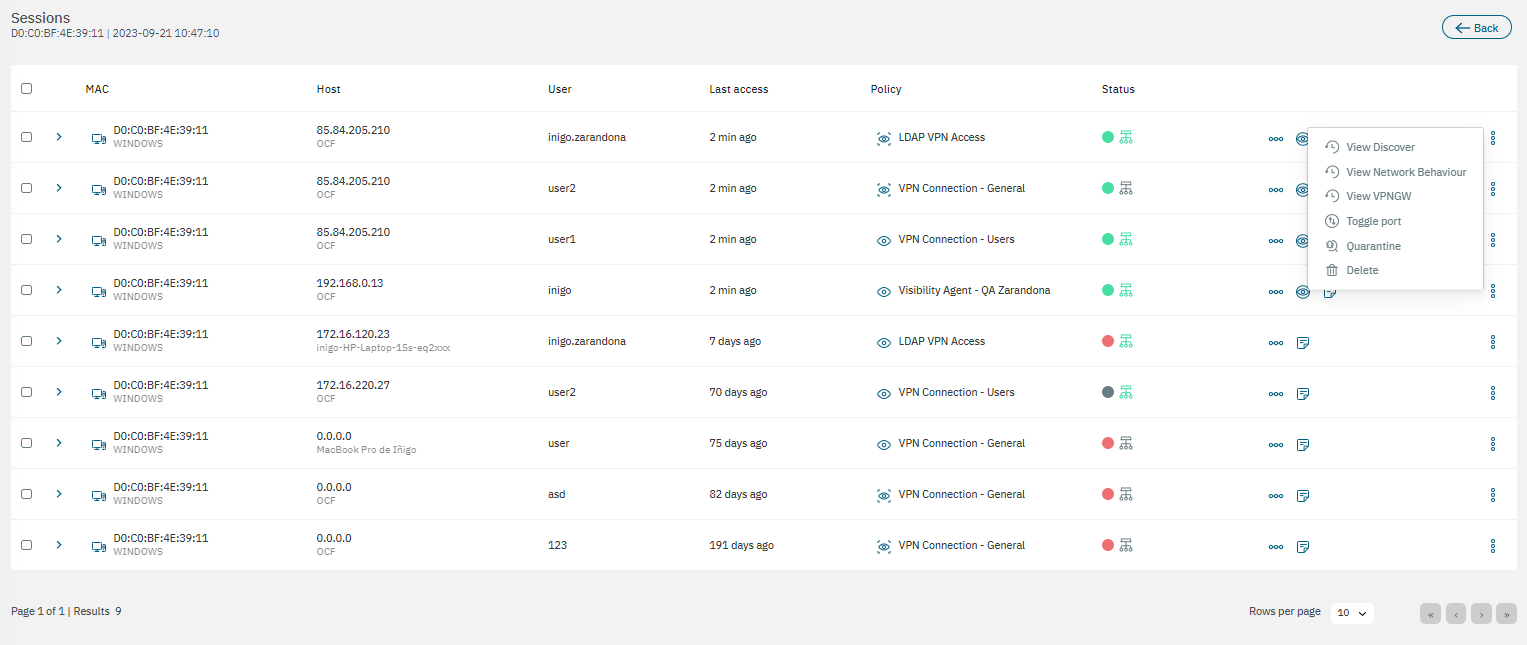
The table displays the MAC address, host, user, last access, policy and status.
At the end of each row, there are icons that allow you to open additional views:
View detail: This view displays details about the user device, network device, session, related sessions, other data, and Tags related to that session.
View policy evaluation: This view displays the params received, params processed and the result of the corresponding policy evaluation.
View payload: This view displays the same fields as in the View data section.
View Discover: It opens the Analytics > Discover dashboard.
View Network Behaviour: It opens the Analytics > Network Behaviour dashboard.
View VPNGW: It opens the Analytics > VPNGW dashboard.
Toggle port: To force a device policy evaluation.
Quarantine: To quarantine any selected user device. It will send the device to an isolated network, usually for security or compliance reasons.
Delete: Button the delete the sessions from the table.
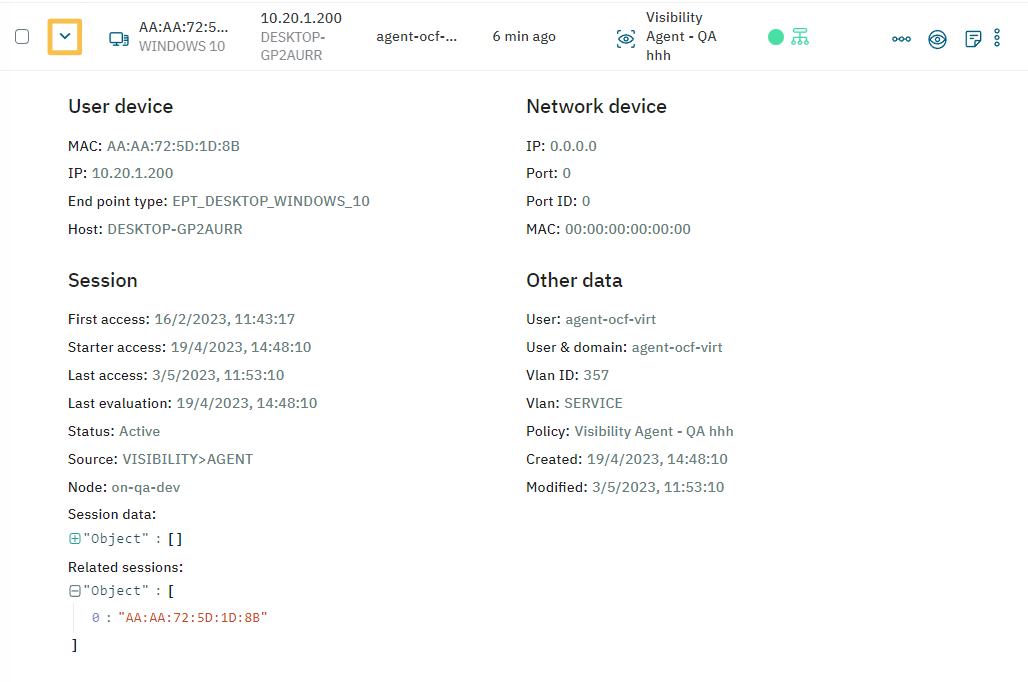
By clicking on the arrow, you can expand the session information and see the user device or network device details, session details and other data like user, VLAN ID, and Policy.
3.2.3.6.1.2.3. View tags simulator
The View tags simulator section allows you to perform a tag simulation.
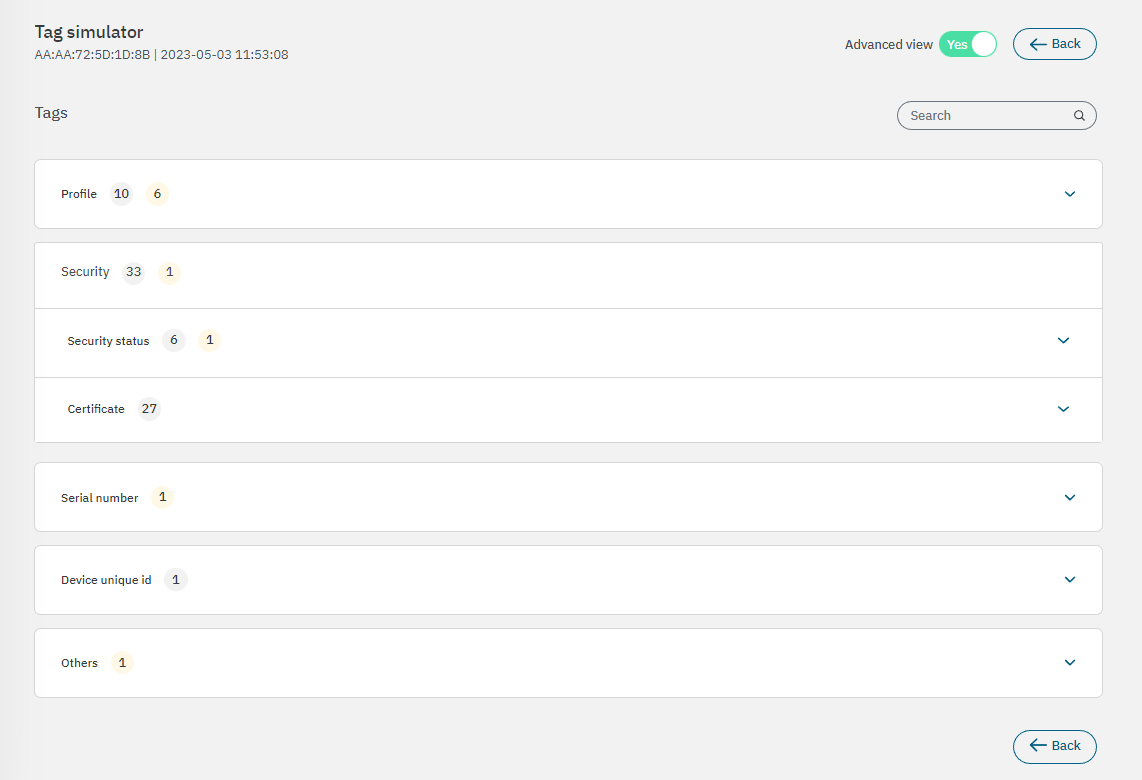
See the Agent Doc for a complete list of tags generated from data collected by the Agent.
3.2.3.6.1.2.4. Download data
By clicking on Download data you can download the payload received.
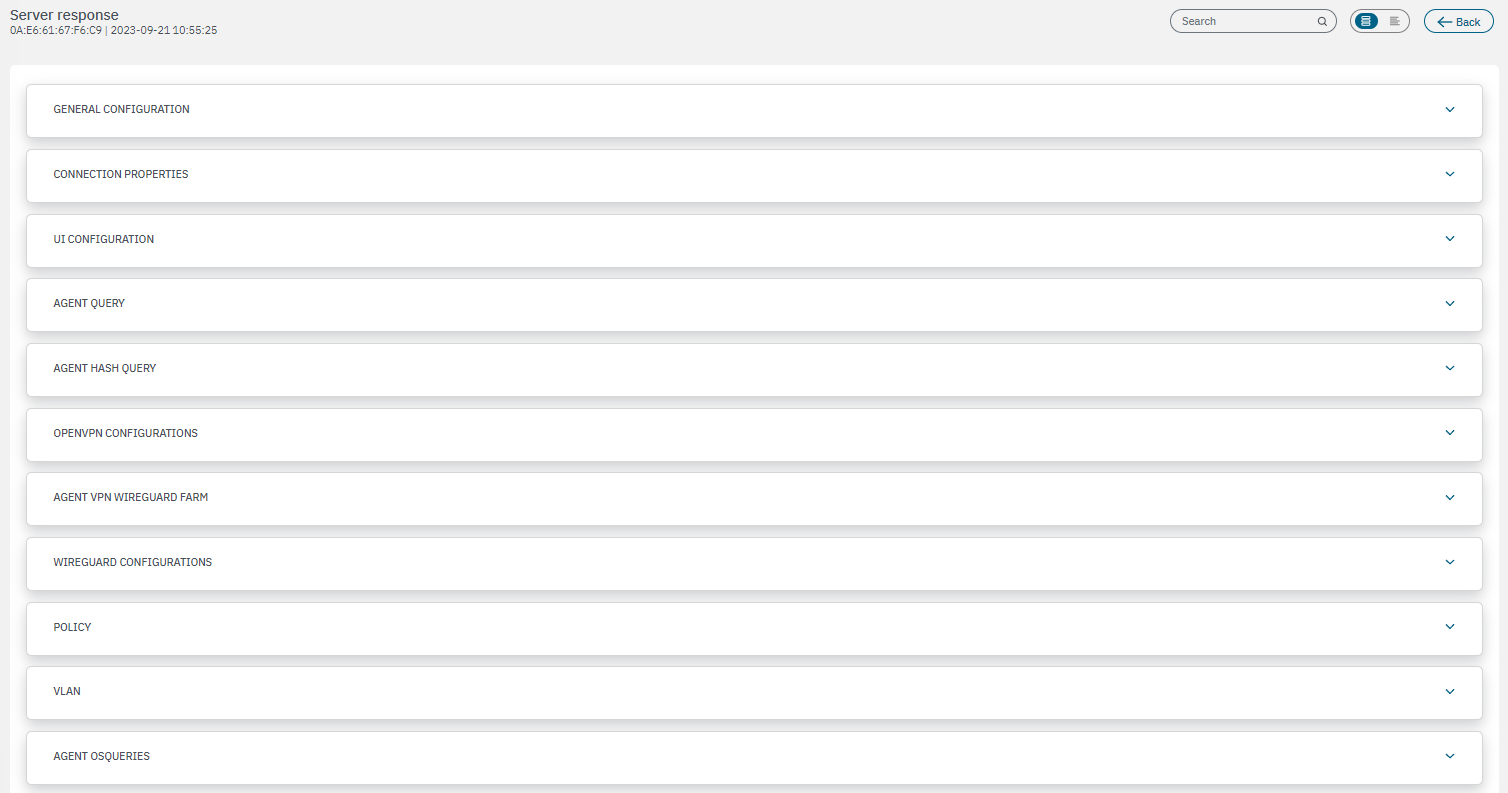
3.2.3.6.1.2.5. View server response
In the View server response section, we can see the Agent server response.
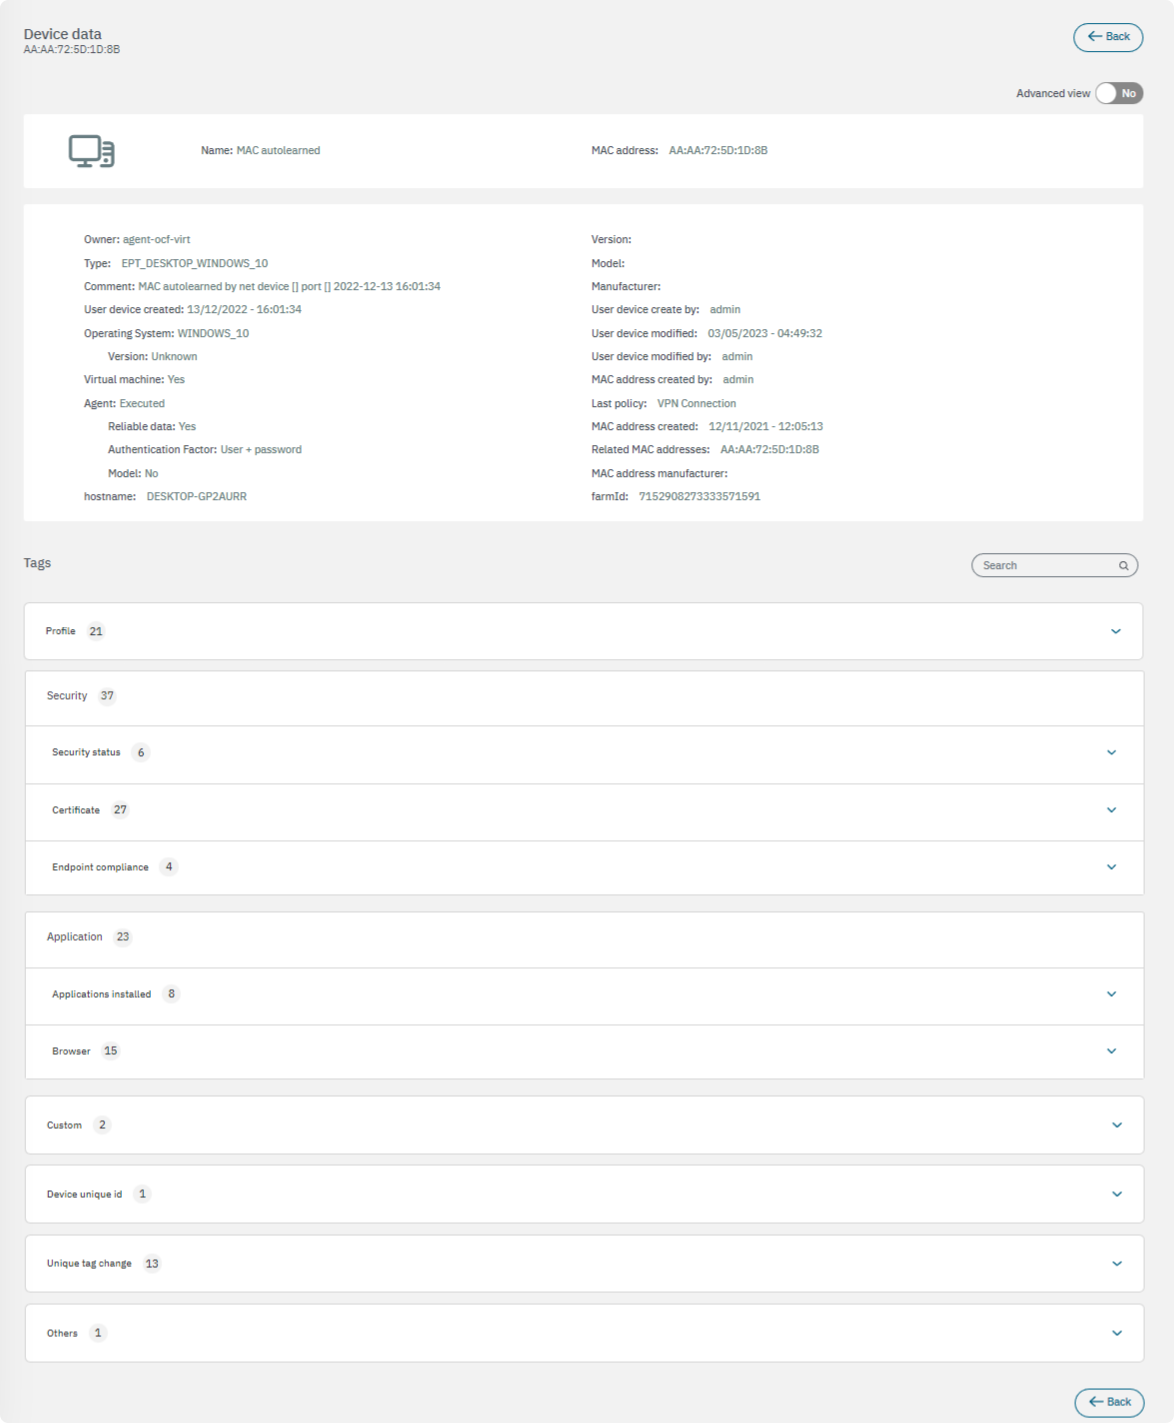
3.2.3.6.1.2.6. View device data
This view displays details about the device data and the Tags related to that device.
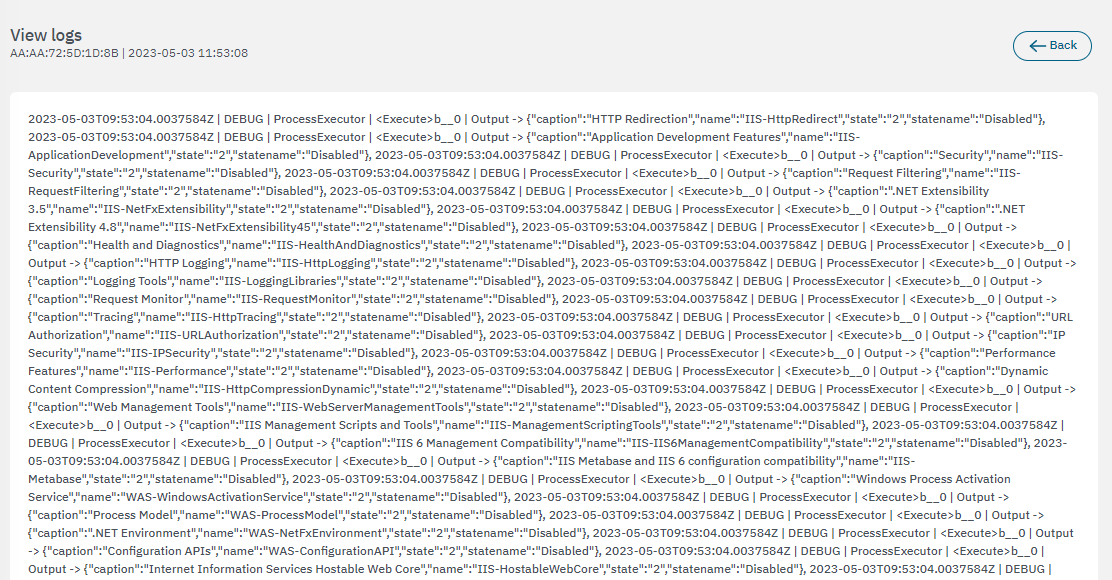
3.2.3.6.1.2.7. View logs
From this view, you can see the Agent logs.
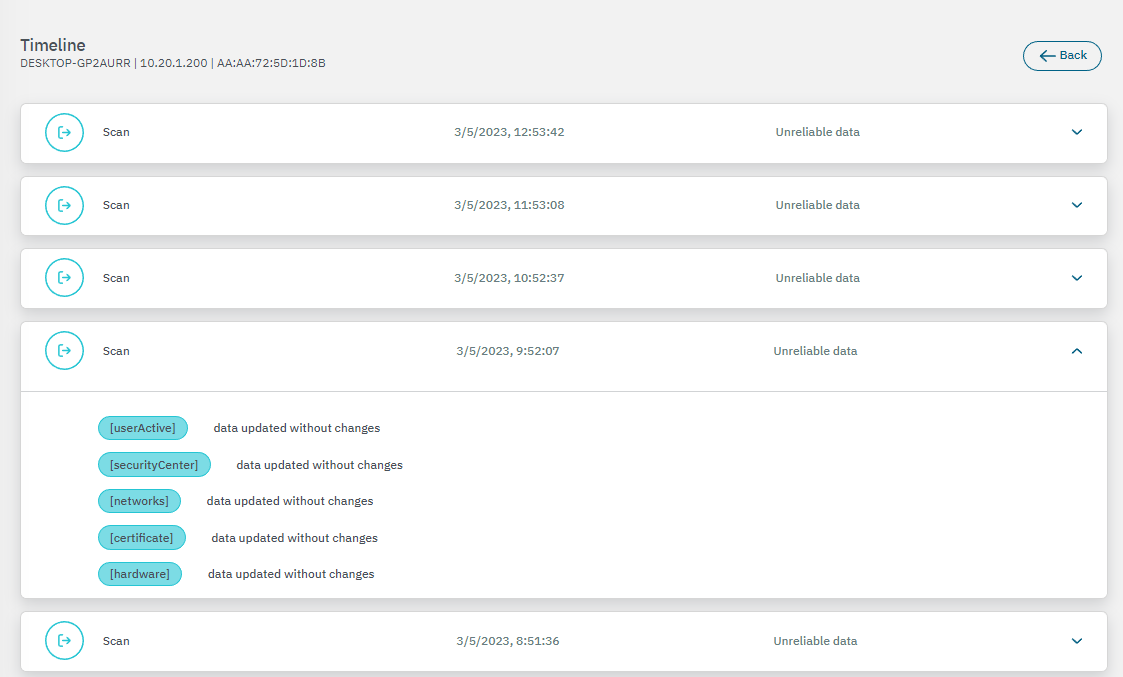
3.2.3.6.1.2.8. Timeline
The Timeline section displays the payloads for that source, sorted from the most recent to the oldest, with details of the different payloads.
By selecting a session from the table, it will display the Action row at the bottom of the window.
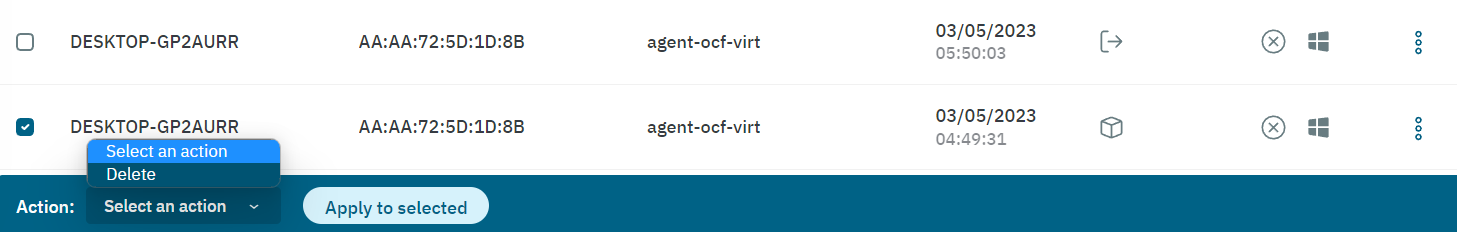
You can also delete multiple entries at once. Select the Delete action for the entries you wish to delete, and click on Apply to selected.