2.11.2. openNAC Dashboards
OpenNAC Dashboards feature different dashboards with data collected from the ON Core.
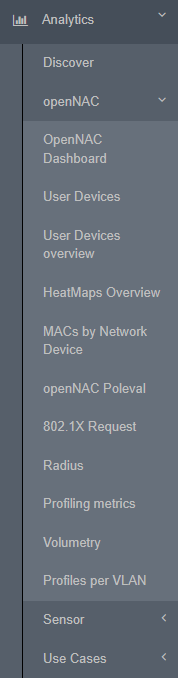
The default OpenNAC Dashboards are the following ones:
OpenNAC Dashboard: Displays a summary of the most important information collected from the ON Core.
User Devices: Displays information about the user devices, also of their source and tags.
User Devices overview: Displays the number of user devices, the operating system tags, and others.
HeatMaps Overview: Displays heatmap visualizations that shows important information and detect common behaviors.
MACs by Network Device: Displays visualizations with a Network Device IP and port filter.
openNAC Poleval: Displays a list of polevals.
802.1X Request: Displays dashboards about 802.1X requests.
Radius: Displays dashboards about RADIUS requests.
Profiling metrics: Allows device profiling improvement through four tags (DBW, DOP, DNS, SHQ).
Volumetry: Displays overall user devices information.