2.11.2.9. Profiling metrics
The Profiling metrics dashboard displays device tags metrics. It allows to improve the device profiling.
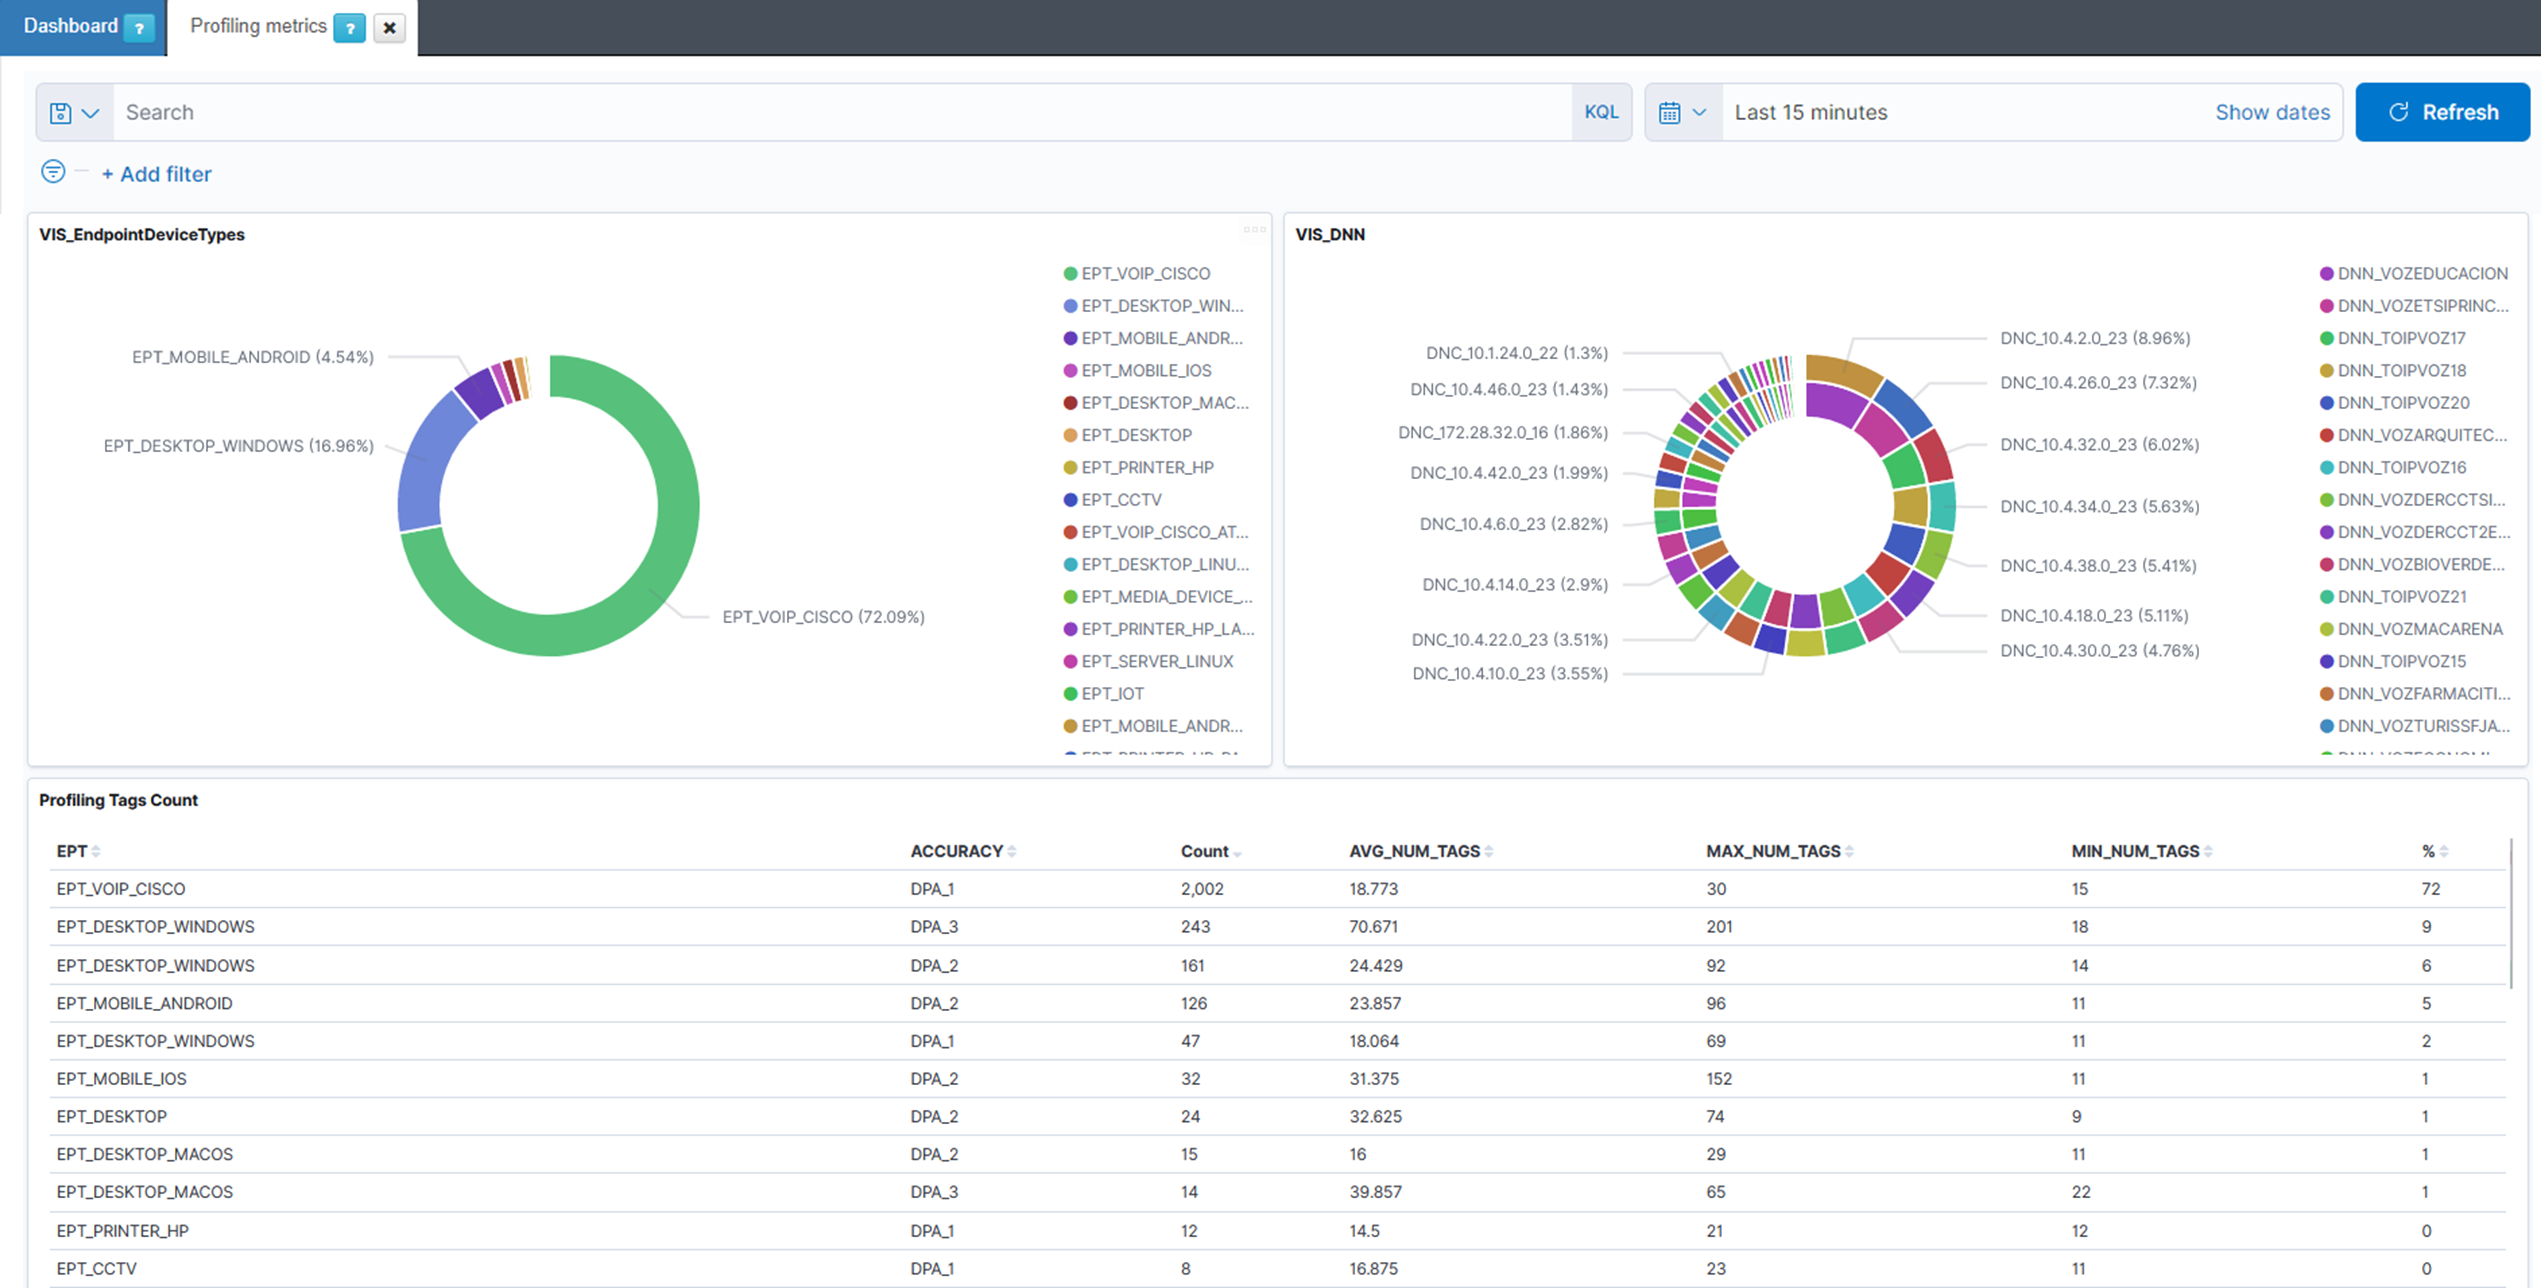
VIS_EndpointDevice_Types: A pie chart that shows the percentage of each EPT.
VIS_DNN: A pie chart that shows each subnet information with the DNN and DNC tags.
Profiling Tags Count: A table that shows information about each EPT: count, percentage, accuracy (TAG DPA), minimum number, average, and a maximum of TAGs.
Profiling Tags EPT-DBW: A table that shows the tag account of DBW (device browser) tags by EPT.
Profiling Tags EPT-DNS: A table that shows the tag account of DNS (DNS queries) tags by EPT.
Profiling Tags EPT-DOP: A table that shows the tag account of DOP (device open port) tags by EPT.
Profiling Tags EPT-SHQ: A table that shows the tag account of SHQ (SSL hostname query) tags by EPT.