2.11.2.10. Volumetry
The Volumetry dashboard displays the information about User Devices.
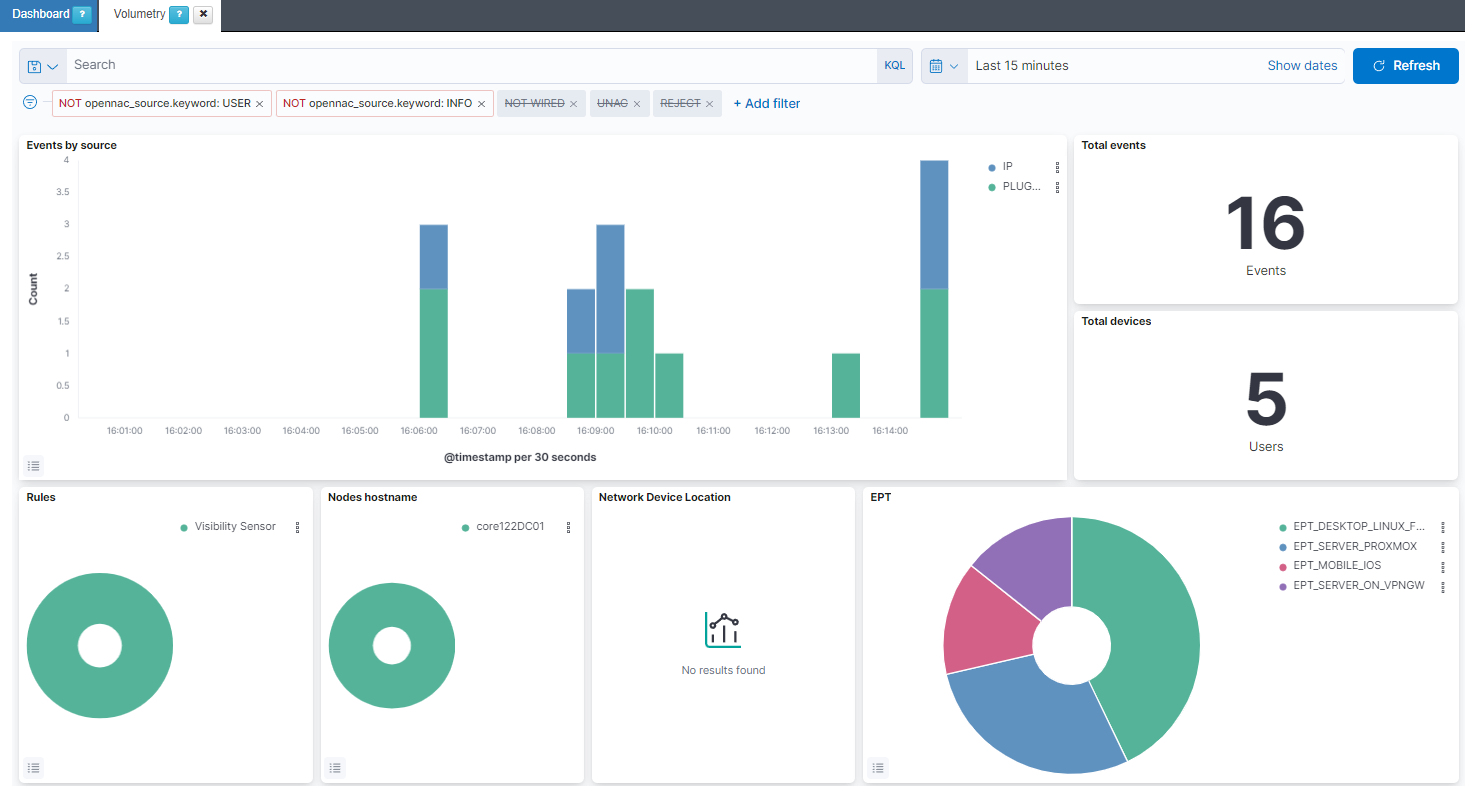
Events by source: The overtime events by source (SNP, 8021XUSER, IP, VPN)
Total events: The total number of opennac events.
Total devices: The total number devices that generate opennac events.
Rules: A pie chart showing the policies of the user devices.
Nodes hostname: A pie chart showing the hostnames of the farm nodes.
Network Device location: A pie chart that shows the UD location based on the location tags.
EPT: A pie chart showing the relation between the EPTs.
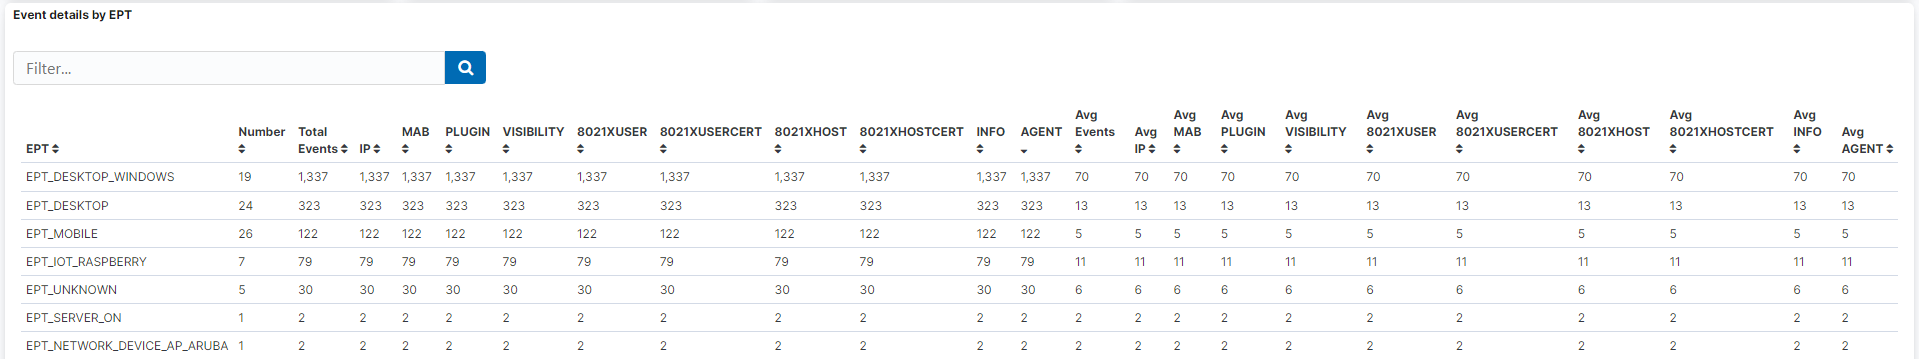
Event details by EPT: A table that shows the details of each event by EPT (number of events, source, etc).
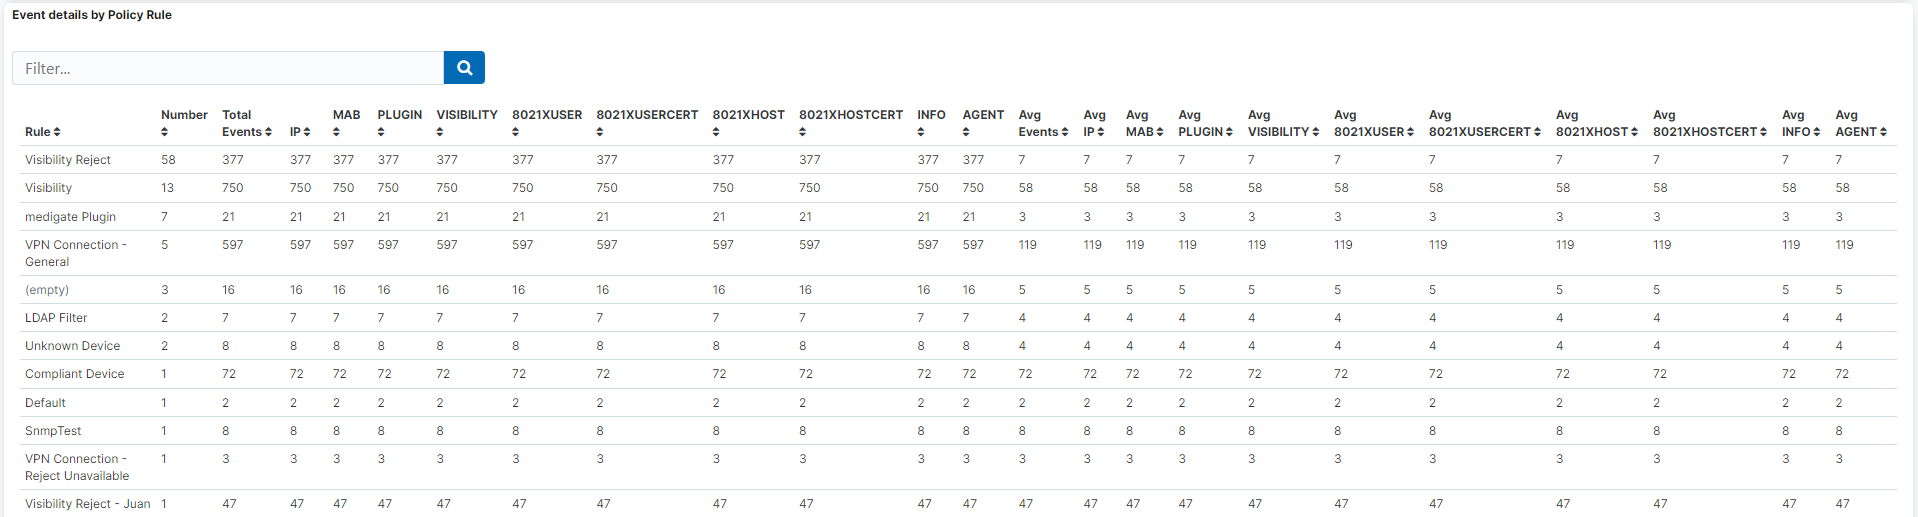
Event details by Policy Rule: A table that shows the details of the events by policy.
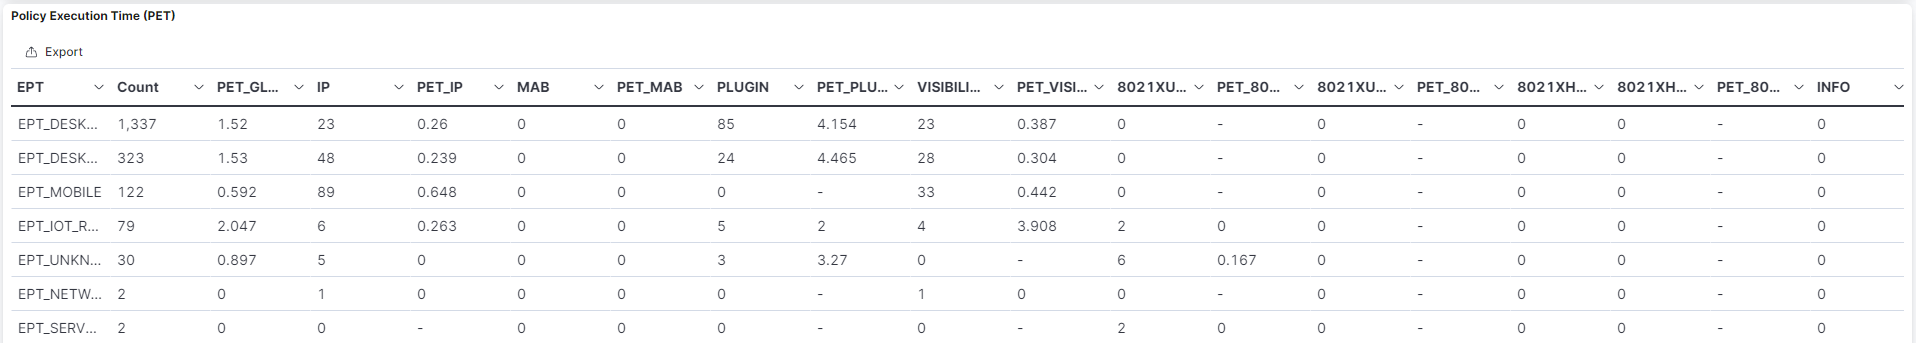
Policy Execution Time (PET): A table that shows the poleval execution time.