2.11.2.1. OpenNAC Dashboard
A summary of the most important information collected from the ON Core is displayed in the OpenNAC Dashboard. We can see the following events in this window:
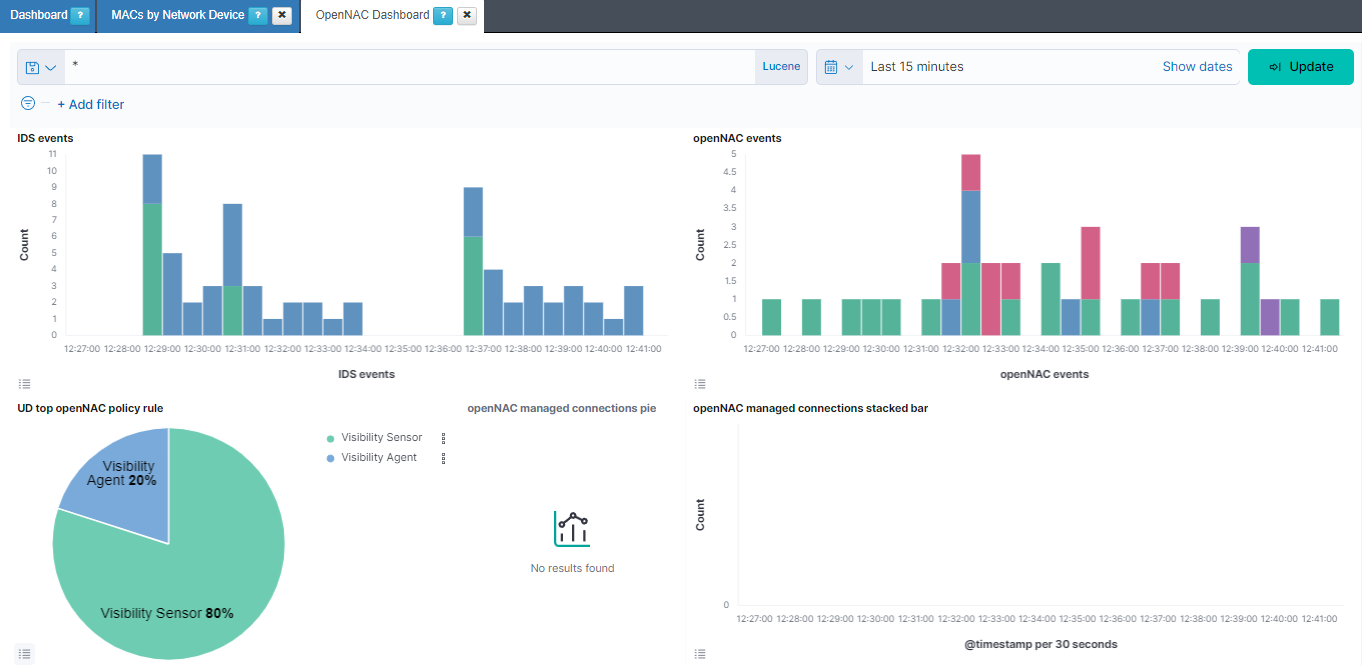
IDS events: Shows over a timeline the total of events of bro separated by the event type. The different types that we can find are: bro-conn_log, bro-dns_log, bro-http_log, bro-files_log, bro-dhcp_log, bro-notice_log, bro-ssl_log, bro-x509_log, bro-kerberos_log, bro-radius_log, bro-ssh_log, bro-snmp_log, bro-sip_log, bro-dpd_log, bro-smtp_log, bro-arp_log, bro-modbus_log, bro-rfb_log, bro-rdp_log, bro-ntlm_log, bro-socks_log, bro-tunnel_log, bro-rpc_log, bro-pe_log, bro-smb_files_log, bro-smb_mapping_log, bro-s7comm_log, bro-profinet_log, bro-bacnet_log, bro-enip_log, bro-dnp3_log and bro-syslog_log.
openNAC events: Shows over a timeline the total of events of opennac separated by the opennac source. Some of the opennac sources we can find are: plugin, ip, user, reeval, agent, mab, 8021xuser, info, and macdiscover.
UD top openNAC policy rule: Represents the percentage of the different policy rules events.
openNAC managed connections pie: Represents the percentage of the bro connections managed, coming from the sensor, and not managed.
openNAC managed connections stacked bar: Shows over a timeline the total of events of bro connections separated by if the connection is managed, from the sensor, or not managed.
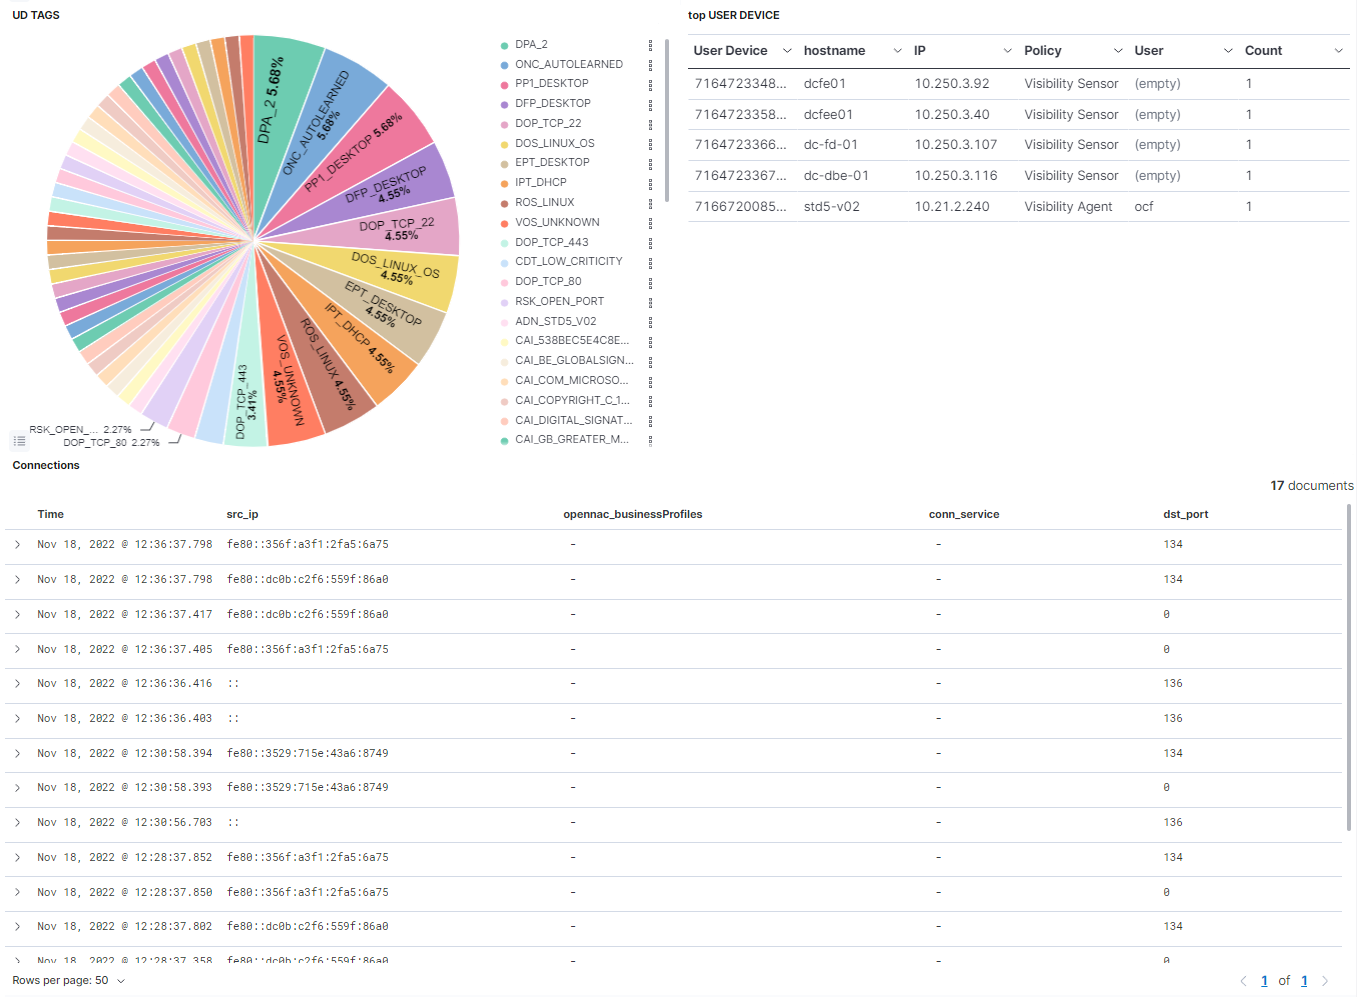
UD TAGS: Represents the percentage of the different UD TAGS.
top USER DEVICE: Shows a table with the top 10 user devices. In this table the User device id is represented, as well as the hostname, the IP, the policy rule, the user and the count this event has been repeated.
Connections: Shows a table with the most recent connections. In this table, the timestamp is represented, as well as the source IP, the opennac business profile, the connection service and the destination port.