4.1.4. Configuration
To follow this configuration process, it is necessary that all nodes have been previously deployed for module operation (ON Core, ON Analytics and optionally ON Sensor and ON Agent) following the official node deployment guide.
This section will only explore the necessary configuration to perform the deployment of this module on the different nodes. The operation of this module is explained on Visibility -> Operation.
Given that the Visibility module uses some network device features from different vendors, it is necessary to have the proper knowledge on each vendor to configure it properly.
In this section, we will explain the examples of the configuration of specific models. It is up to the users to extrapolate these configurations to the network devices that are available.
The main purpose of this section is:
Perform the correct configuration of all necessary nodes for the Visibility module.
Configure the different services used by the system.
Understand through examples, the necessary configuration for network devices. This configuration must be extrapolated to existing network devices in each environment.
4.1.4.1. ON Analytics Configuration
After deploying the ON Analytics node and doing the initial configuration, it is necessary to do the following configurations for the proper functioning of the Visibility module.
4.1.4.1.1. API Key configuration
To allow ON Analytics (starting from ON Sensor information) to send information to ON Core, it is necessary to have an API key to send calls to the ON Core API.
We must generate this key on the ON Core Web Administration Portal and add it to the ON Analytics machine.
In ON Core:
Click on Add new and fill the Enable API key only for source IP field with the ON Analytics IP.
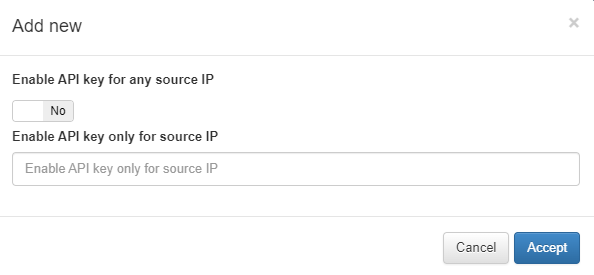
This generated API key will be the one used by ON Analytics.
In On Analytics:
Modify the /etc/default/opennac file.
The OPENNAC_API_KEY field with the generated API Key.
The field OPENNAC_NETDEV_IP with the Aggregator IP address. If you do not have a separated Aggregator node, this IP should be the ON Analytics since this one is also working in Aggregator mode.
4.1.4.1.2. (Optional) Configure NetFlow, SFlow or/and IPFix analysis
Since release 7544 of version 1.2.0-5, system allows analysis and device Discovery through NetFlow (Cisco), SFlow or IPFix optional.
Note
To enable this functionality, the minimum hardware recommended is (64 GB RAM, 16 cores, 2NIC’s) in ON Analytics.
4.1.4.1.2.1. Second interface configuration
SSH or access to the ON Analytics CLI and log in using root user (default access: root / opennac).
Configure the second interface where flows will be collected. This interface can be eth1 and it is necessary to configure a local IP Address.
To configure such an IP Address, execute the graphic Network Manager:
nmtui
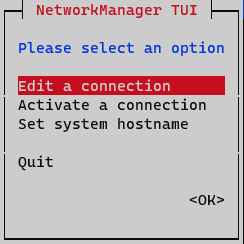
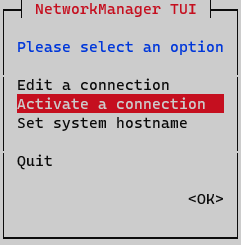
On the initial window, select Edit a connection
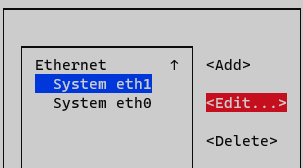
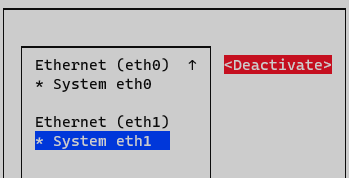
Select the interface and press Edit
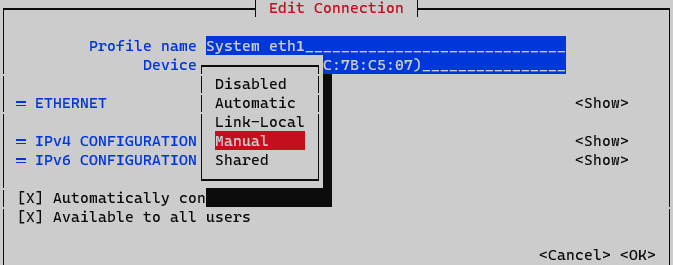
On IPv4 Configuration select Manual. Display IPv4 configuration selecting option <Show>
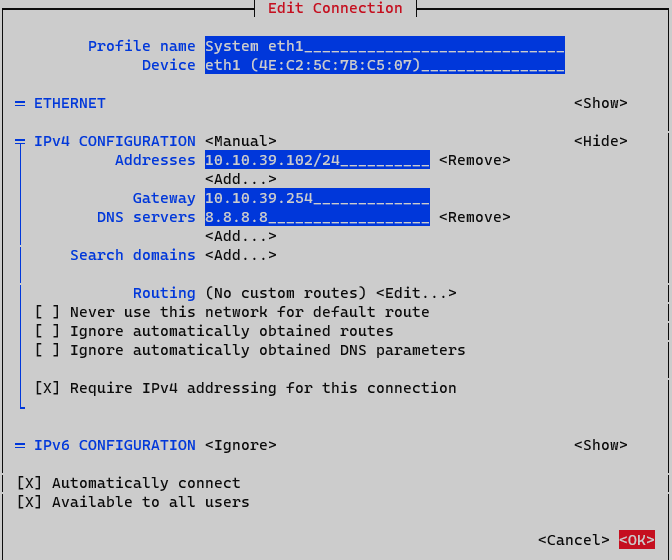
Addresses: Add node IP address with netmask (<IP>/<MASK>)
Gateway: Add default gateway
DNS Servers: Add a DNS server (ex. Google)
Set option Require IPv4 addressing for this connection. Finalize by clicking <OK> at the bottom.
At this point, you need to activate and deactivate the interface to apply changes. On Network Manager menu, select option Activate a connection.
Deactivate and active interface and go back to initial menu.
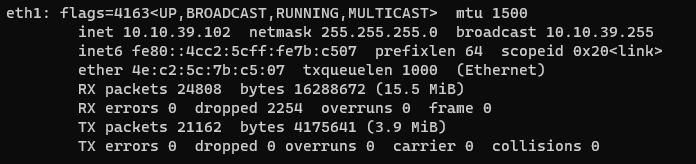
Interface is now configured and can be verified by typing the following command in CLI “ifconfig” o “ip a”
ifconfig
4.1.4.1.2.2. NetFlow, SFlow and/or IPFix analysis configuration
First Logstash JVM memory size must be changed. It is necessary to have at least 4GB for logstash, 6GB would be the best size. Edit the file /etc/logstash/jvm.options and change the Xms<size>g and the Xmx<size>g:
-Xms4g
-Xmx4g
The next step is to enable the Flow pipeline. Edit /etc/logstash/pipelines.yml and uncomment the following code lines:
#- pipeline.id: elastiflow
#  path.config: "/etc/logstash/elastiflow/conf.d/*.conf"
Add the following rules to iptables /etc/sysconfig/iptables (SFlow UDP port 6343, IPFix UDP port 4739 and NetFlow UDP port 2055):
-A INPUT -p udp --dport 6343 -j ACCEPT
-A INPUT -p udp --dport 4739 -j ACCEPT
-A INPUT -p udp --dport 2055 -j ACCEPT
This rules can be added after rule “-A INPUT -i lo -j ACCEPT”. Once the new rules are added, restart iptables service to apply changes:
systemctl restart iptables
Verify that JVM size for Elasticsearch is configured correctly and defined as 50% of system RAM capacity. To check total system RAM run:
dmidecode -t 16
Edit the file /etc/elasticsearch/jvm.options and change the Xms<size>g and the Xmx<size>g:
-Xms32g
-Xmx32g
When modifying Elasticsearch JVM properties, restart the service:
systemctl restart elasticsearch
Restart service Logstash (restarting can take several minutes as there are many objects to load):
systemctl restart logstash
Do the additional configuration on the network device (explained below in this same page), by activating NetFlow (Cisco), SFlow, or IPFix features to send packets to the ON Analytics server.
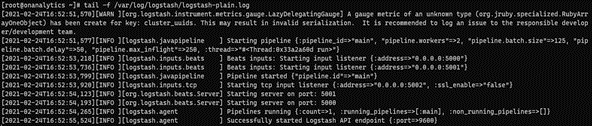
4.1.4.1.2.3. Logstash Pipeline validation
Verify that logstash service is running pipeline filters correctly issuing the following command:
tail -f /var/log/logstash/logstash-plain.log
This command will show the Logstash pipeline status:
4.1.4.2. ON Sensor Configuration
ON Sensor intends to decode protocols and offer advanced visibility of the network. This information and events are sent to ON Analytics or ON Aggregator according to the architecture designed.
Processes or main services on which the system is based are:
DHCP Helper Reader to discover devices using DHCP packets
PF_RING to capture network packets
Zeek (BRO) to analyze traffic
Filebeat to send data to a host (ON Analytics or ON Aggregator)
4.1.4.2.1. DHCP Helper Reader configuration
DHCP Helper Reader service can be executed on ON Core acting as a DHCP Relay, receiving, and redirecting DHCP requests. In case this method is not possible due to environmental limitations, DHCP Helper Reader services can be configured on the ON Sensor server. The main difference between configuring DHCP Helper Reader on ON Core or on ON Sensor is that ON Sensor will act in a passive role and will process requests captured over the span port.
It is important to know that by default, DHCP Helper Reader runs on the eth1 interface, in case the SPAN interface changes, file /etc/sysconfig/dhcp-helper-reader needs to be modified as well.
Depending on the server where dhcp-helper-reader is running, it is necessary to configure some parameters by commenting or uncommenting as explained on the /etc/sysconfig/dhcp-helper-reader file. Note that the last commented lines are mostly informative and you must read them carefully to see if you must uncomment them or edit other files:
# Command line options here
# If running on a core, the default option configured will listen port 67 on all interfaces
# and connect to redis on master node and gearmand on localhost.
# "-s onprincipal"
OPTIONS="-s onprincipal"

# If running on a sensor, configure as below:
#OPTIONS="-r <interfaz> -s onprincipal -q <ip_oncore>"

##############################################
# If you need to run with DHCPD service:
#To redirect DHCP messages from IP Helper to "dhcp-helper-reader" process:
#
#* Add iptables redirect:
#iptables -A PREROUTING -p udp -m udp --dport 67 -j REDIRECT --to-ports 1067
#
#* Uncomment below:
#OPTIONS="-l 1067"
#
#* Restart "dhcp-helper-reader" process:
#service dhcp-helper-reader restart
###############################################
The parameters are:
-s : redis server where read and write DHCP information is processed. By default, this is configured on ON Core with onprincipal role.
If it is running in ON Sensor:
-r : span port interface where DHCP packets will be received. It is possible to configure several interfaces.
-q : queue server where DHCP requests are redirected. By default, this is configured on ON Core with oncore role.
Service dhcp-helper-reader needs to be restarted to apply changes:
systemctl restart dhcp-helper-reader
4.1.4.2.2. Zeek configuration
First, connect to ON Sensor via SSH.
Zeek service has some plugins that allow improve visibility on the network. The most common plugins used and recommended are:
Vlan-logging: Allows to identify analyzed traffic VLAN on On Sensor.
** Arp traffic:** Allows to analyze ARP packets, to use it on discovering new devices.
To enable these plugins, edit the /opt/zeek/share/zeek/site/local.zeek file removing all “#” for each plugin:
# Uncomment the following line to enable logging of connection VLANs. Enabling
# this adds two VLAN fields to the conn.log file.
#@load policy/protocols/conn/vlan-logging

# Load policy for ARP inspector
#@load scripts/arp_main
Restart Zeek service to apply changes:
systemctl restart zeek
4.1.4.3. Network Device Configuration
According to the discovery method decided, configuration on network devices can be needed, this configuration will apply mainly on switches.
Configuration can include several elements or protocols depending on how the Visibility module is deployed. This can include Flows (NetFlow, SFlow), SPAN ports (SPAN, RSPAN, or ERSPAN), or SNMP Traps among others.
As an example, here are some simple configurations based on a Cisco Catalyst running IOS:
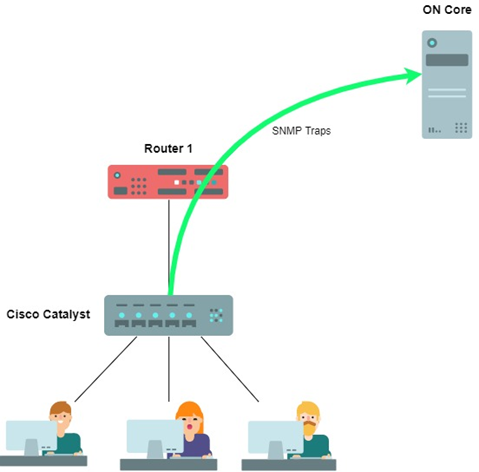
4.1.4.3.1. SNMP Traps configuration
In this section we present a basic SNMP configuration for a Cisco Catalyst Switch. Configurations may change depending on model and version.
We need to configure the SNMP iptables:
vi /etc/sysconfig/iptables
To enable the SNMP trap ports it is necessary to open the UDP ports 161 and 162:
-A INPUT -p udp -m state --state NEW -m udp --dport 161 -j ACCEPT
-A INPUT -p udp -m state --state NEW -m udp --dport 162 -j ACCEPT
First, define a host where SNMP Traps will be sent and a community. To accomplish this, type the following command (configure terminal):
snmp-server host <Host_IP> <community_string>
In this case <Host_IP> is IP address for ON Core service and <community_string> as “public”, for example.
To enable SNMP Traps, type the following command (configure terminal):
snmp-server enable traps <SNMP_Trap_type>
Note
If a specific trap is not defined, all SNMP Traps will enable.
Not all SNMP Traps collect relevant information for Discovery. Some SNMP Traps that collect visibility information are the mac-notification events. This could be:
mac-notification [change | move | threshold]
It is necessary to add to ON Core the following configuration about SNMP communities or users:
vi /etc/snmp/snmptrapd.conf
SNMP v2
On the authCommunity line, it is necessary to add all the RO community defined on the network device.
authCommunity log,execute,net public
Note
We can add multiple communities replying the line multiple times.
SNMP v3
We have to add the follwing configuration:
authUser log,execute,net <snmp-v3-user> auth
createUser -e <engfineID> <snmp-v3-user> <authentication-protocol> <authentication-password> <privacy-protocol> <privacy-password>
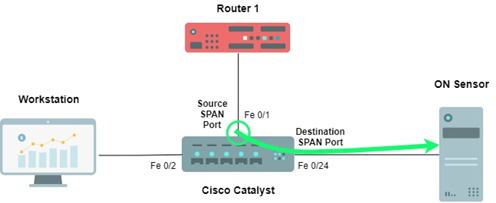
4.1.4.3.2. Span Port configuration
In this section we show a basic Span Port configuration for a Cisco Catalyst switch. Configuration may change depending on the model and version.
For this example, where SPAN port is configured on interface Fe0/1 (source) and mirrored to interface Fe 0/24 (destination) where On Sensor will be connected sniffing traffic
SSH to the switch and access to configuration mode (configure terminal) to define the Span Port interfaces.
First define the source SPAN Port, where the target traffic interface to mirror is:
monitor session 1 source interface fastethernet 0/1
Finally define the destination SPAN Port, where the mirror interface is and ON Sensor is connected:
monitor session 1 destination interface fastethernet 0/24
To show the SPAN Port configuration, the following commands can be used:
show monitor session 1
and
show monitor session 1 detail
4.1.4.3.3. Netflow configuration
In this section, we take a look at a basic NetFlow configuration for a Cisco Catalyst switch. Configuration may change depending on the model and version.
Note
NetFlow is a Cisco property protocol. Therefore, it only exists on Cisco devices, other vendors can use other flows such as SFlow or IPFix.
First configure NetFlow Export, Where and How flows are being sent:
ip flow-export destination <Collector_Host_IP> 2055
ip flow-export source <interface>
ip flow-export version 9
ip flow-cache timeout active 1
ip flow-cache timeout inactive 15
snmp-server ifindex persist
For this case <Collector_Host_IP> is IP Address for ON Analytics server and <interface> is where switch is sending all flows, in this case is interface Fa 0/22.
Enable NetFlow in each Layer 3 interface to monitor:
interface <interface>
ip flow ingress -> Monitor incoming flows
ip flow egress -> Monitor outgoing flows
Note
On previous IOS versions 12.0(22)S or 12.2(15)T the equivalent command for “ip flow ingress” is “ip route-cache Flow”
To validate NetFlow configuration issue the following commands:
show ip cache flow
show ip flow export
show ip flow interface
show ip flow export template