4.1.5. Administration
In the administration module, we will detail the steps to follow to configure the system and make it ready to operate its Visibility functionality.
Note
To carry out the operation of the Visibility module, it is essential to have correctly deployed the necessary components and their correct configuration.
The main objectives of this section are:
Obtain a clear vision of how the Visibility module works and how we obtain new information through the different methods.
Creation of policies that outline the type of device discovered.
Configure the different features and functionalities that can provide us with information regarding network devices.
The Visibility module allows you to discover and profile all devices connected to the network with minimal impact so you can add additional layers of visibility and control to adjust security as needed. Visibility is implemented on all devices through all access layers: cable, Wi-Fi, and VPN.
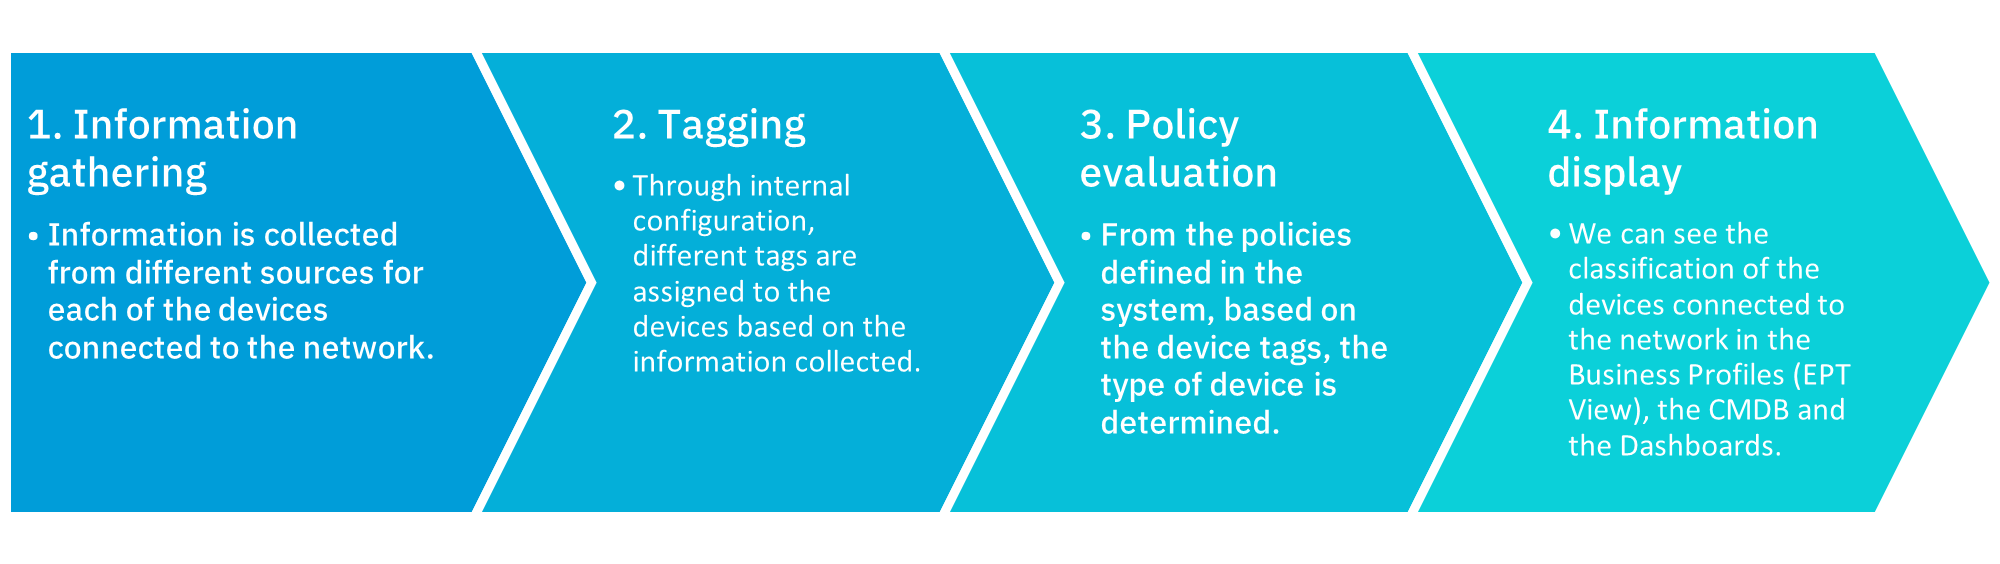
The Visibility process is divided into two phases. The first phase (Discovery) focuses on discovering those devices that connect to the network, collecting as much information as possible depending on the modes that are implemented.
Once a new asset has been detected and its information has been obtained, we move on to the next phase.
In this phase (Profiling), the system will decide what type of device it is based on the information and characteristics that have been obtained in the first phase. With profiling, TAGS will be added to devices. These TAGS represent characteristics of these assets such as a vendor or a MAC Vendor, operating system, device type, etc.
TAGS can be automatically assigned by the system using various mechanisms, or they can also be manually assigned by the administrator through business logic, such as applying “GDPR” labels to devices with GDPR data or mapping with any other logic, as risk levels; “Risk level 1”, etc.
4.1.5.1. Discovery
The 3 main modes of Visibility explained in the Introduction (Network Device, Sensors, and Agents) will be detailed in this section. It is necessary to understand how these visibility modes process the information collected through system logic to better manage growth in network assets.
4.1.5.1.1. Network Device Method
With this Visibility method, it is possible to obtain a real-time inventory of all the assets connected to the network. All communication with network assets takes place regardless of the access layer and how the asset was connected. The visibility and categorization of corporate and non-corporate assets provide us with critical information about the state of the network. This method is implemented at layers 2 through 4.
All these assets are discovered in passive and active modes, which allows us a deep and non-intrusive discovery of the assets. With this implementation it is possible to identify when and where the asset is connected in real time as well as keeping a history for each device, type of device (Laptop, printer, VoIP phone, tablet, mobile phone, IOT, SmartTVs, etc.) and information about its features.
4.1.5.1.1.1. Mechanisms
The Network Device visibility method can use the following methods to collect network information to build the CMDB database:
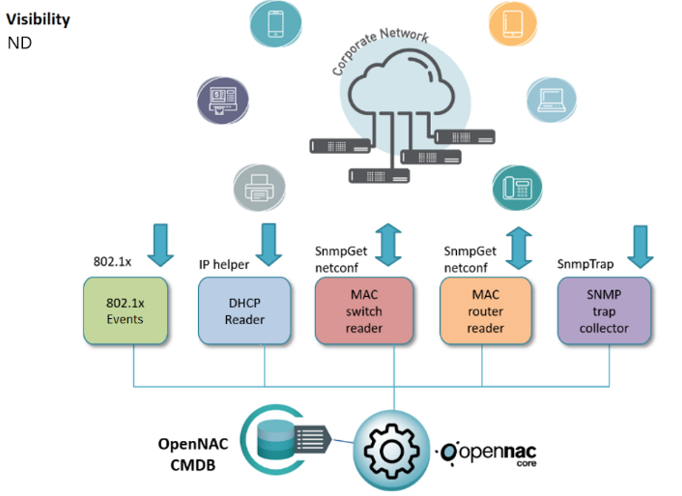
802.1x events: Depending on the capabilities of the network, it is possible to collect information from 802.1x accounting events collected from users and devices on the network. This is part of the AAA capabilities provided by network devices that support the 802.1x standard.
DHCP Reader: Through IP Helper, the system collects information on the DHCP requests generated on the network. Reading and consuming this information provides us with data on existing assets on the network.
MAC tables of switches and routers: For assets where static IPs are used, this can be a useful method to identify IP information and its MAC address. This method connects to network assets to extract MAC tables and stores the information in the ON Core CMDB.
SNMP Traps Events: “snmp-traps mac learn” reveals when and where a device connects by identifying its MAC address.
4.1.5.1.1.2. Information collected
Using the Network Device method to perform network visibility, we will be able to collect the following information:
Time: When was the last time the device was connected/disconnected.
IP Address: IP address assigned to the connected device.
MAC Address: MAC address of the device.
Device Name: The device name can be collected using DHCP Reader information.
IP address of the network device: IP address of the network devices where the device is connected.
MAC address of the network device: MAC address of the network devices where the device is connected.
Physical Ports: Network device interface where the device was connected and discovered.
Device type: Through the profiling rules and its discovery mechanisms, the system can identify the type of device.
MAC Vendor: Vendor assigned to the physical address.
Open Ports and Banners: The open ports and banners of the device.
TAGS: With plugins such as Discovery and profiling rules it is possible to identify open ports in the asset and its type, the system uses TAGS to manage all this information in a flexible way. TAGs can also be added through the Networks configuration. We can also define networks and assign default TAGs to the devices that are part of this network. This can be very useful to add information about the location of these devices.
The process of obtaining information by SNMP Traps happens as follows:
SNMP Trap is generated by a network device, SNMP Traps are generated, for example, by a MAC change on a specific port.
The SNMP Trap is sent to ON Core using the UDP protocol and ports 161 and 162.
The ON Core device through the snmpd daemon listens to the SNMP Trap.
The Gearmand service manages the SNMP information between the location and the ON Core device.
Information about connected devices is sent to Analytics for filtering and storage.
4.1.5.1.1.3. Requirements
You need the following requirements to use the Network Device method:
ON Core: Deployed and configured.
ON Analytics: Deployed and configured.
Switch: Configured with the necessary methods (802.1x, Flows and/or SNMP Traps) pointing to the system so that it can collect information.
Routers: In layer 3 routing network devices (normally acting as default GW) the IP Helper or DHCP Relay can be configured.
4.1.5.1.2. Sensor Method
This method allows real-time viewing of your network events, visibility is obtained through a passive service that inspects all traffic in depth, and displays network activity at a high level for comprehensive proposals. Included are HTTP(S) sessions (web traffic) with the requested URL, DNS request and responses (internal and external requests), SMTP sessions (email traffic). This method is implemented at layers 2 through 7.
The implementation of the Visibility module using the Sensor method involves 3 devices: ON Sensor and ON Analytics for the analysis and storage of information and ON Core to access the dashboards that are generated from the information collected.
Each device has its own specific services. In the case at hand, the sensor collects network traffic using a port in port SPAN and analyzes it using the Zeek service (BRO-IDS), the information collected is sent to ON Analytics for storage using the Filebeat service.
More than one sensor can be deployed in an installation depending on the needs and architecture of each of the infrastructures.
4.1.5.1.2.1. Mechanisms
The sensor listens for network traffic through the Port Span configured on the network devices and all the information that passes through these devices, this sensor collects many protocols in the application layer, including DNS, FTP, HTTP, IRC, SMTP, SSH, SSL.
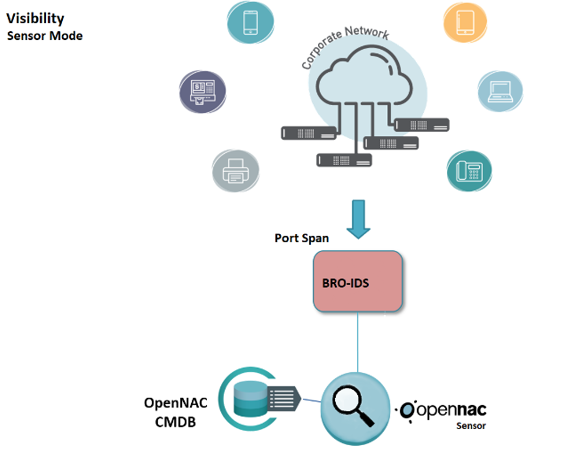
Port Span (Deep Packet Inspection): This is a mechanism to monitor network traffic. This functionality is limited by the functionalities available in network electronics. This port must be configured on the switch where we want to collect traffic. It works by sending a copy of each packet that passes through another port or ports to a single port. This can be configured with 3 different methods:
SPAN (Switched Port Analyzer): allows you to capture all the input and output traffic of one or more ports on a switch and then send it to another port where the capture device (ON Sensor) will be connected to that same switch.
RSPAN (Remote SPAN): allows you to capture all the incoming and outgoing traffic of a switch port and send it to a VLAN where the traffic of different switches with RSPAN can be accumulated. The Sensor listens on the port where the traffic of said VLAN is being mirrored. By encapsulating the packets in a new VLAN we lose the information regarding the original VLAN of the traffic.
ERSPAN (Encapsulated Remote SPAN): allows traffic from one or more source ports or VLANs to be captured and traffic sent through a routed network (Layer 3) to other devices using a GRE (Generic Routing Encapsulation) tunnel.
Zeek (Bro-IDS): Analyzes activity at the application level and by comparison with predefined patterns. Zeek allows us a great capacity for analysis at the protocol level and a great capacity to manage large volumes of traffic.
The process for obtaining events is the following:
An event is generated on a network device that is sent to ON Sensor.
The Zeek service (enabled in ON Sensor) captures and analyzes the events received from the Port Span.
The Filebeat service (enabled in ON Sensor) sends the events to ON Analytics.
The ON Analytics node with the On Aggregator role receives the information from filebeat, filters and normalizes it using Logstash, and finally stores it in the Elasticsearch of the ON Analytics node. The roles of ON Aggregator and ON Analytics can correspond to the same node or several depending on the volume of data with which it is treated.
4.1.5.1.2.2. Information collected
DHCP: IP assignment traffic based on the DHCP protocol.
Tunneled Traffic: Traffic origin/destination of the traffic that is generated in a tunneled way.
SMB: Samba traffic for file sharing.
Kerberos: Traffic generated by the Kerberos authentication protocol.
Radius: Traffic generated by the Radius protocol for the authentication and authorization of network devices.
Ports and services: List of ports and services accessed by the devices
IRC: Traffic based on the Internet Relay Chat communication protocol.
Connection States: Identify the state of a connection between machines.
SSH: ON Sensor extracts information regarding the origin and destination of SSH-type connections.
HTTP/HTTPS: HTTP/HTTPS traffic of the network.
DNS: Through DNS queries we can identify which are the main websites or servers visited.
SSL: The sensor extracts information related to the SSL traffic that is being generated on the network.
SMTP: By listening to this protocol you can view email traffic, analyze spikes and network devices related to those spikes.
FTP: Through this protocol, you can perform actions regarding file transfer policies.
VLANs: The sensor is capable of identifying the traffic categorized by Vlans.
ARP packets: Detection of the ARP traffic that has been generated in the network.
OT: Currently the system is capable of collecting information related to Operational technology-type protocols in industrial environments such as PLC communications.
4.1.5.1.2.3. Requirements
You need the following requirements to use the the Sensor method:
ON Core: Deployed and configured.
ON Analytics: Deployed and configured.
Switch: Configured with Port Span where ON Sensor can capture and extract information from the network.
ON Sensor: Deployed and configured.
4.1.5.1.3. Agent Method
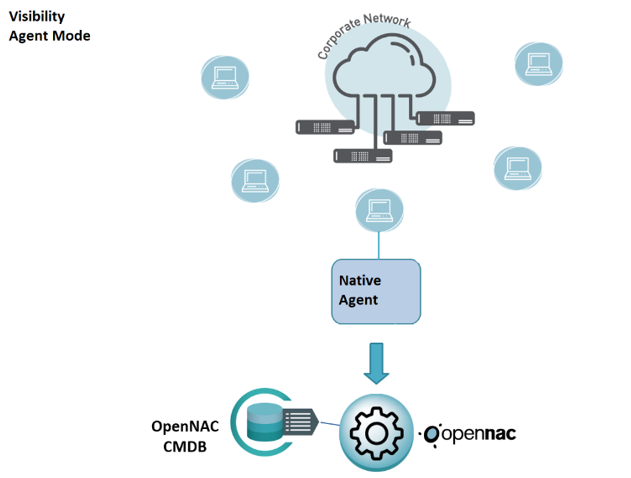
The Agent method is based on installing software (Agent) on user devices, to obtain detailed information about them, including the complete hardware and software inventory. This information can enrich both the Network Device and Sensor modes with granular information for more fine-tuned profiling rules.
This method runs on the OS layer and is currently available for Windows, Linux and MAC OS in installable form.
For more information visit the ON Agent deployment.
4.1.5.1.3.1. Mechanisms
The agent must be available on user devices through the installation of the Agent software. This agent will perform a deep analysis of the device where it is located, both at the software and hardware level.
OSquery: Through queries against the operating system we collect information related to software and hardware, from time to time checks are made to see if any changes have been made to the device, both hardware and software.
Events generated by OS: In some cases, the operating system itself is capable of generating an event and notifying us without the need for manual queries.
Payloads: Through payloads we send the corresponding information to ON Core, such as system information, login/logout events, closing of the agent application, etc.
Powershell scripts: Through programmable scripts in the agent, we can display additional device information.
The process of obtaining information is as follows:
The agent runs on the computer and collects all available information using the mechanisms described above.
This information is sent to ON Core through POST calls to the API through port 443 (by default), this information will be sent from ON Core to ON Analytics for processing and storage.
4.1.5.1.3.2. Information collected
The information that the agent is capable of collecting is detailed below:
Software: Display of all the software installed on the device, as well as the current version of said software.
Hardware: Information related to the hardware installed in the computer, peripherals, networks.
Processes: A list of the processes that are running on the network devices is obtained.
Microsoft Security Center: Information about the computer’s security status based on the Microsoft Security Center settings (Antivirus, Firewalls, Updates, etc.). (Windows)
Certificates: List of certificates installed on the device. (Windows and MacOS).
WIFI connections: List of Wi-Fi connections learned by the device. (Mac OS)
Browser extensions: List of extensions installed in the main browsers.
Session events: Information about user sessions of the operating system.
Active users: Users with an open session in the operating system.
4.1.5.1.3.3. Requirements
You need the following requirements to use the the Agent method:
ON Core: Deployed and configured.
ON Analytics: Deployed and configured.
ON Agent: Agent (installable) deployed on the end-points.
ON Portal: Optionally it may be necessary to have ON Portal (with Captive-Portal) to receive payloads from agents. This is important in environments where you are exposed to the internet or in DMZ areas where, for security reasons, we do not want the ON Core to be found. In this way we can isolate the ON Core components and continue receiving the payloads from the agents.
4.1.5.2. Profiling
One of the features that the implementation of the visibility module provides us is the ability to assign a profile to a device that has been discovered on the network. In this way, we can separate the discovered devices according to their type, such as telephone, desktop, printer, etc. Smart TVs, Raspberrypi’s, PLC’s, camcorders, sensors, etc.
We achieve this device profiling by implementing profiling rules, using the information collected and verifying different parameters such as OS, DHCP fingerprint, ports, etc. We will be able to assign different device profiles that, later, will help us to have a more visual and organized way, a classification of the different devices that we have in our network.
Unlike the Tag policies, with the profiling Tags we only add EPT (End Point Type) Tags, these tags are exclusive, it is not possible to have two EPT* type tags assigned to the same device.
Device profiling flow:
The first step is to collect all the information possible through one of the discovery modes that we have previously configured, these configurations can be done through Network Device, the sensor method, Agent, etc.
Internally, all the information collected in the previous phase is used to assign Tags to the devices, for example, if it is detected that the device runs the Windows operating system, the ROS_WINDOWS tag will be assigned.
The second step is to profile and categorize the devices that we have discovered using different parameters and rules that we have configured.
Each device is evaluated by the different rules that have been previously configured, where it will fit in with these, depending on the previously assigned tags, and will “add points” that will end up indicating what type of device it is.
The last step, associate these rules to a Business Profile. When creating the profiling rules, the users generate different Business Profiles and associate the rules they have created with them, thus, every time a device matches a rule where we have configured an EPT tag, it will be registered in the relevant EPT View to have all devices of the same type grouped together.
Given that the profiling of the devices is carried out continuously, if new information related to the device is discovered, its profiling would be re-evaluated and it could change its profile.
4.1.5.3. Visibility Policies
The visibility policies are those that allow us to discover network devices by matching these policies. As seen above, there are different methods of visibility or discovery of devices and that is why these policies are correlated to the module or implementation of the deployed network.
Depending on the methods that we have deployed in our network, we will use some visibility policies or others that will differ, largely, by the type of source. In this case, we are going to detail the possibilities that we have of policies separately.
4.1.5.3.1. Creating visibility policies
To create a new policy we go to ON NAC -> Policies and click on Add new
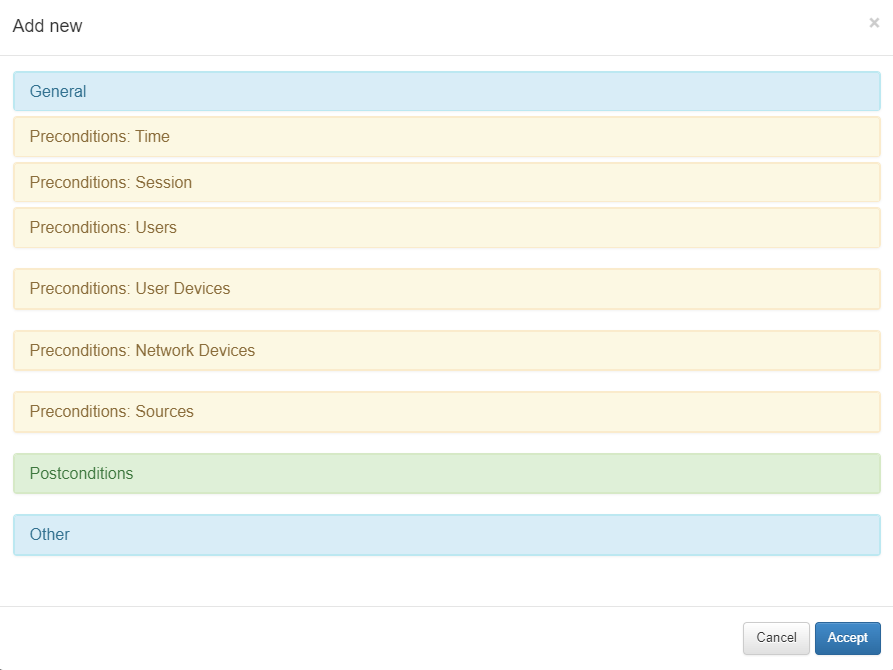
For visibility policies, it is not necessary to configure all the existing parameters in the policy and only those necessary for the visibility function in the network will be detailed.
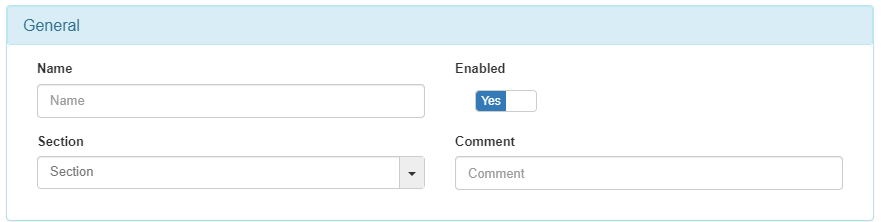
4.1.5.3.1.1. General
Every policy must have a name, a comment detailing the behavior of said policy and finally, if you wish to have this policy active, change the “Enabled” flag to “Yes”.
4.1.5.3.1.2. Preconditions: Sources
The preconditions allow to add conditions before the authentication happens.
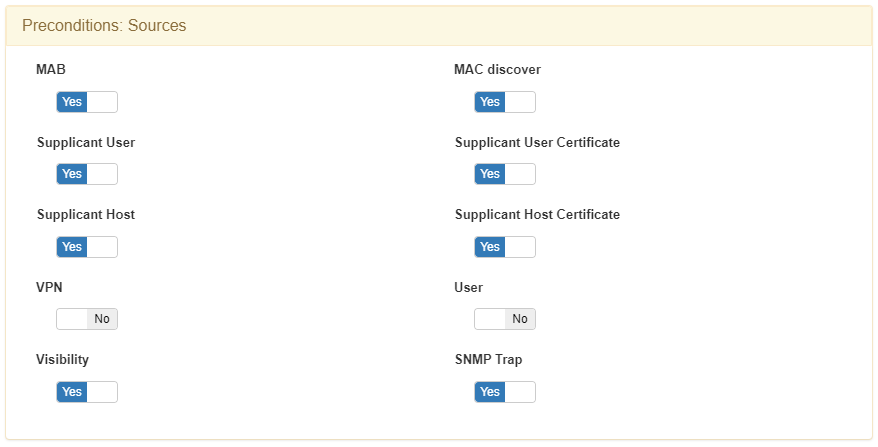
802.1x events: 802.1x events give us network visibility and device discovery through AAA (Authentication, Authorization, and Accounting) packets. Keep in mind that this discovery method is directly related to the network access control (NAC) functionality and therefore its use is conditioned by the implementation of the ON NAC module.
MAB
Supplicant User
Supplicant User Certificate
Supplicant Host
Supplicant Host Certificate
MAC Discover: When we see traffic through the Sensor with an IP that was not previously identified by the system, MAC discover offers us the possibility of discovering the user device or MAC associated with this IP. By asking the network devices (configured in the CMDB), which act as default gateway, we can determine the MAC by consulting the ARP tables of these network devices.
Visibility Events: The visibility source allows ON Core to process all those events generated that give us network visibility, for example, events from ON Sensor. Any event can become a visibility event if there is no previous data related to the connection, these can be from IpMac, Agent, Accounting, etc.
SNMP Traps Events: The SNMP TRAP source allows ON Core to process events that come from SNMP Traps sent by network devices. This Trap must be in version 1, 2, or 3 and include the MAC address of the user device. It is important to emphasize that the Traps must be of the MacChange type since the LinkUp/LinkDown do not have an associated MAC, so they do not provide us with visibility.
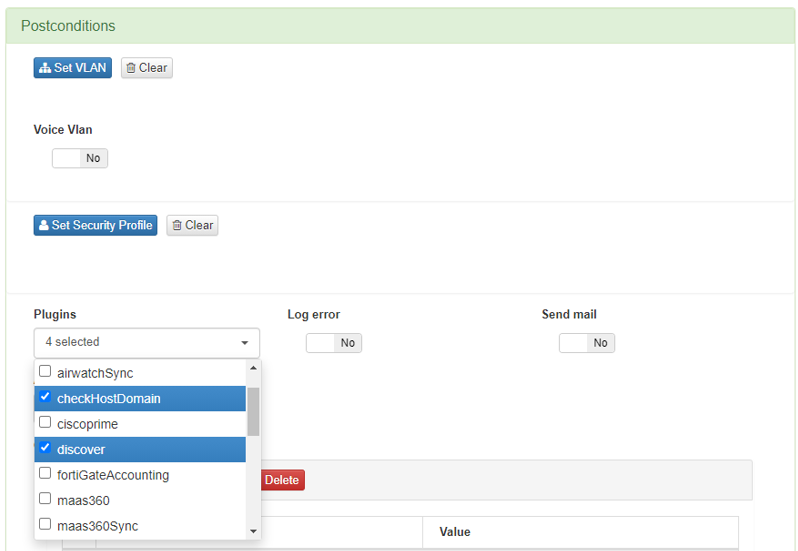
4.1.5.3.1.3. Postconditions
Once a policy has been embedded, it is possible to define certain system actions against the discovered device, these are called postconditions.
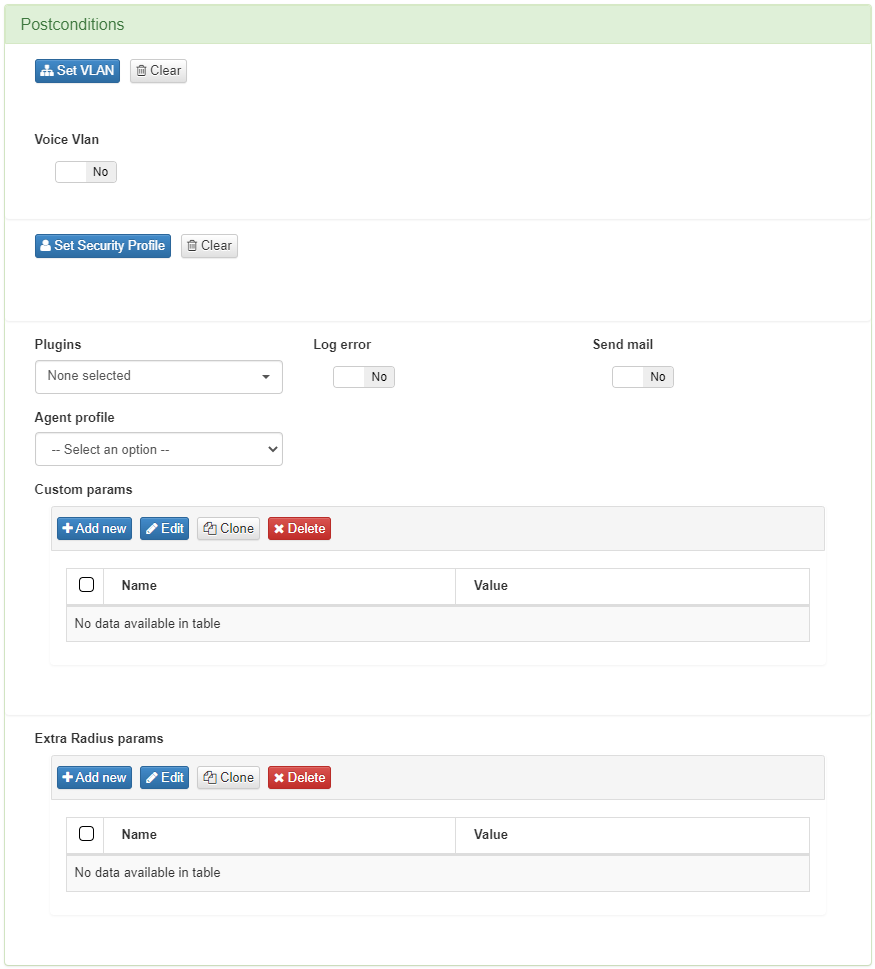
The first one is to determine which VLAN the device is going to be sent to. Since this is a visibility module and not a NAC or network segmentation module, the default option should be VLAN 0 or Switch Default. By using Switch Default, OpenNAC Enterprise will not modify the VLAN to which a device will be assigned and the switch will use the one defined by default. The definition of a VLAN is mandatory in all policies.
Next, we have the Plugins, which will be discussed in detail later. These plugins allow us to perform a deeper profile of the devices that access the network. In this section, we should select those plugins that we want to execute once the preconditions of the policy have been overcome.
4.1.5.4. Profiling Rules
This section allows defining different parameters to evaluate every single asset discovered by OpenNAC Enterprise. Based on this evaluation OpenNAC Enterprise inserts an EPT tag on the asset and the user can generate a policy or policies to validate or filter the assets that match it.
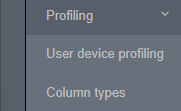
User device profiling: Allows managing policies associated with the mechanism to identify the type of asset
Column types: Allows to manage (add, edit, or remove) the components used by user device profiling.
4.1.5.4.1. User device profiling
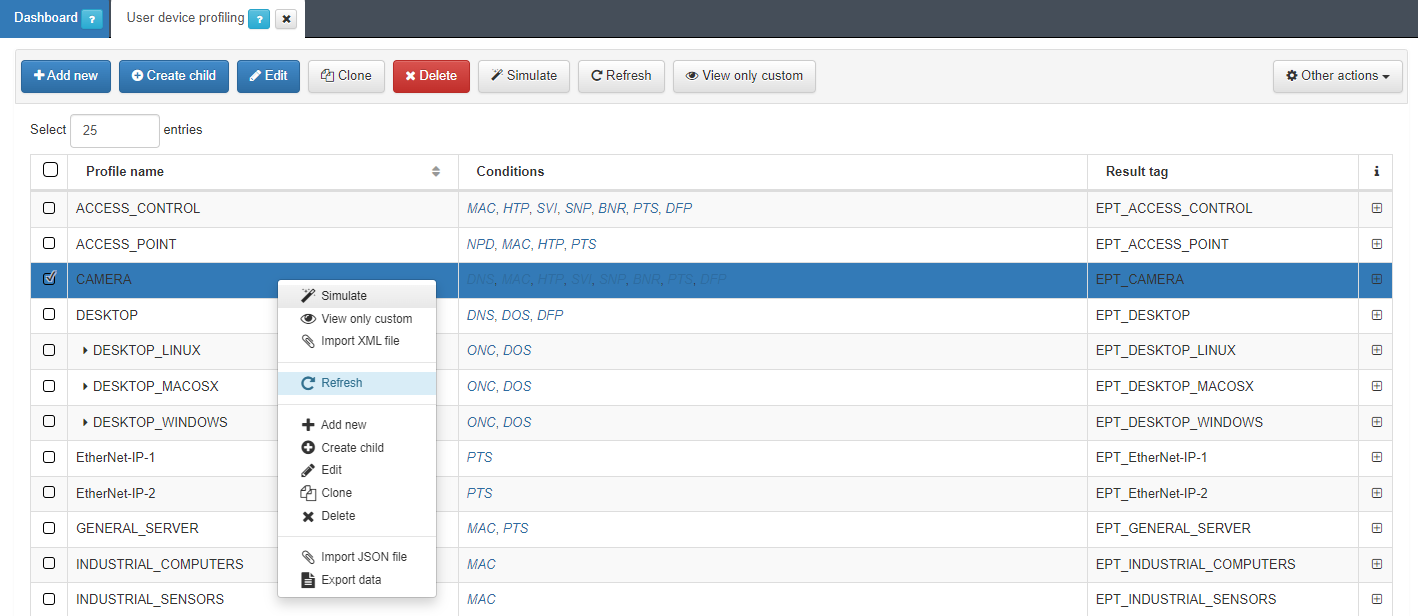
In this section, the user can create, edit, clone, delete, and simulate tags for endpoints discovered in the network. Also, administrators can import profiles from a JSON file. Based on this evaluation, OpenNAC Enterprise will insert a tag indicating the type of the device with the aspect “EPT_<device type>”
Note
When traversing this section, only continue traversing one of the hierarchies if at least one rule of the main hierarchy has been met. For example, EPT_DESKTOP_WINDOWS will be checked if at least one rule of EPT_DESKTOP is satisfied.
In addition, Parent Profile (PP<hierarchy level>_) and Parent Device Profile (PDP) tags will be added to tag different levels of the hierarchy, for example, EPT_DESKTOP_WINDOWS will create PP1_DESTKOP, PP2_DESKTOP_WINDOWS, and PDP_DESKTOP.
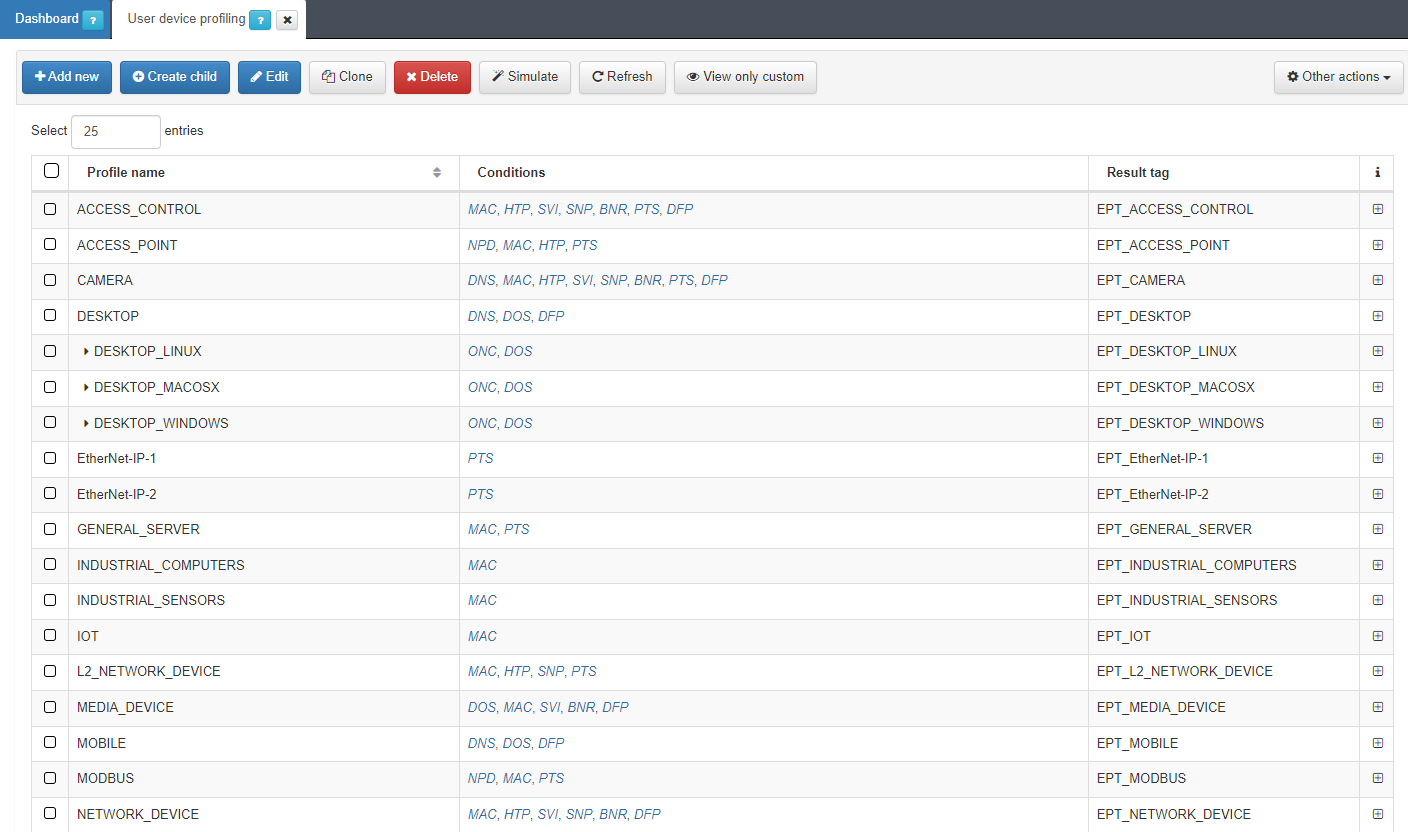
It is recommended to keep intuitive names to identify the profile’s reason. We can expand the information of each profile by clicking on the + icon:
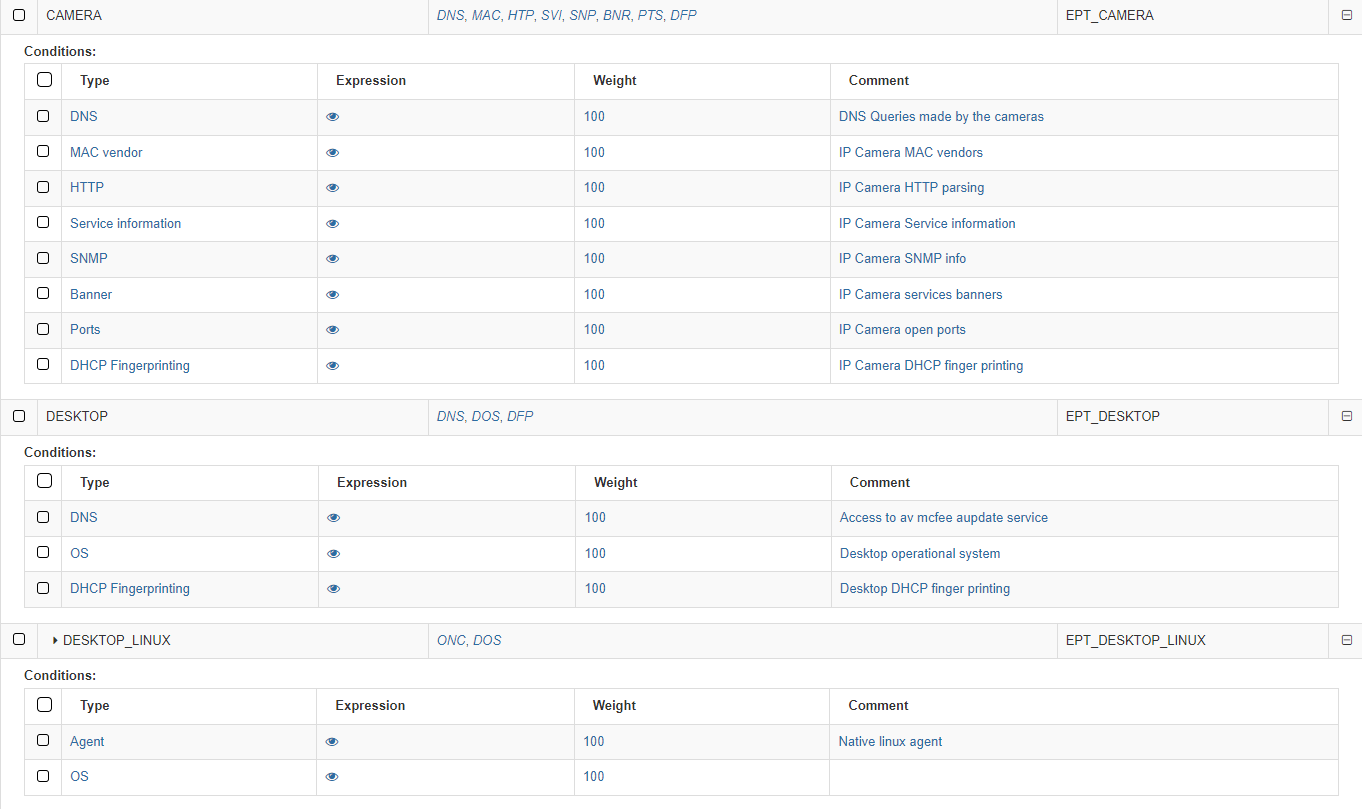
The first column on conditions shows the Type. The following list shows examples of mechanisms and methods used to identify the type of asset discovery and how it is going to be categorized:
Banner: OpenNAC Enterprise uses the banner discovered by the scanner used.
DHCP Fingerprint: OpenNAC Enterprise uses the DHCP Fingerprint capability to identify the asset type. DHCP Fingerprint is a profiling technic that allows you to identify the type of assets based on DHCP messages and its behavior.
HTTP: Information harvested by an HTTP request to the asset discovered -customized streams can be included to identify assets.
MAC Vendor: OpenNAC Enterprise can use the OUID associated with the MAC Vendor in order to discover asset typology. There may be general manufacturers (components) but in some cases, these are specific to the type of device. This system performs a weak identification since it is relatively easy to change or spoof the MAC on a device (MAC Spoofing)
Ports: OpenNAC Enterprise can use the open ports by the asset to identify the asset types.
Service Information: OpenNAC Enterprise uses the service information identified by the OpenNAC Enterprise Scanner (based on nmap), that provides the asset associated with a service.
SNMP: OpenNAC Enterprise can get and use SNMP information from the assets, additional information such as communities and OID can be used and defined.
OS: OpenNAC Enterprise uses the device operating system to get a better profiling.
Network protocol: OpenNAC Enterprise identifies the network protocol used by the device.
DNS: The DNS queries made by the device are used by OpenNAC Enterprise.
Agent: The native agent attributes allows OpenNAC Enterprise to get better profiling.
The second column Expression allows us to see the expression used by clicking on the eye icon. by the product to identify the assets types. For example an “or” (|) between some MACs:
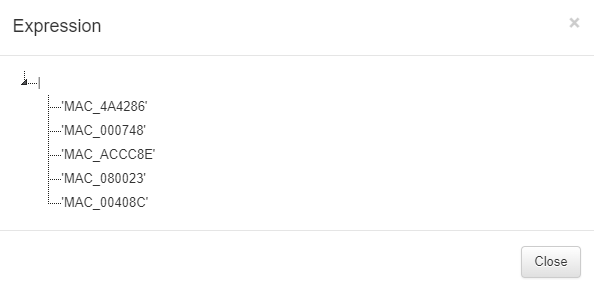
The expressions used for creating rules must be written using the following specifications:
parameters: Elements that make up the expressions (Tags).
( ): Parentheses are used to group expressions and parameters.
|: The OR character (logical operational) to indicate that any of the parameters are valid.
&: We use the AND character (logical operational) to indicate that the parameters are sums, meaning they all have to be fulfilled.
!: We use the NOT character (logical operational) to indicate that it should not contain the parameter.
,: The comma is used to indicate and separate the new parameter to analyze.
‘ ‘: Parameters are declared in quotes. For example:
Must contain all parameters = (&,’MAC_B2C7BE’,’EPC_CORPORATE_DEVICE’)
Must contain one of the parameters = (|,’MAC_B2C7BE’,’EPC_CORPORATE_DEVICE’)
Must not contain the following parameter = (!,’MAC_B2C7BE’)
The third column Weight defines a number from 0 to 100 that indicates the weight we want to apply to that condition.
The last one, Comment, shows the comments associated with the mechanism.
For each profile, we can see the tag that will associate with the device that matches the conditions.
To add a new rule, click on Add new:
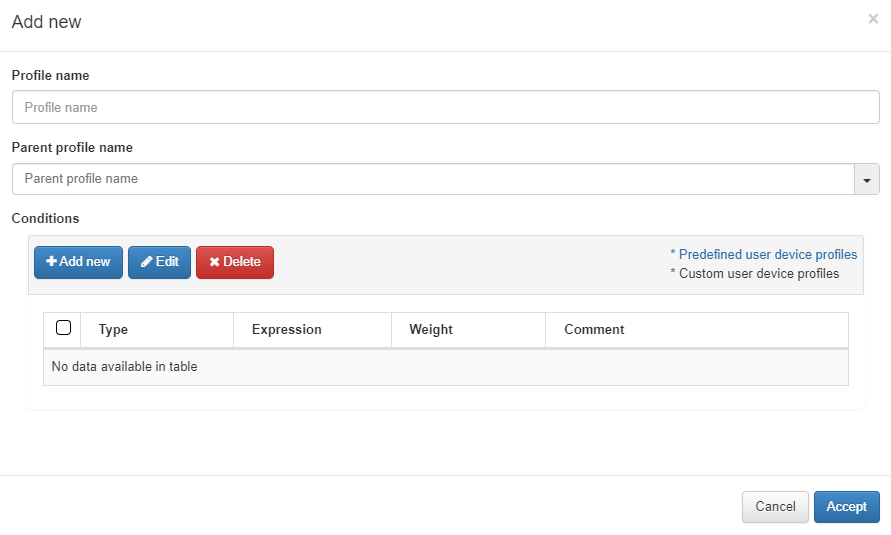
The parameters that should be configured are the following:
Profile name: Name of the profile that corresponds to the tag that will be added to the device if it matches (EPT_<profile name>). When defining the name, it is not necessary to add the EPT prefix since it will be added automatically.
Parent profile name: In the case of a “child” rule (explained below), we select the name of the parent rule that it belongs to.
Conditions: The next step will be to configure the conditions for our rule. Some of them will already be predefined, but if not, we can configure them at our convenience. If we already have one configured, we can select and edit it if not, to create a new one click on Add new and a window like the following one will open.
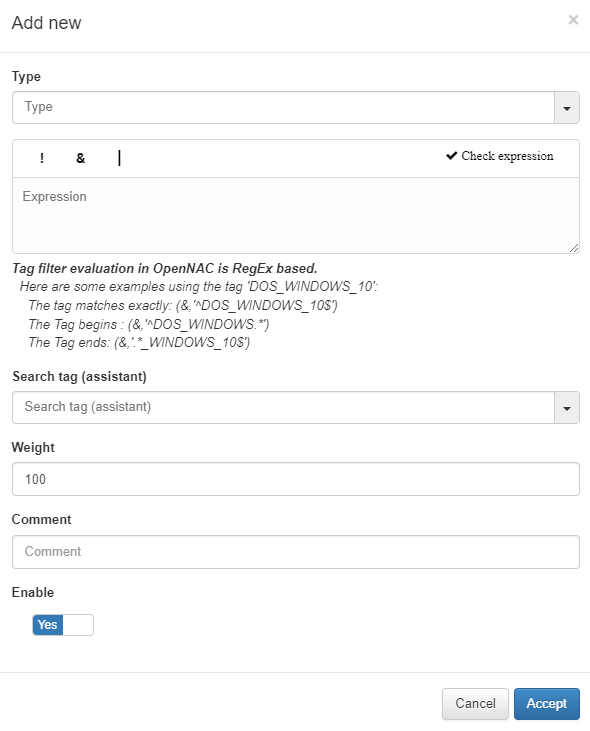
Type: The list with all the options that we have configured in the Column Types section. This field will indicate what type of condition it is and what it verifies.
Expression: Logical expression to be evaluated on each device. When this condition is executed within the rule, for these expressions we will use operators AND(&), OR(|), and NOT(!) and the operands will be those Tags that the devices should or should not have.
Search tag (assistant): We can use the tag search assistant to find those tags that we can use in the expressions. If we click on the found tags, they will be added automatically in the expression field.
Weight: This is the weight that this condition will have. At the time of evaluating them, if they coincide, said weight will be assigned to the overall score of the profiling rule. The greater the weight, the greater the importance of the condition.
Comment: To detail the behavior of this condition.
Enable: Flag to enable this condition.
As previously mentioned, another option is the creation of “Child” rules, which will be a subcategory of the rules that we have already created. They will help us to modify, add, or eliminate some extra parameters to that existing policy so it can accurately profile the discovered device.
Note
It is important to mention that the child rules will inherit all those conditions defined in their previously created parent rule.
To create a Child policy, select a created policy and click on Create child
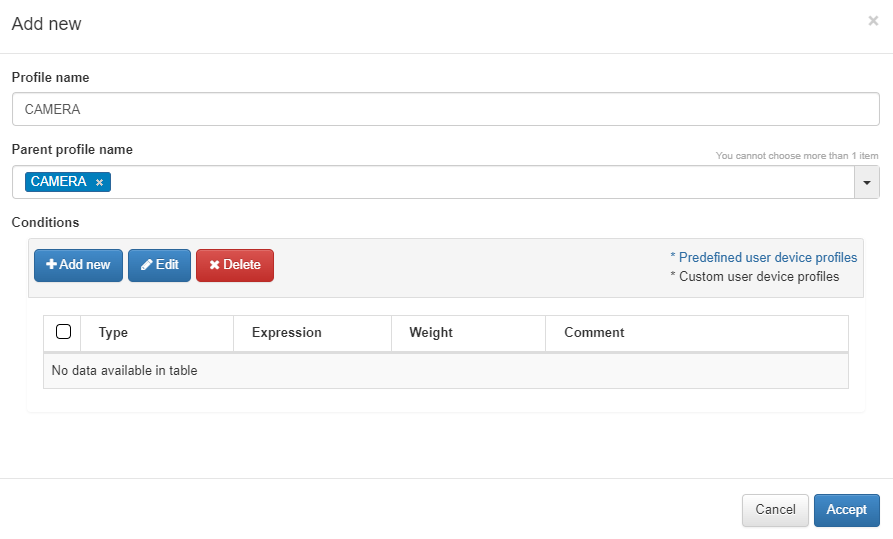
Child rules will inherit all the rules of their parent rule, but these can overwrite them to make them more specific and identify the child device.
For the conditions, we will click on Add new and configure the same parameters as when configuring a normal rule.
The user device profile allows us to create new expressions with the tag associated, in this example EPT_CAMERA. By adding a new UD tag policy, we can see the new tag with the Search tag (assistant). For more information, read ON NAC -> Tag policies -> UD Tag Policies.
Note
Administrators can perform a user device profiling simulation for any asset in OpenNAC Enterprise CMDB by right-clicking and selecting Simulate option.
4.1.5.4.2. Column Types
Column types define the parameter to evaluate before inserting a tag into the assets. The user can define a tag that evaluates some open ports or the MAC vendor and later based on the result insert a tag into the devices.
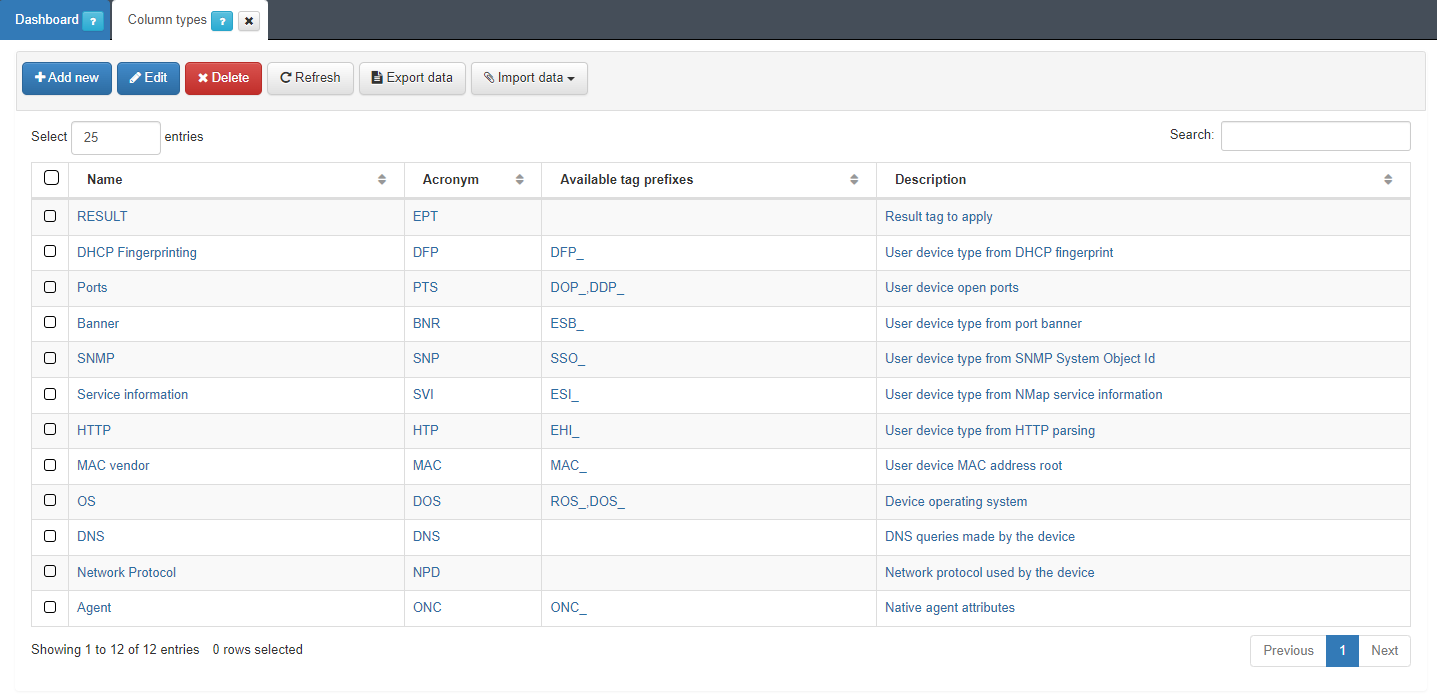
These Column Types do not add any logic to device profiling beyond the classification by condition type in the profiling rules.
To create a new parameter, click on Add new.
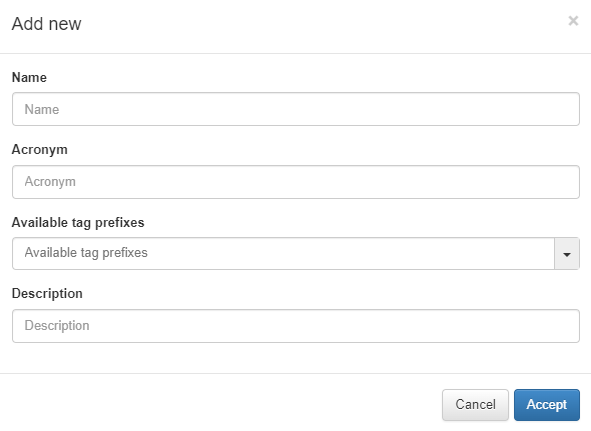
Name: Name of the new column type.
Acronym: Acronym used for this Column Type. It is recommended that it as descriptive as possible and refers to the name to avoid confusion. For example, DHCP fingerprint -> DFP.
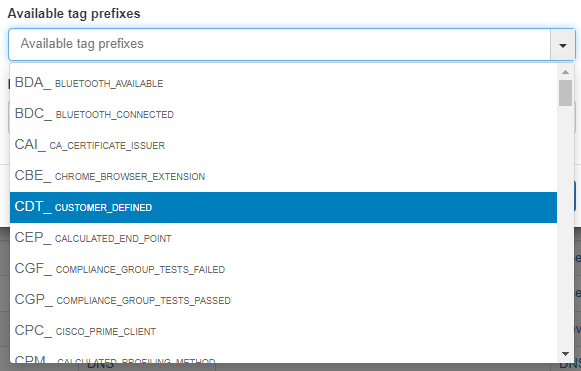
Available tag prefixes: Tags related to the type that is being defined. For example, in an operating system Column type, the Tags related to this could be ROS (Root operating System) and DOS (Device Operating System). This information is purely informative and does not imply any limitation when creating the profiling rules.
Description: description of the column type.
4.1.5.5. Business Profiles Creation
It is possible to create new groups of Business Profiles to categorize our connections. It can be useful to create a group of Business Profiles for each company site.
To create a new group we must access ON NAC -> Business Profiles -> Business Profiles configuration:
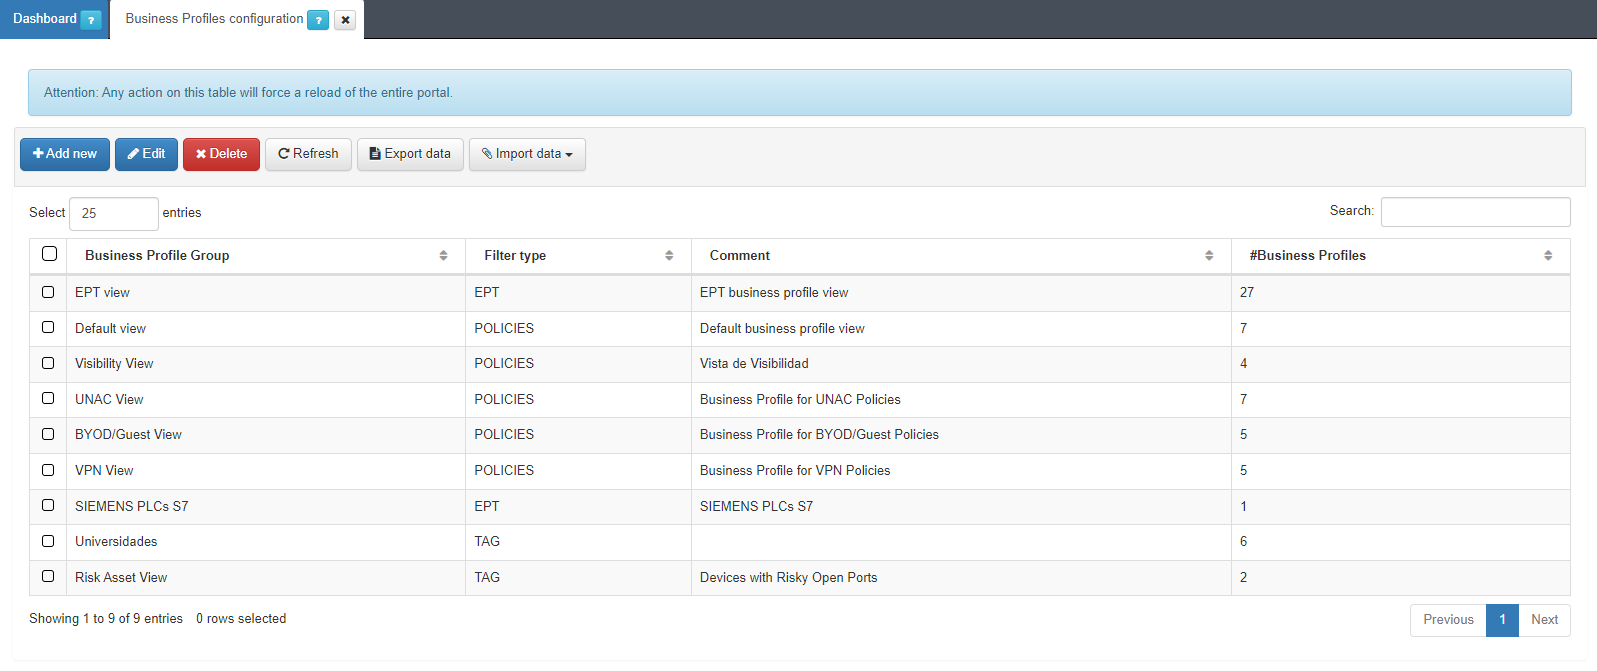
Click on Add new to create a new group and a new window will appear:
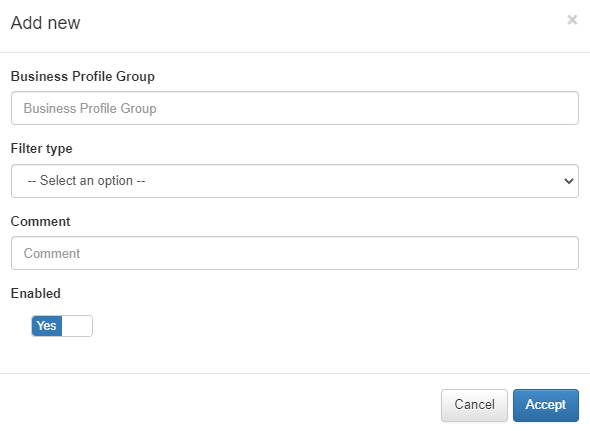
Business Profile Group: Name of the new Business Profiles group.
Filter Type: Type of Business Profile filtering, this can be “DEFAULT” which filters by NAC policies or “EPT” which filters by type of device according to the EPT tag.
Comment: Comment from the Business Profile group.
Enabled: We activate or deactivate the group.
4.1.5.6. Plugins Configuration
In order for the plugins used in the visibility module to work correctly on our network, they must be configured appropriately.
Plugins are key elements for device profiling within the network. These plugins collect a lot of information about user devices that we can then use to create profiling rules and determine device type.
Note
It is only recommended to install those plugins that are necessary for the proper functioning of the organization. Installing more Plugins than necessary increases the attack surface, thus benefiting attackers.
To activate and configure these plugins we must access Configuration -> Plugins:
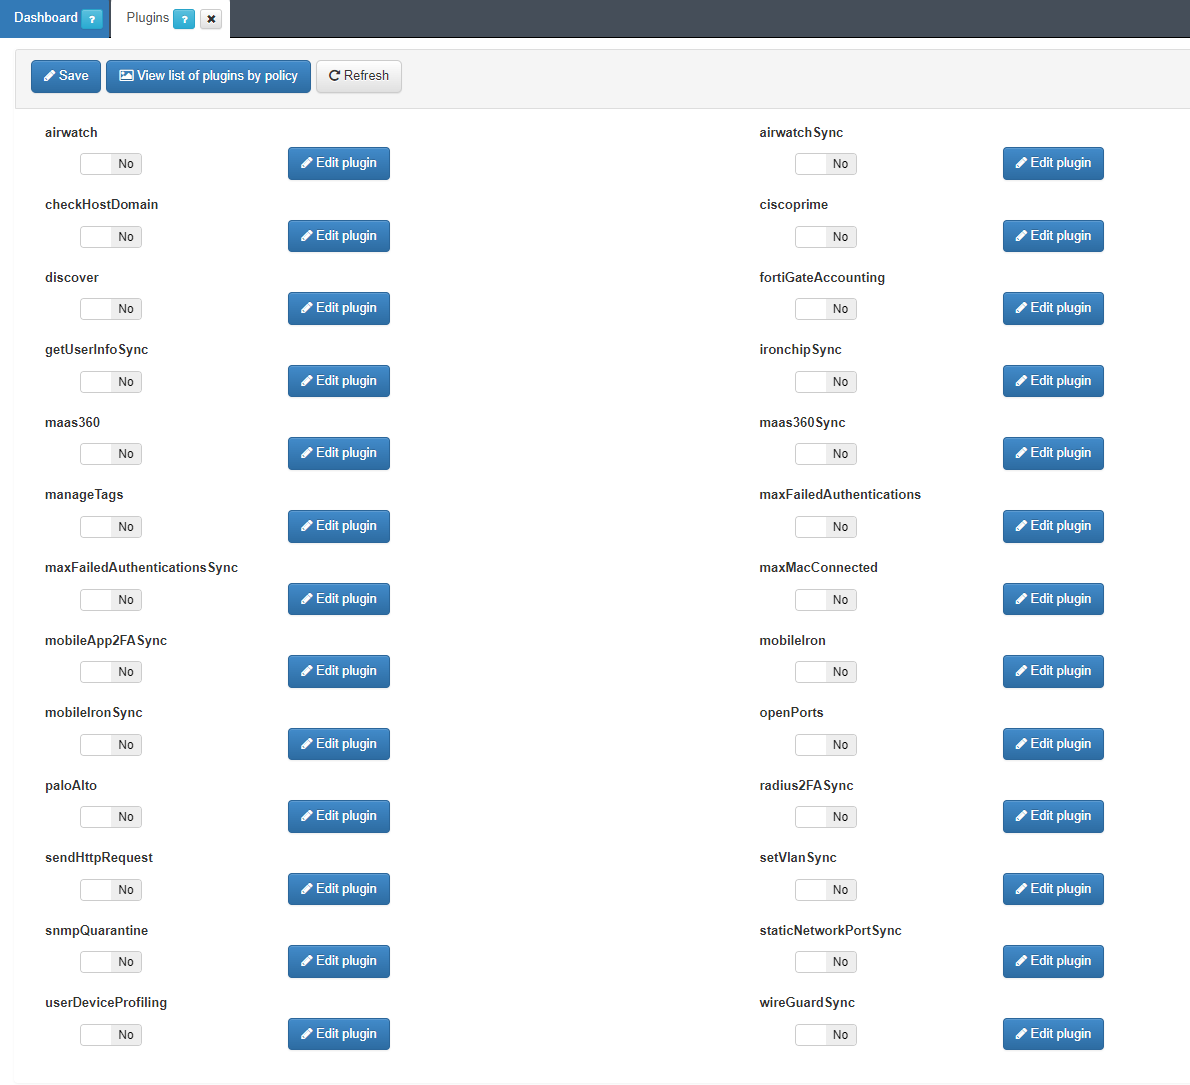
Here we must activate those plugins that we want to use, the main visibility plugins are discover, checkHostDomain, userDeviceProfiling and openPorts. To configure each of these plugins we must press the Edit Plugin button on the right side of each one.
It is important that after selecting those plugins that we want to activate, we press the Save button at the top to save the changes.
If these plugins are not configured correctly, it is likely that they will not work correctly. Next, we will detail how to configure each of these plugins.
4.1.5.6.1. Discover
The Discover plugin uses the IP address of the asset to gain visibility. Discover runs Nmap and SNMPwalk commands on assets to perform discovery.
The plugin discovers all the devices using Nmap, cURL or the SNMP protocol, in the case of SNMP, it uses the communities defined in its configuration, as well as different types of scans, TCP, UDP, ICMP, extract banner and obtain traces on the operating system and services.
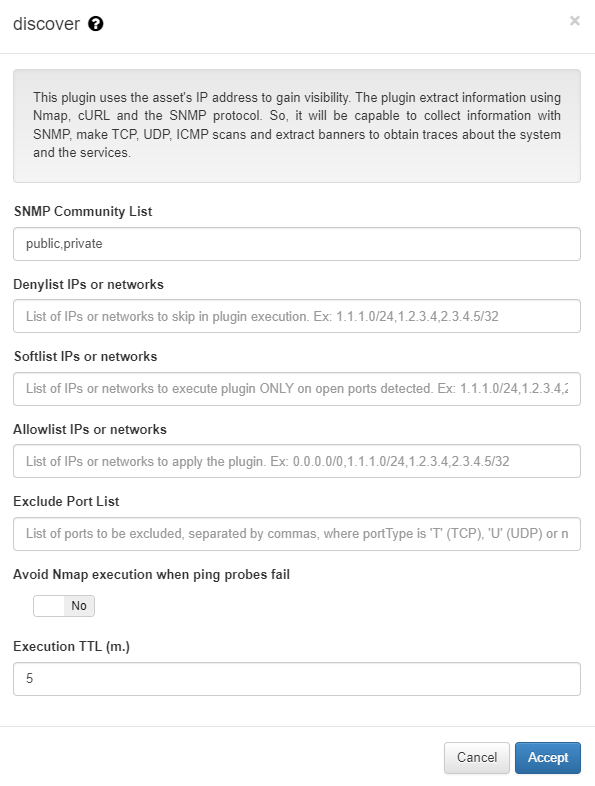
SNMP Community List: List of communities used by the plugin when executing scans using the SNMP protocol.
Denylist IPs or networks: IP range, or a comma-separated set of IP ranges that the plugin should not scan.
Softlist IPs or networks: IP range, or a set of IP ranges separated by commas that the plugin runs only on ports defined as open ports using “DOP” (Device Open Ports) tags. Another plugin (active or passive) may have provided the information regarding the status of the ports. This functionality allows discovering “banners” on known and open ports through a soft scan.
Allowlist IPs or networks: IP range, or a comma-separated set of IP ranges that the plugin should scan.
Exclude Port List: List of ports excluded in the mapping.
Avoid Nmap execution when ping probes fail: If this option is checked, the Nmap scan will not be executed if the previous ping probe fails. Unchecking this option reduces execution time when the computers it is launched to do not have an active firewall blocking ICMP packets.
Execution TTL (m.): The TTL execution allows defining a minimum time for this process to be carried out, this guarantees that this plugin will not be executed against the same device before this time has elapsed.
4.1.5.6.2. CheckhostDomain
The CheckhostDomain plugin allows us, through the name of the computer that will have the domain, to know if it is a computer belonging to the corporate domain or not through a query to the AD. This will ask AD if the hostname is registered as a valid host in the domain. There is the possibility that a computer that is not correctly registered in the domain, but this has the same name as a computer that is, in this case it would be considered as it belongs to the domain. To obtain the hostname of the equipment, different methods can be used. These can be DHCP packets, using 802.1x authentication of the HOST type or the discover plugin.
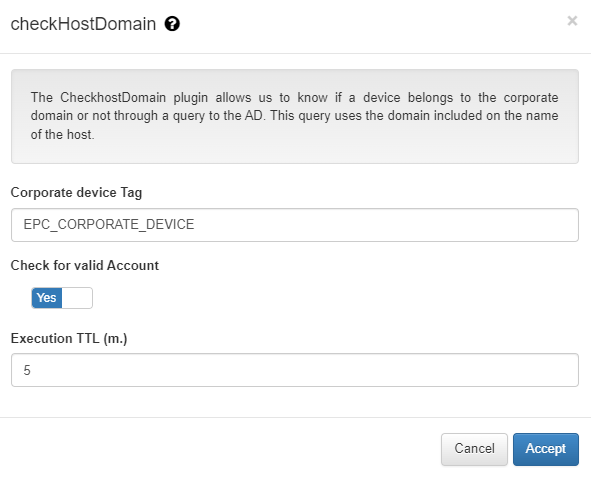
Corporate device Tag: Tag that will be added to the device if it is an asset belonging to the corporate domain.
Check for valid Account: If this option is checked, it will be validated if the account, in addition to existing within the domain, is enabled.
Execution TTL (m.): The TTL execution allows defining a minimum time for this process to be carried out, this guarantees that this plugin will not be executed against the same device before this time has elapsed.
4.1.5.6.3. UserDeviceProfiling
This plugin allows you to search information from the On Analytics data lake. This information is based on the behavior of user devices on the network. This plugin queries Elasticsearch for the connections made by a certain device to obtain information on the traffic it generates, such as the top 10 DNS connections that have been generated by the device. The analyzes can then be used by ON Core components.
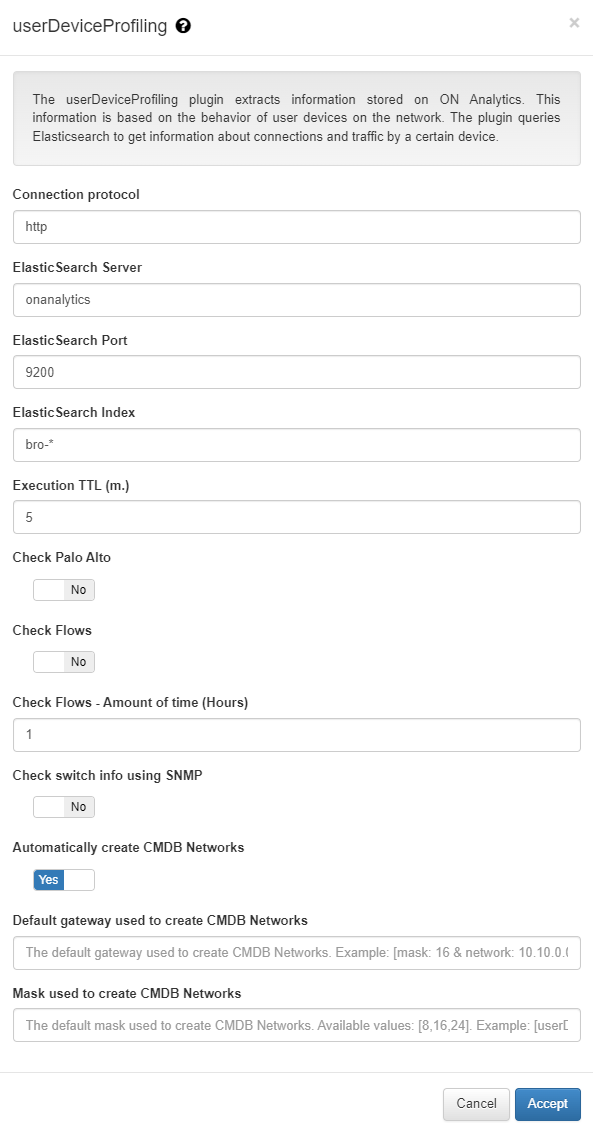
Connection protocol: Protocol used for the connection with ElasticSearch, this protocol can be HTTP or HTTPS.
ElasticSearch Server: IP of the ElasticSearch server (ON Analytics).
ElasticSearch Port: Port for the connection with ElasticSearch (9200).
ElasticSearch Index: Name of the ElasticSearch data storage index.
Execution TTL (m.): The TTL execution allows defining a minimum time for this process to be carried out, this guarantees that this plugin will not be executed against the same device before this time has elapsed.
Check Palo Alto: Indicate if there is a PaloAlto firewall that is sending information to ON Aggregator so, if so, to query the information that PaloAlto has collected.
Check Flows: Indicate if there are active flows (NetFlow/SFlow) in the network pointing to the ON Aggregator to, if so, query the information collected by them.
Check Flows - Amount of time (Hours): Consultation time of the information collected by the Flows.
Check switch info using SNMP: Based on the information obtained through Flows, SNMP queries are made to the switches to, for example, determine the MACs of the ports.
Automatically create CMDB Networks: It indicates if openNAc autopopulates CMMDB networks and CMDB VLANs.
Default gateway used to create CMDB Networks: The default gateway used to create CMDB Networks.
Mask used to create CMDB Networks: The default mask used to create CMDB Networks.
4.1.5.6.4. OpenPorts
The openPorts plugin, like Discovery, uses Nmap to perform a port scan. In this case, the scan is performed only on a set of ports already defined in the configuration of the plugin itself. This plugin simply checks which ports are open without any extra validations as it is done in the Discovery plugin, for example, the “banners”. This plugin is useful when a deep scan or advanced profiling (discover) is not required and we just want to determine which ports are open. Being a simpler plugin, it runs faster.
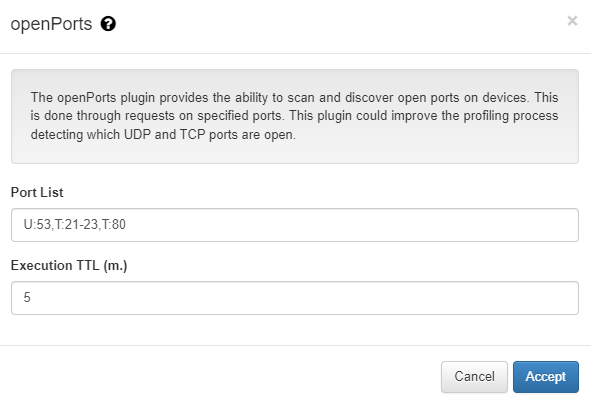
Port List: List of ports to which the device is scanned. U type ports refer to UDP type ports, and T to TCP ports. With “:” we indicate those ports included, the “,” type or group change and the “-” indicates a range of ports.
Execution TTL (m.): The TTL execution allows defining a minimum time for this process to be carried out, this guarantees that this plugin will not be executed against the same device before this time has elapsed.
4.1.5.6.5. Applying plugins to policies
To make use of the visibility plugins, they must be activated in each of the network access policies. These plugins are part of the “Postconditions” section of the policies, that is, they are executed once the device has matched said policy.
To activate these plugins we must go to ON NAC -> Policies to create a new policy or modify an existing one.
We select Add new or Edit at the top and a window will open to configure a policy. We go to the Postconditions section and in the Plugins dropdown, we select those that we want to activate.
There is the possibility of modifying the configuration of these plugins in the policy itself by adding Custom params, in this way the configuration parameters of the plugin are modified only for its execution.
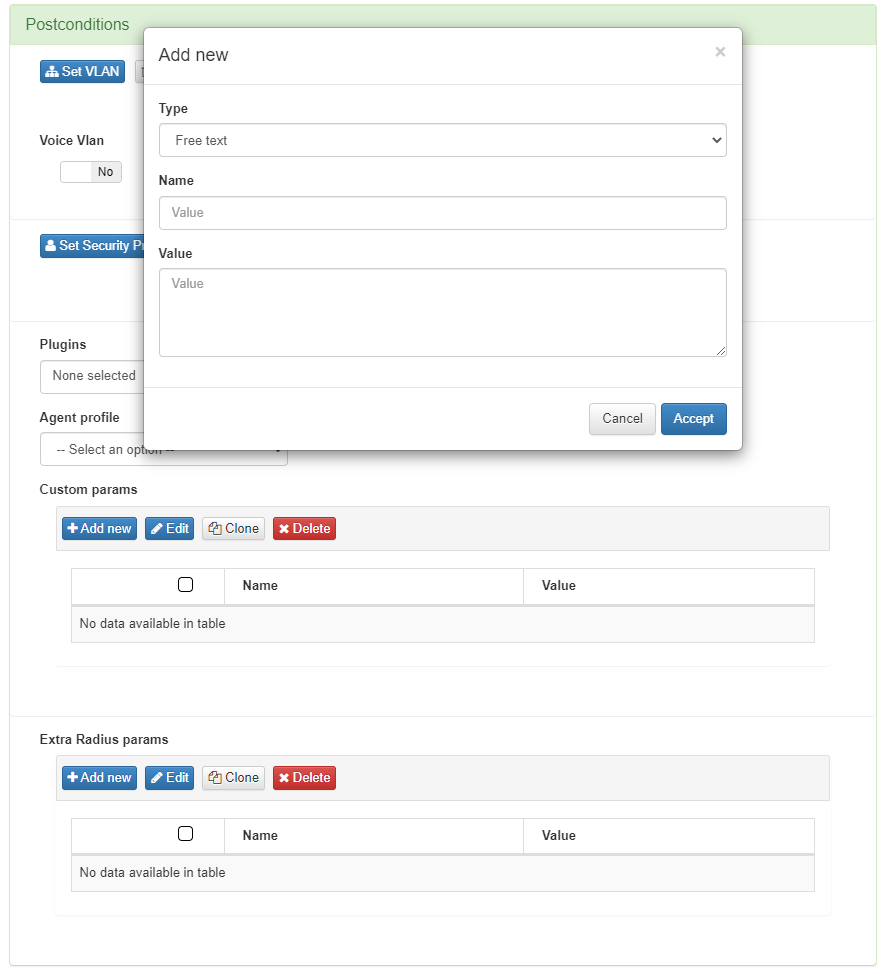
These custom params are configured with the following attributes:
Type: Type of custom parameter, in this case Plugin configuration.
Name: Name and parameter of the plugin that we want to modify.
Value: Value to be assigned to the selected parameter.
Once all the necessary plugins have been marked and the rest of the policy configured, we can click on Accept to save it.
4.1.5.7. SNMP Traps Configuration
Through SNMP Traps, the system is able to collect information about the MAC, the switch, and the port where the devices are connected and disconnected.
To activate the SNMP Traps functionality and for the system to monitor these, we must access the Configuration -> Configuration Vars section and select Generic in the upper tabs.
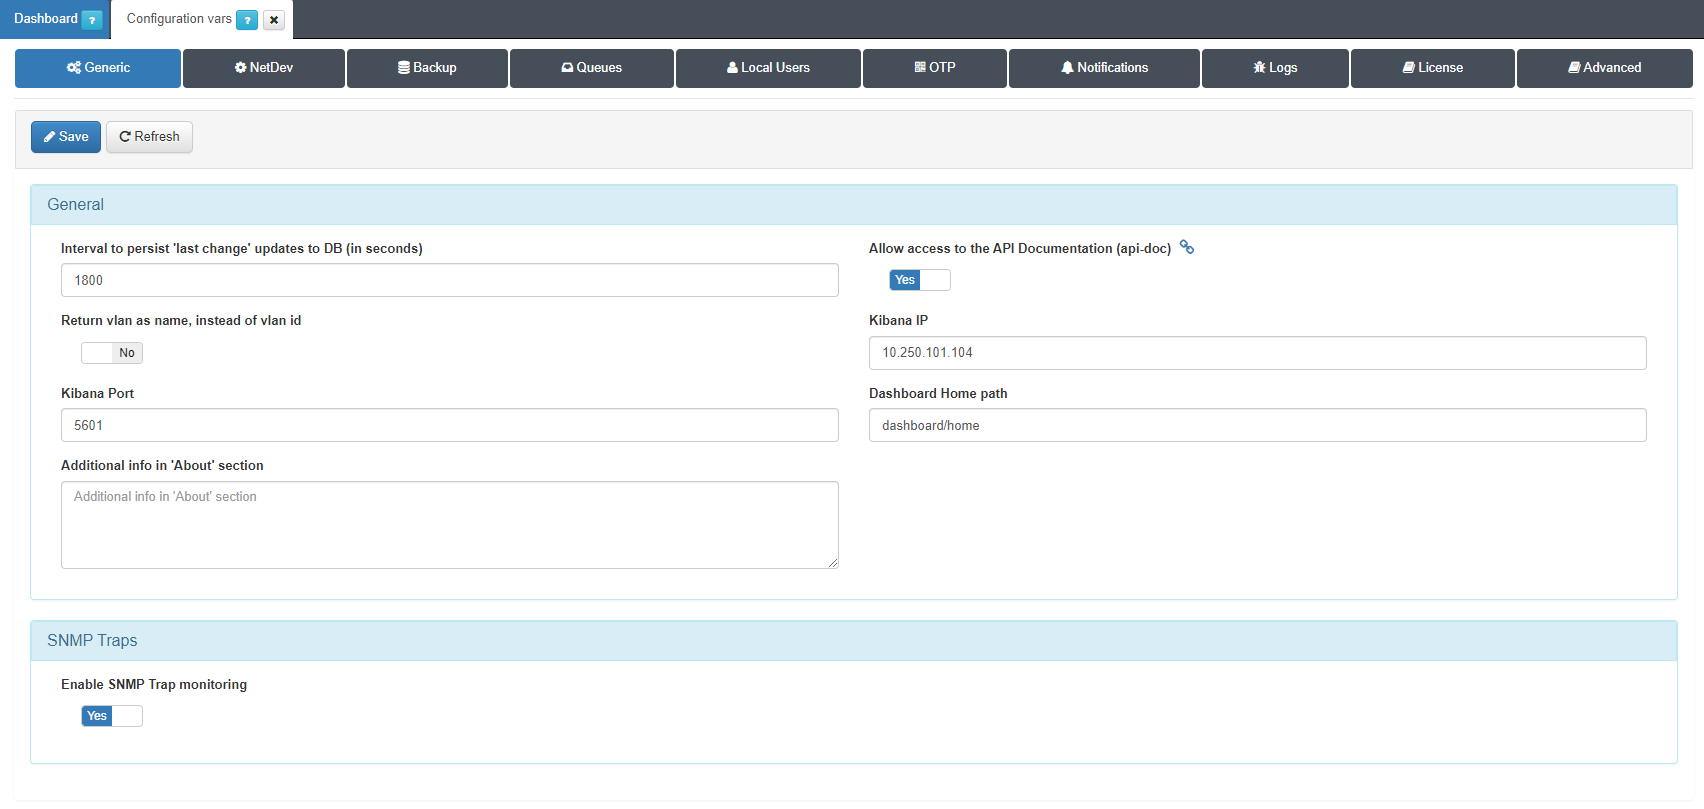
To activate the functionality we simply have to mark the Enable SNMP Trap monitoring box as Yes.
take into account that a correct configuration of the network switches is necessary. In this case, it is required that the SNMP Traps of the switches point to the system so that it receives the information correctly.