Dashboards
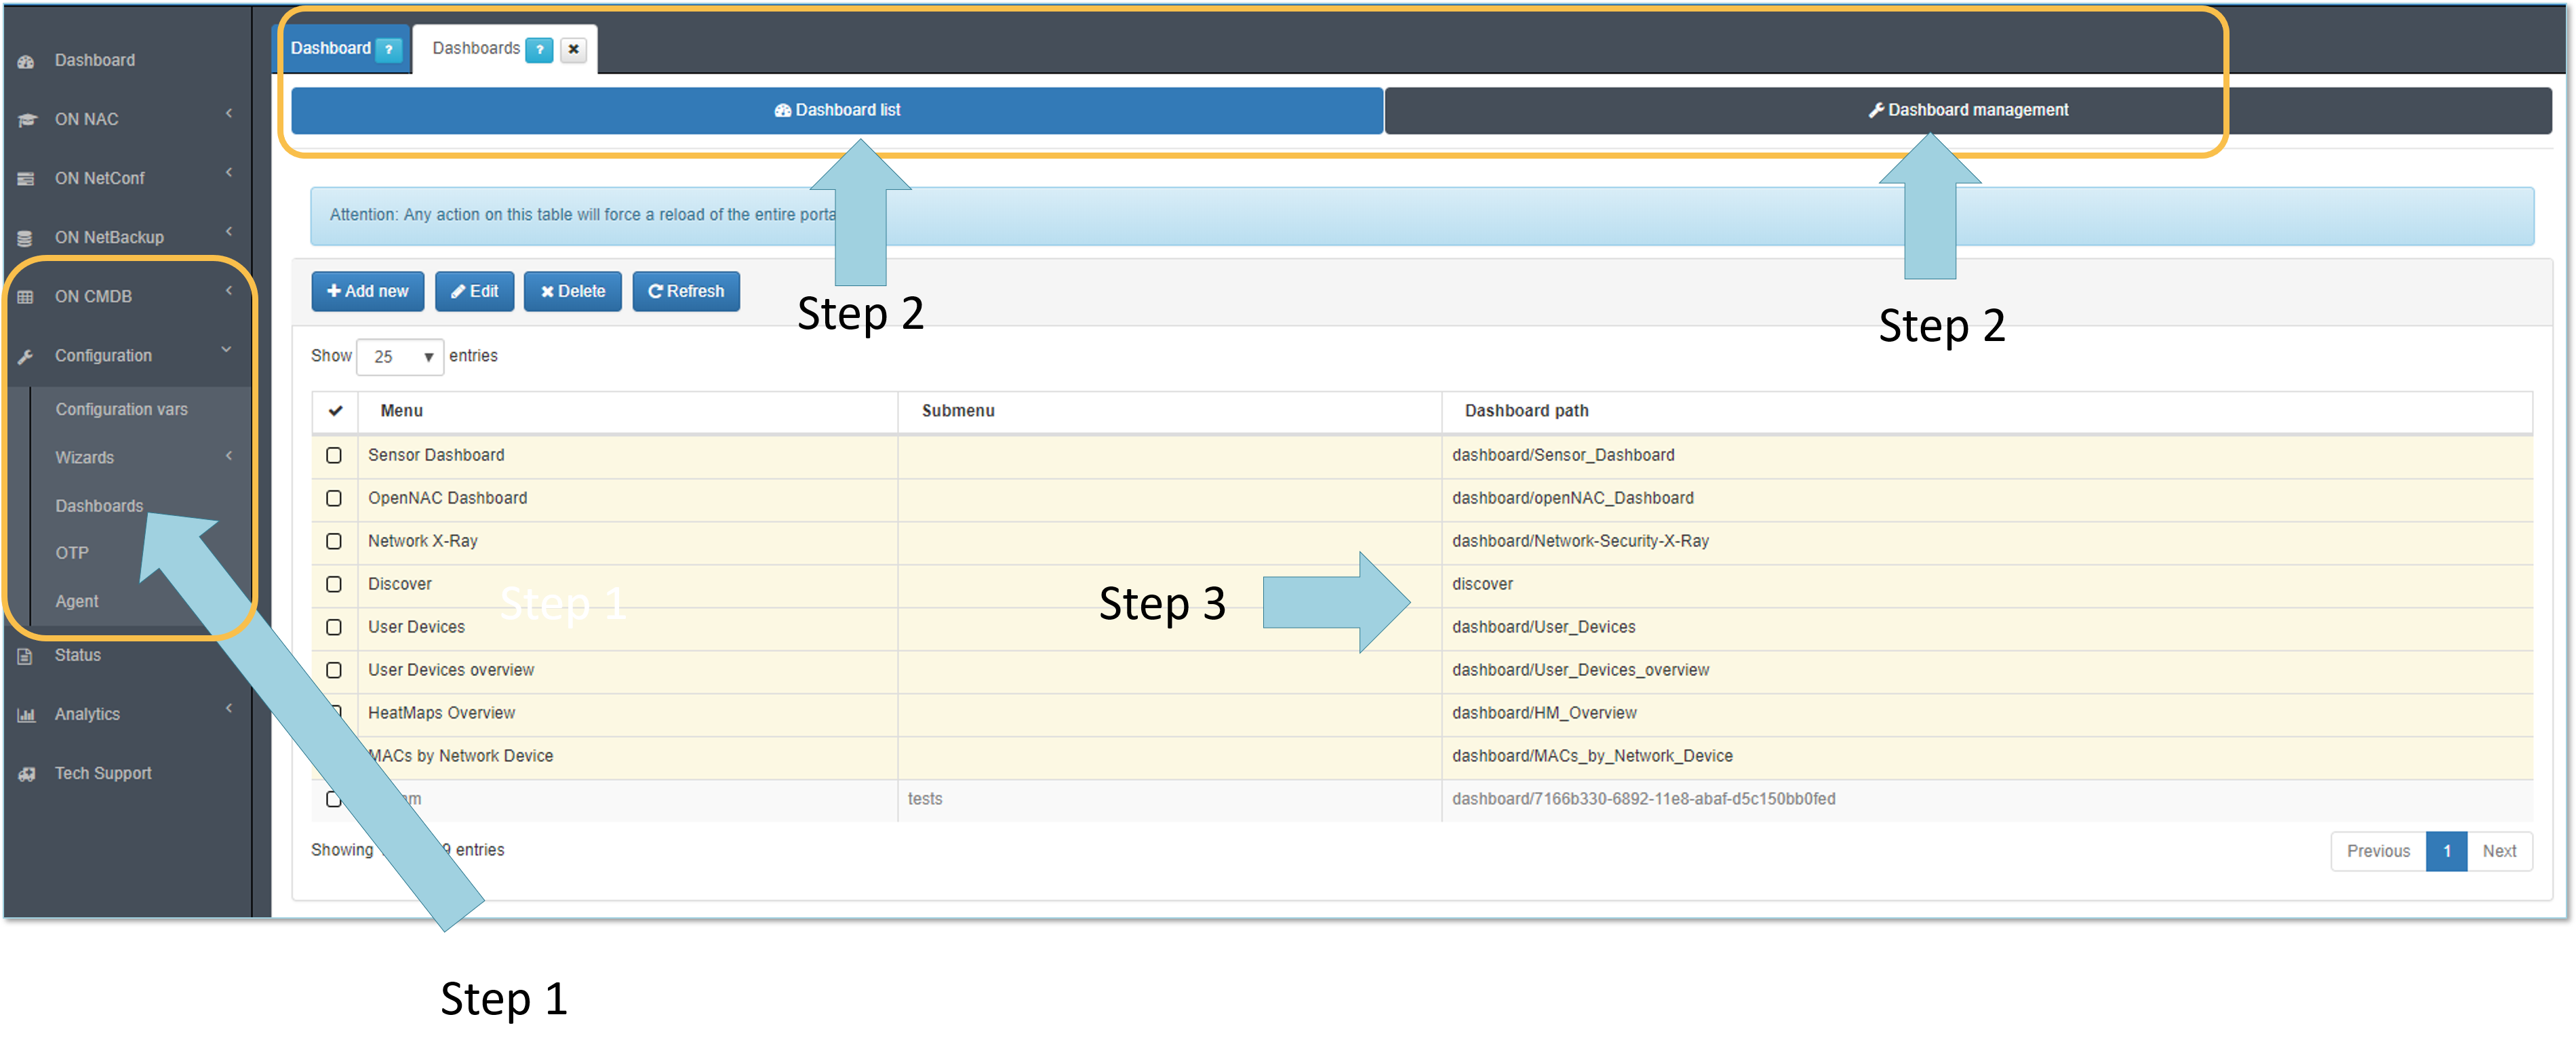
openNAC Analytics is one of the components of openNAC technologies, this node is deployed through a OVA file in any hypervisor providing many benefits. openNAC Core and from its administration portal is possible visualized the information collected by analytics, part of this information is shown in dashboards and this dashboard can be created and managed following the section Dashboards as shown by (Step 1)
Dashboard list is tab as shown by Step 2 shows the out of the box section that allows you to customize dashboards, Add new, deleting or editing, from this tab is possible to define the path associated with the dashboard itself, out of the box we have the following dashboard paths which identify where are located and where to find it to openNAC Analytics.
- dashboard/Sensor_Dashboard.
- dashboard/opennac_Dashboard.
-dashboard/Network-Security-X-Ray.
- discover.
- dashboard/User_Devices.
- dashboard/User_Devices_overview.
- dashboard/HM_Overview.
- dashboard/MACs_by_Network_Device.
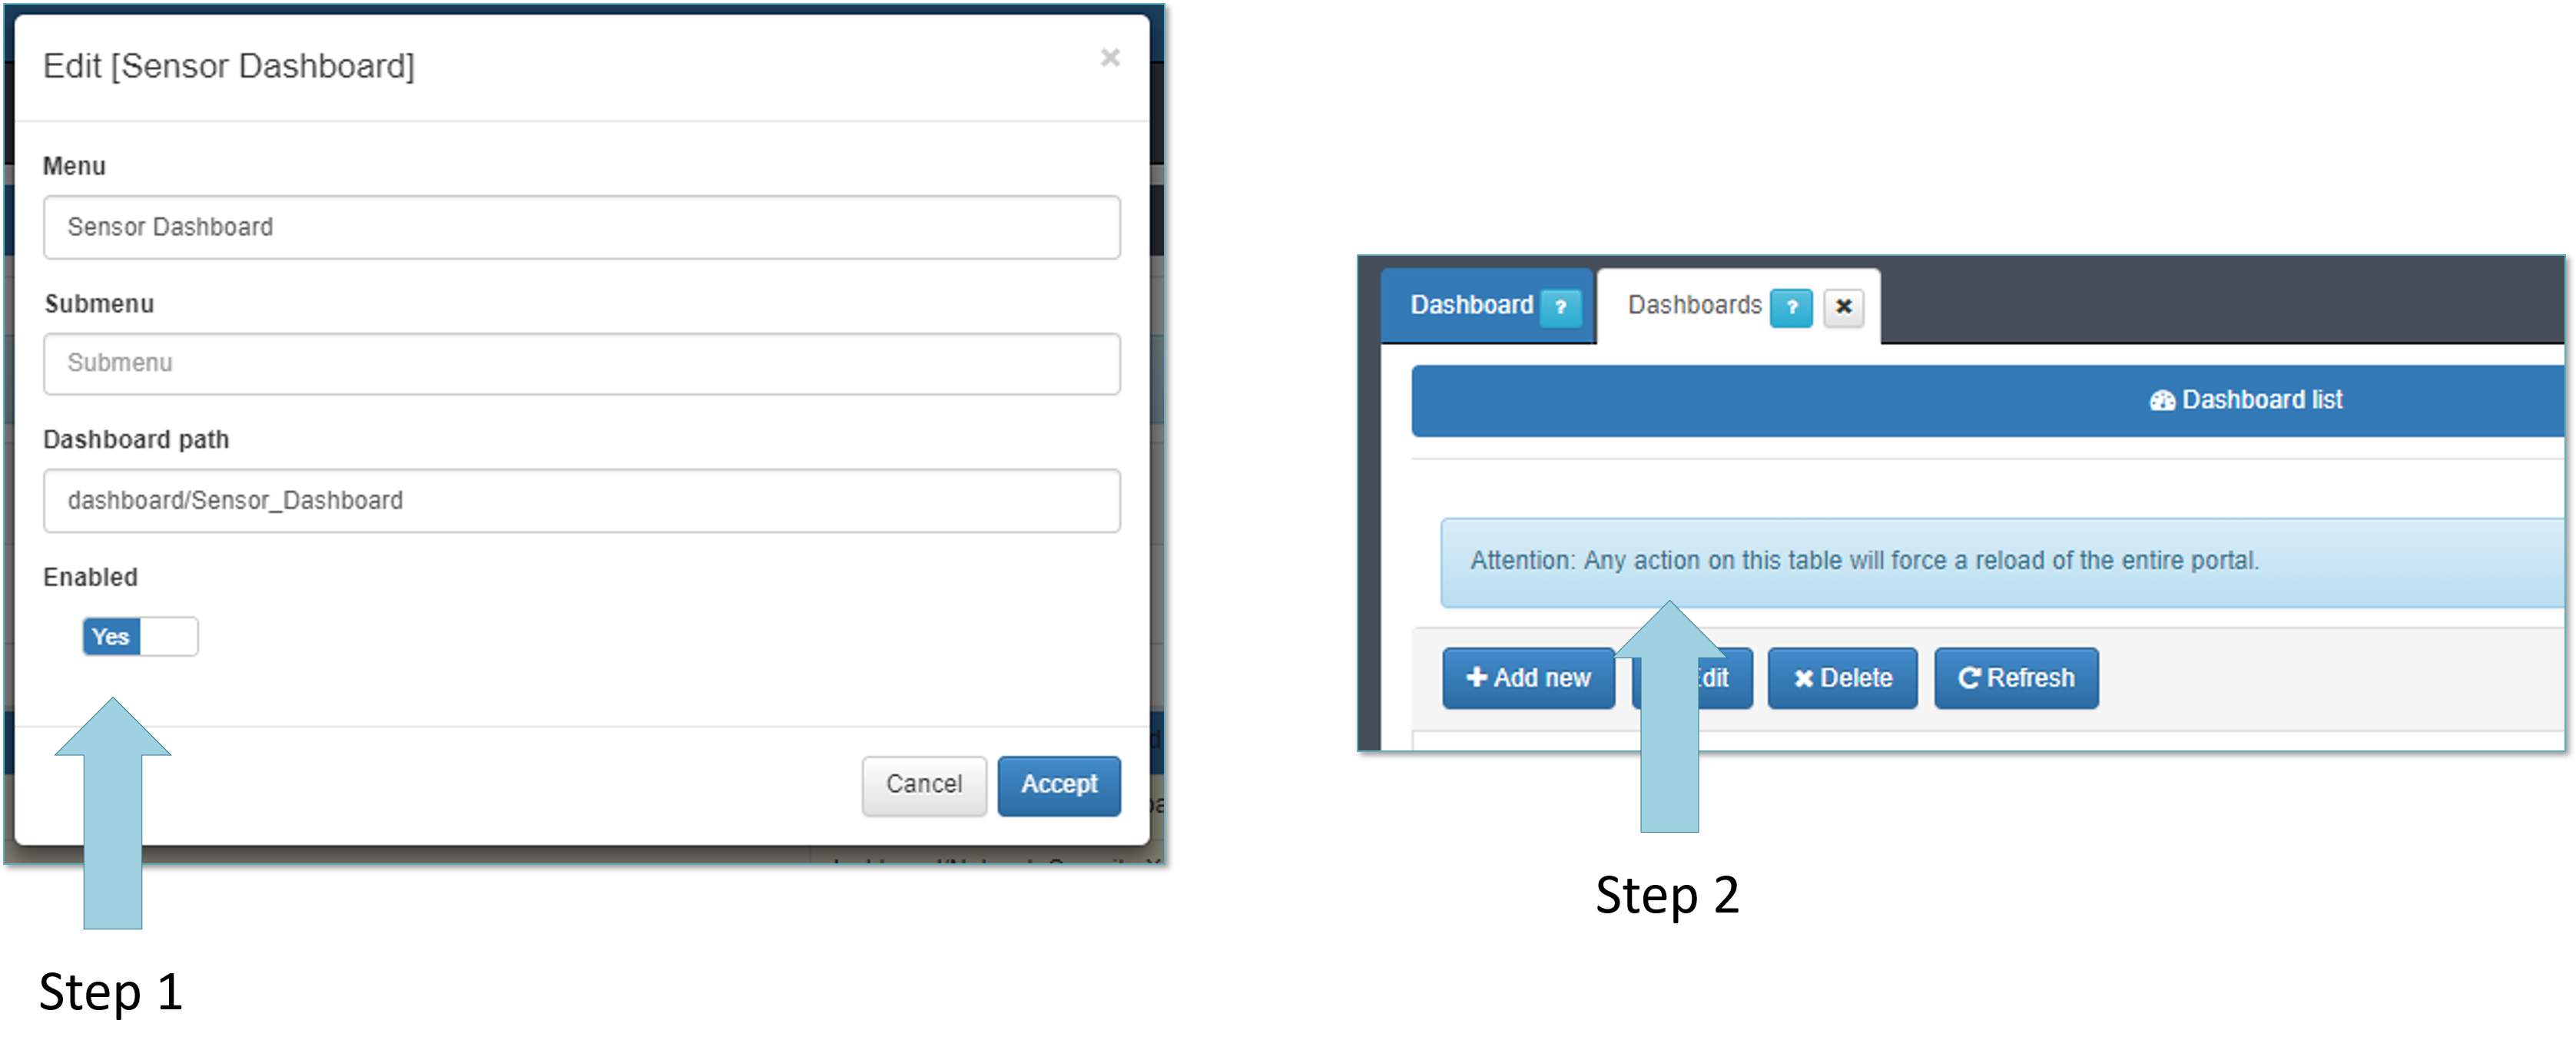
As shown in the Step 1 is possible to enable o disable the dashboard.
Any change on the dashboard list will force to reload the entire portal as notified by Step 2, it only affect to the browsers which re-initialize the user session.
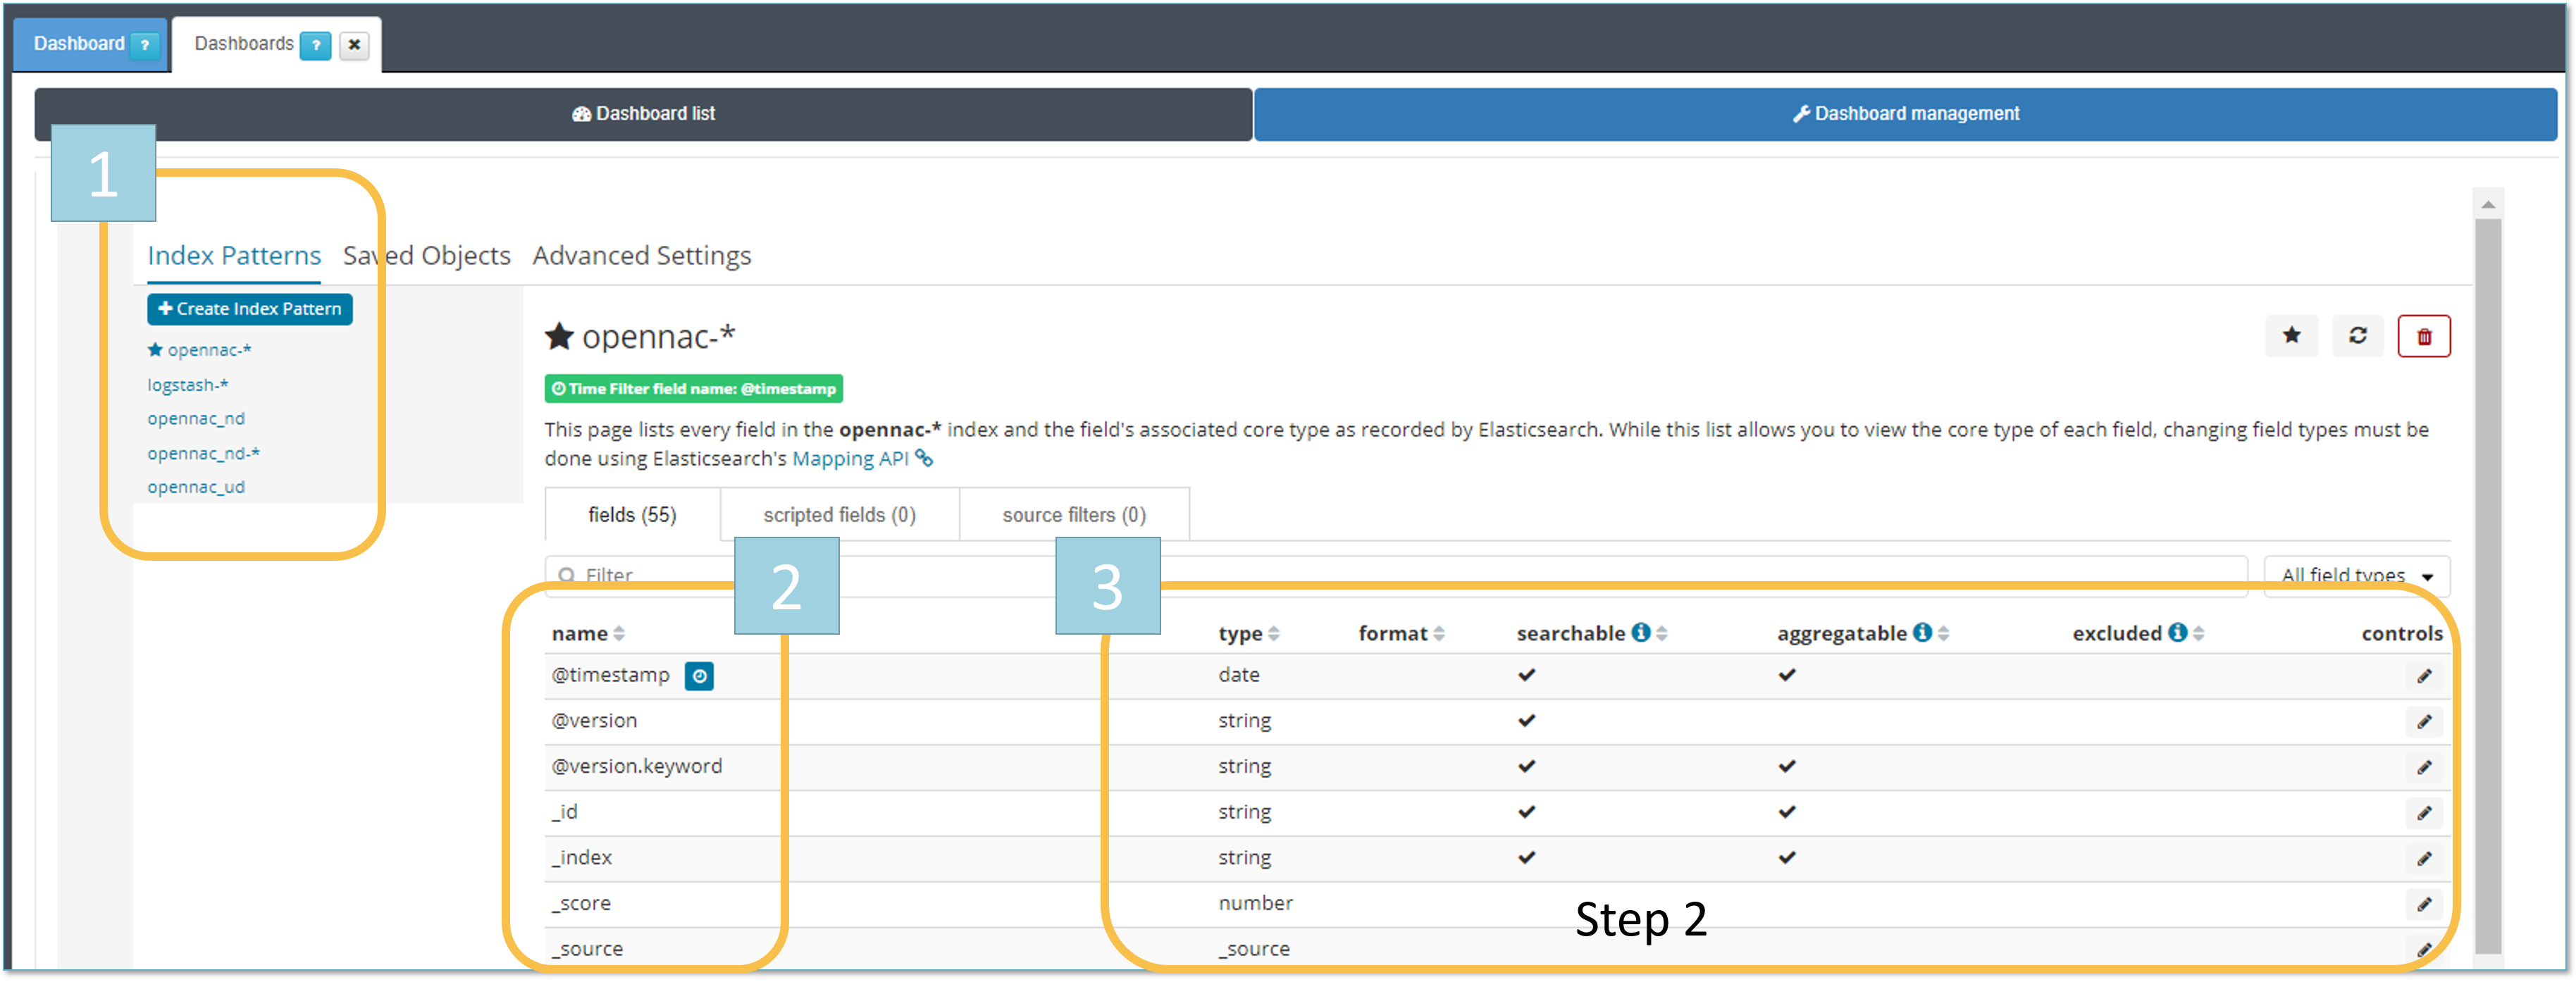
From the Dashboard management tab is possible to review index list as shown by Label 1.
Selecting one index is possible to review the fields associated as shown by Label 2, type of value or if it’s searchable as shown Label 3.
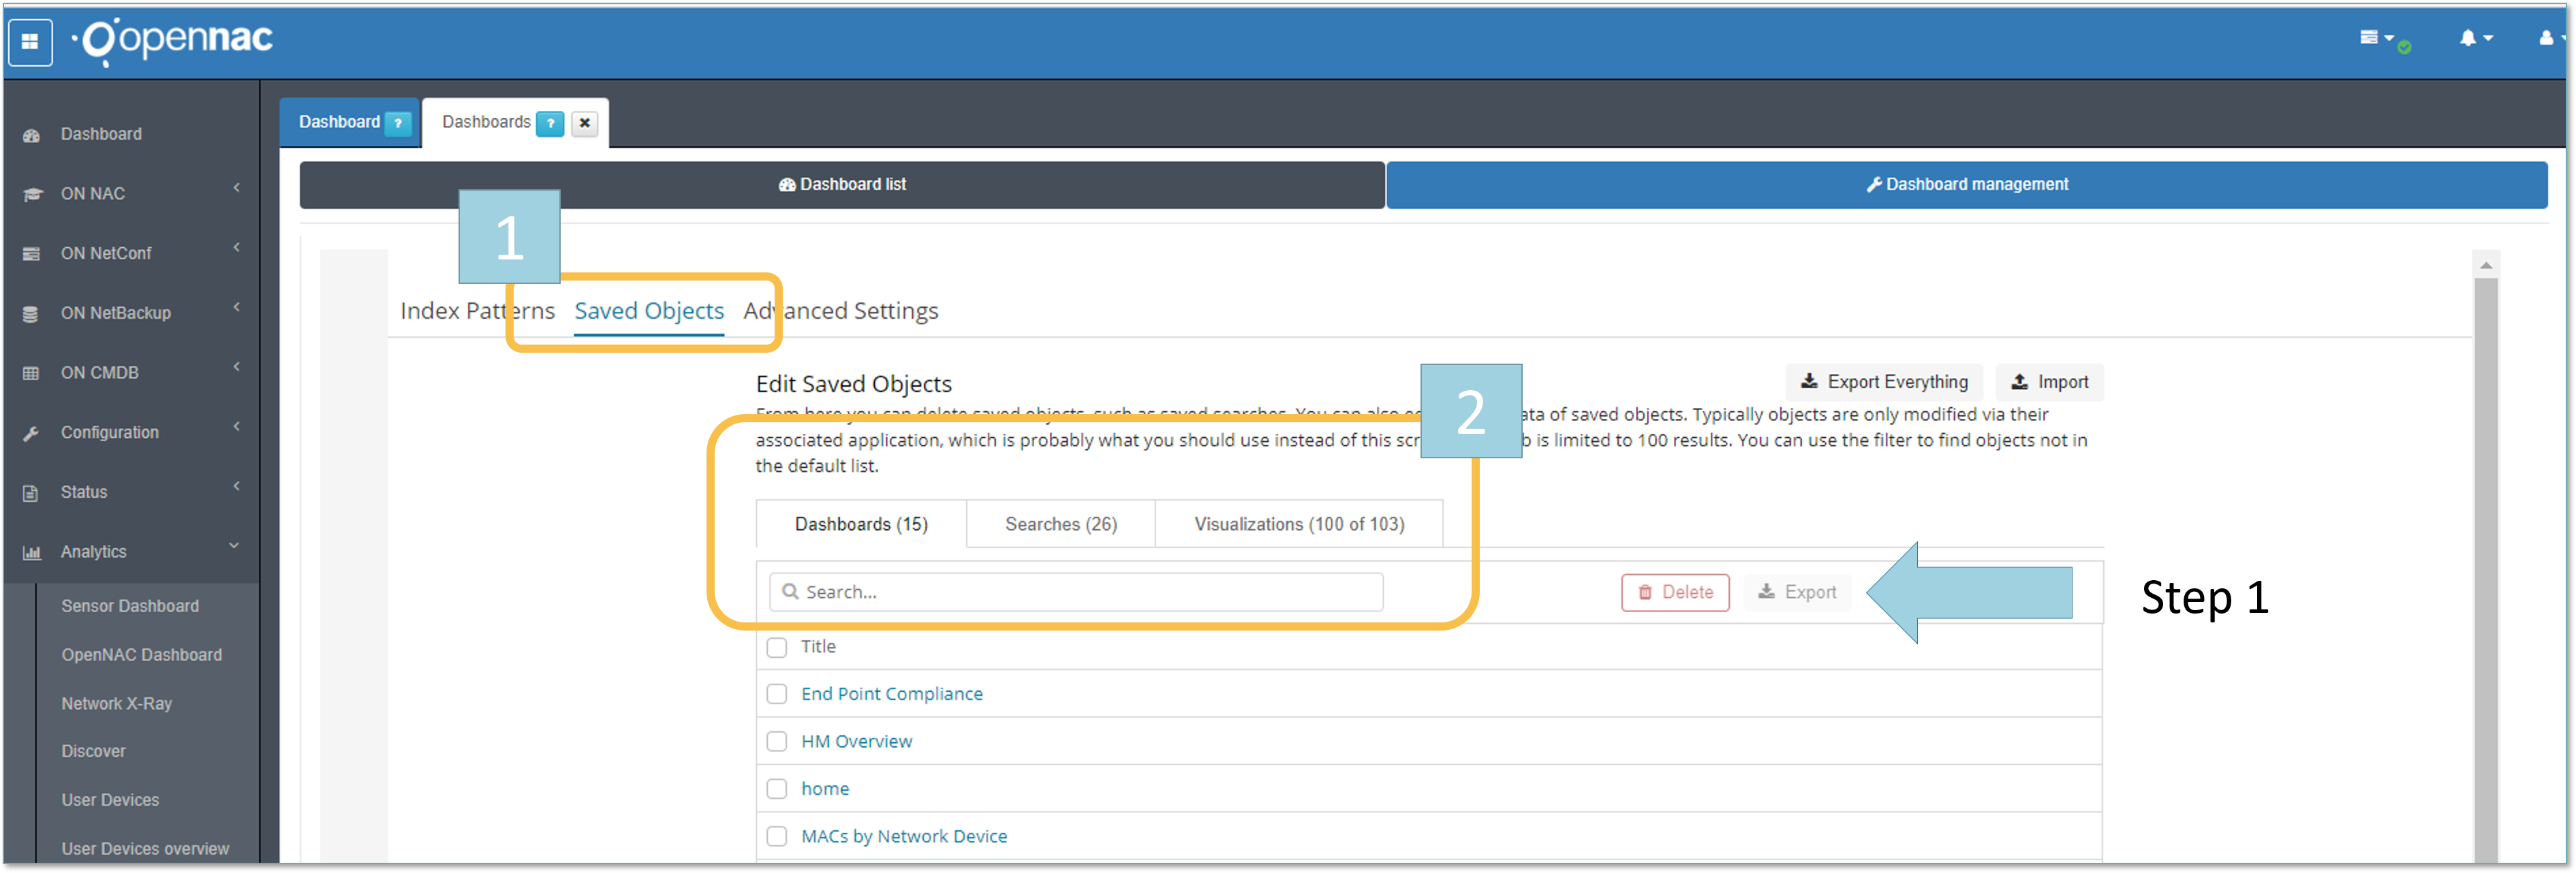
From the Dashboard management tab is possible to manage Saved Object as shown by Label 1.
The main components by the dashboards are Saved objects as shown by Label 2.
- Dashboards: Is where is defined the dashboard itself and where visualization are added.
- Searches: Is where are defined the searches to later visualize it.
- Visualization: Is where is possible to define the type of visualization which later will be added to the dashboard.
To improve automatization is possible to import and export object after its selection as shown by Step 1 in JSON file.
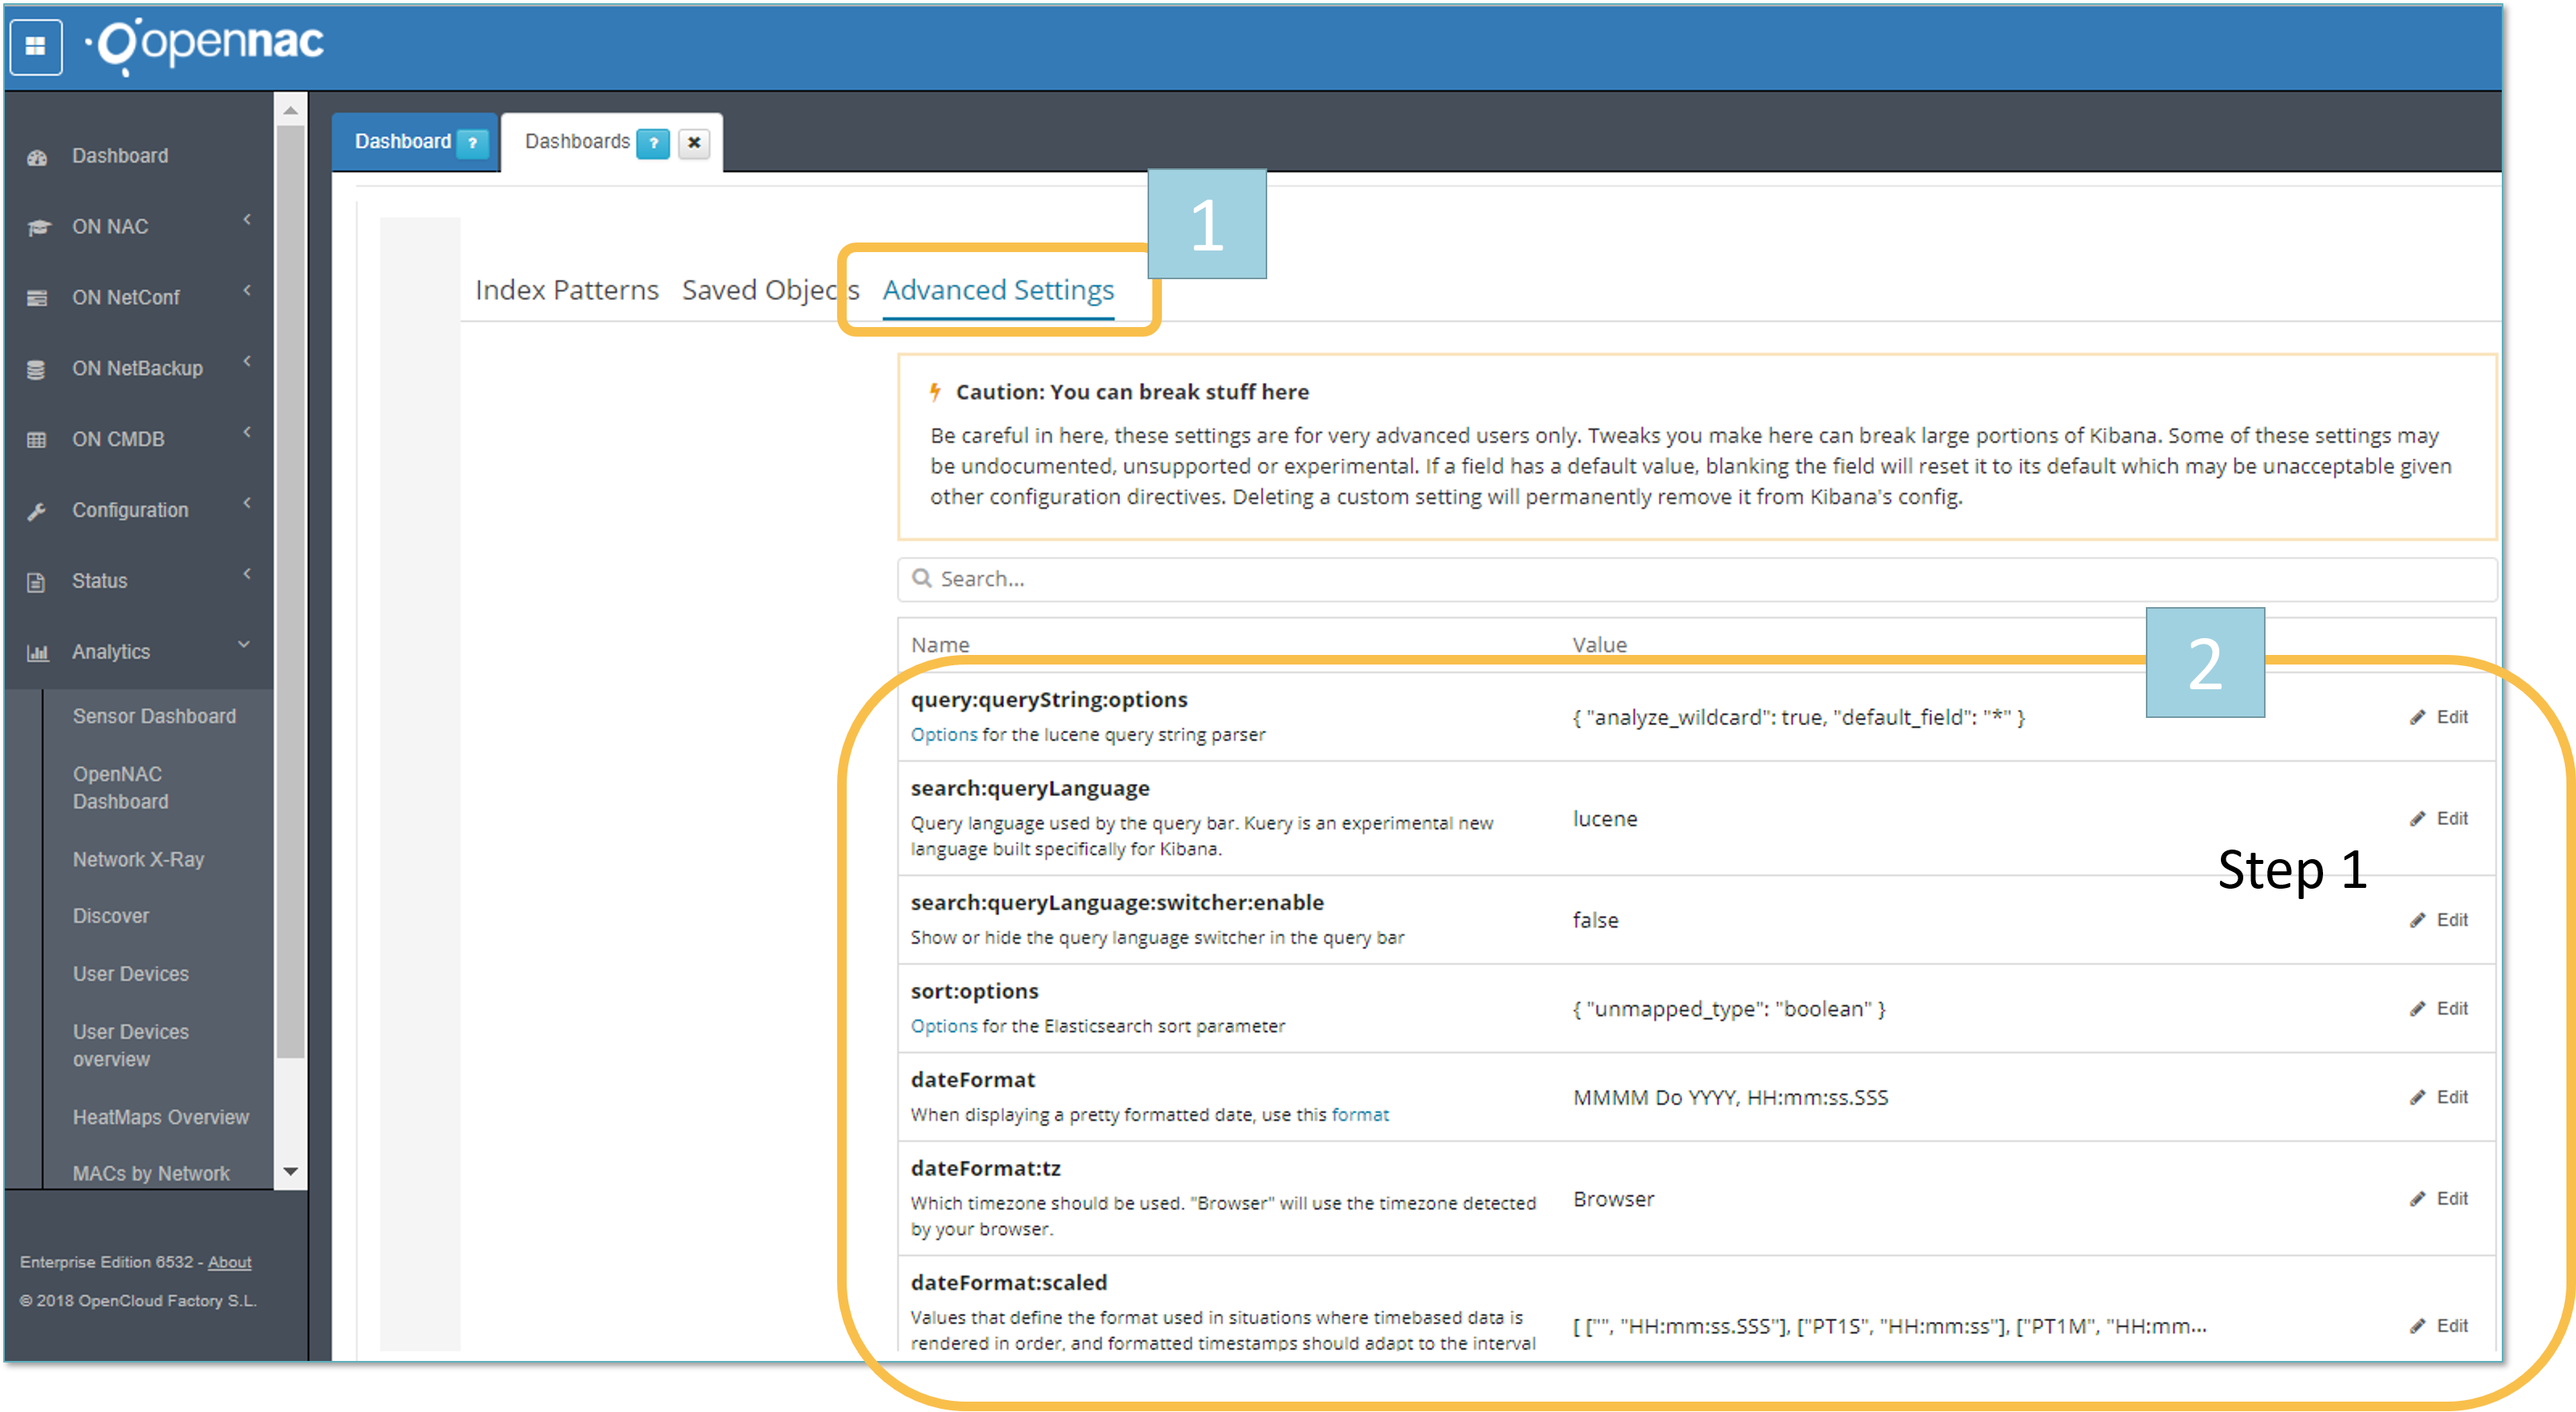
From the Dashboard management tab is possible to manage Advanced Settings as shown by Label 1.
Parameters such as type of query language, date fomat among others things.