4.3.6. Operation
This sections aims to show the workflow of the Segmentation module basic operation.
The Segmentation module allows the user to define a network segmentation and assign assets to segments based on the preconditions defined in the system policy engine (UNAC).
Note
Before proceeding with the operation section, make sure you have completed the administration configurations to prepare the system for basic operations.
The Business Profiles and Policy Evaluation sections enable the performance of the following operation tasks:
Perform policy matching checks.
Verify the correct VLAN association.
Validate plugin execution.
Conduct security profile enforcement checks.
Analyze user device information.
4.3.6.1. Business Profiles
The Business Profiles section provides comprehensive, feature-rich views where you can see the latest status of connections made on the network and detected by the system. For each of these connections, OpenNAC displays information related to the device and the connection itself, such as status, source, policy, and more.
4.3.6.1.1. Default View
The Default View window can display several Profiles, where each one of them can group the connection states depending on the Policy in which they have entered.
Note
You can create as many Business Profiles as you need; there is no limit.
These groups are created to structure and organize these connections in environments where there may be a large number of devices and connections, thus facilitating the queries in this section.
To access the Default View navigate to ON NAC > Business Profiles > Default View.
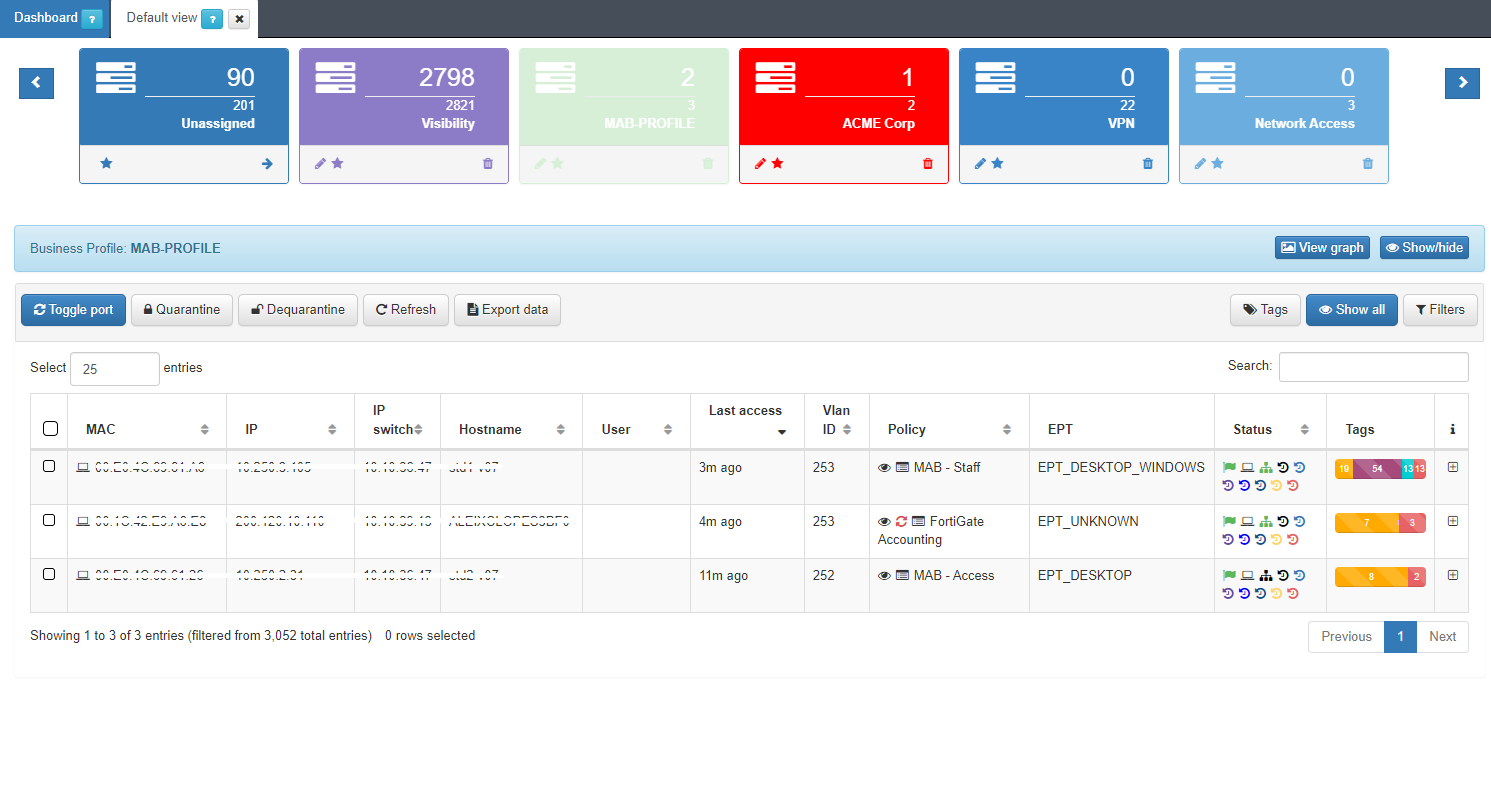
The table displays the details of the latest connections to the network. The information of each connection is grouped in the following columns:
MAC: MAC address of the device.
IP: IP assigned to the device.
IP Switch: IP of the switch to which the device has been connected.
Hostname: Hostname of the device in case it is discovered.
User: User with which the device authenticates.
Last Access: Time elapsed since the last event related to the user.
Policy: Policy with which the device has fallen. (Section 3.1.1)
Vlan: VLAN that has been assigned to the device by evaluating the policies.
Source: Order and type of connection source (802.1x, Visibility, VPN, etc.)
EPT: Tag* referring to the type of device (End Point Type).
Status: Status of the connection (Active/Disconnected, assigned VLAN, etc.).
Tags: Numerical representation of the Tags* assigned to the device.
Tip
Learn all operational capabilities of this view within the Business profiles Overview section.
Expand the information of each connection by clicking on +, located at the right end of each connection row:
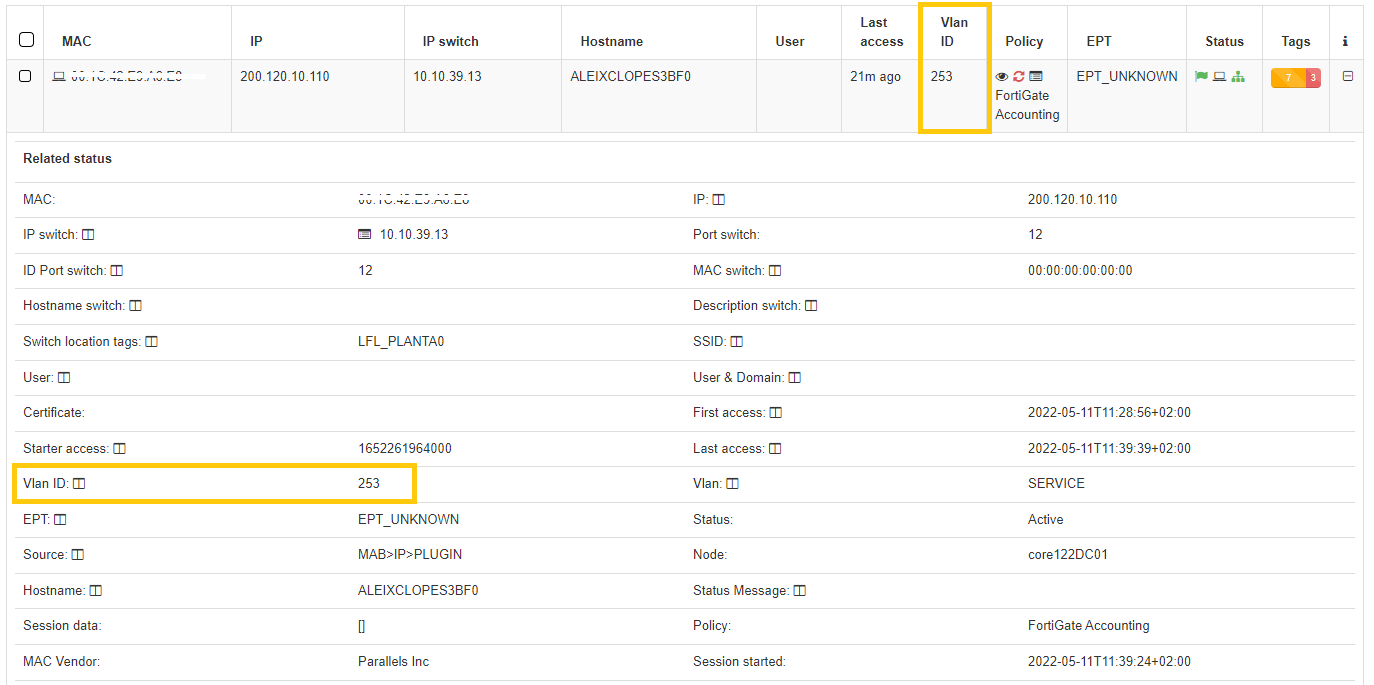
This expanded drop-down includes all relevant information about the devices and the established connections including the VLAN to which the device was assigned.
The upper section presents essential details of the connection, such as MAC address, hostname, user, policy, and connection source.
The lower section showcases the TAGs, which are labels assigned to devices that provide us with additional information. These tags are categorized by families, represented by three letters at the beginning of the tag, followed by an underscore and the specific characteristic. For instance, the tag “ROS_WINDOWS” stands for Root Operating System of the Windows type.
Refer to the Tags Table for a complete list of Tags prefixes and their description.
To enhance the information obtained from devices, you can implement the Visibiliy module, which will provide more detailed insights into the network and its devices.
4.3.6.1.2. Policy evaluation details
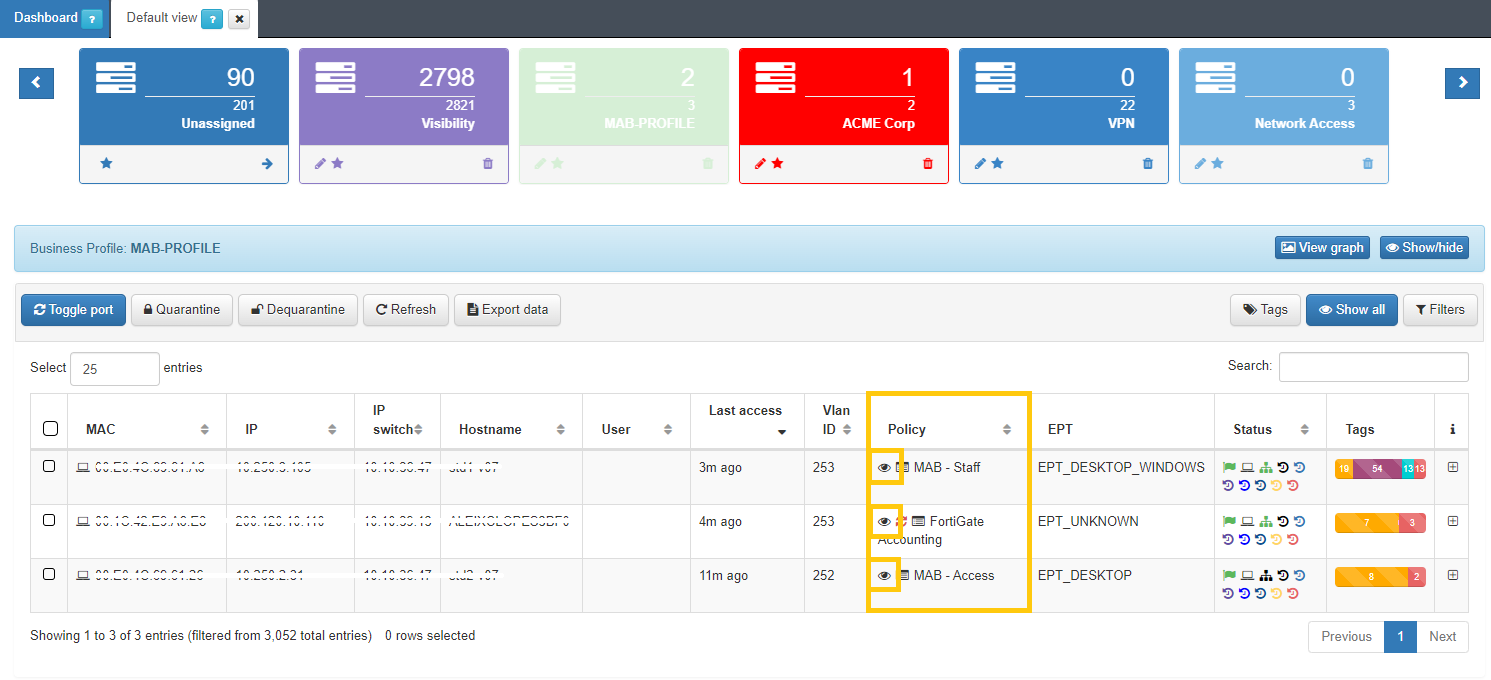
By clicking on the  icon under the “Policy” column of the Business Profiles section, it will display the Policy Evaluation for the events generated in the system.
It will only display the last 10 registered events. The initializing events, that is, those that will cause a policy evaluation (for example, authentication events such as 802.1X or MAB) will appear in blue:
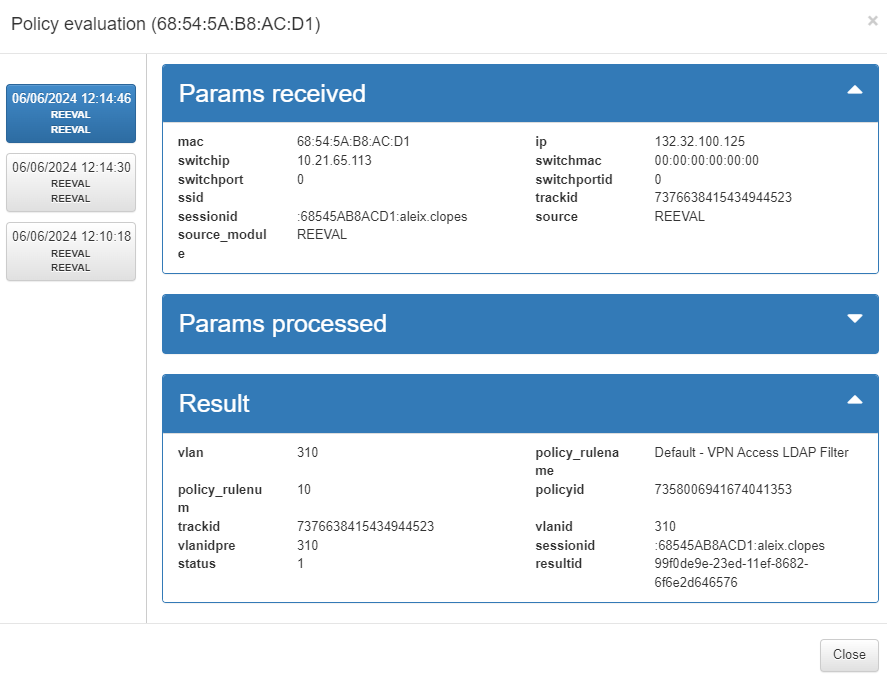
Params received: Parameters that are obtained from the event received in the system. This information includes the MAC of the device (mac), the type of event (source), IP of the switch from which it is received (switchip), etc.
Params processed: These parameters correspond to the information that has been processed by the system and will be stored. This includes information received externally as well as information generated internally, such as device TAGS.
Result: The policy evaluation flow is shown here. Following the order defined in policy creation, the preconditions are evaluated to determine whether or not it should fit the policy. For each evaluated policy, the first precondition that discards it will be shown (in red) until reaching the policy to which it matches. There are events that do not generate a policy evaluation, so this section will not be displayed.
The policy evaluation information helps you understand why a device matched a particular policy and provides visibility into the received parameters, enabling necessary adjustments to the policies. For example, you can use this functionality to check whether the plugin configured on the policy has been executed correctly.
4.3.6.2. CMDB - User Devices
Navigate to ON CMDB > User Devices to access the ON Core database, which stores information related to the system, infrastructure, networks, VLANs, security profiles, user devices, network devices, and more.
In this section, you’ll find all the ‘User Devices’ that have accessed the network. This list includes all devices that have ever connected to the network and been discovered by the system.
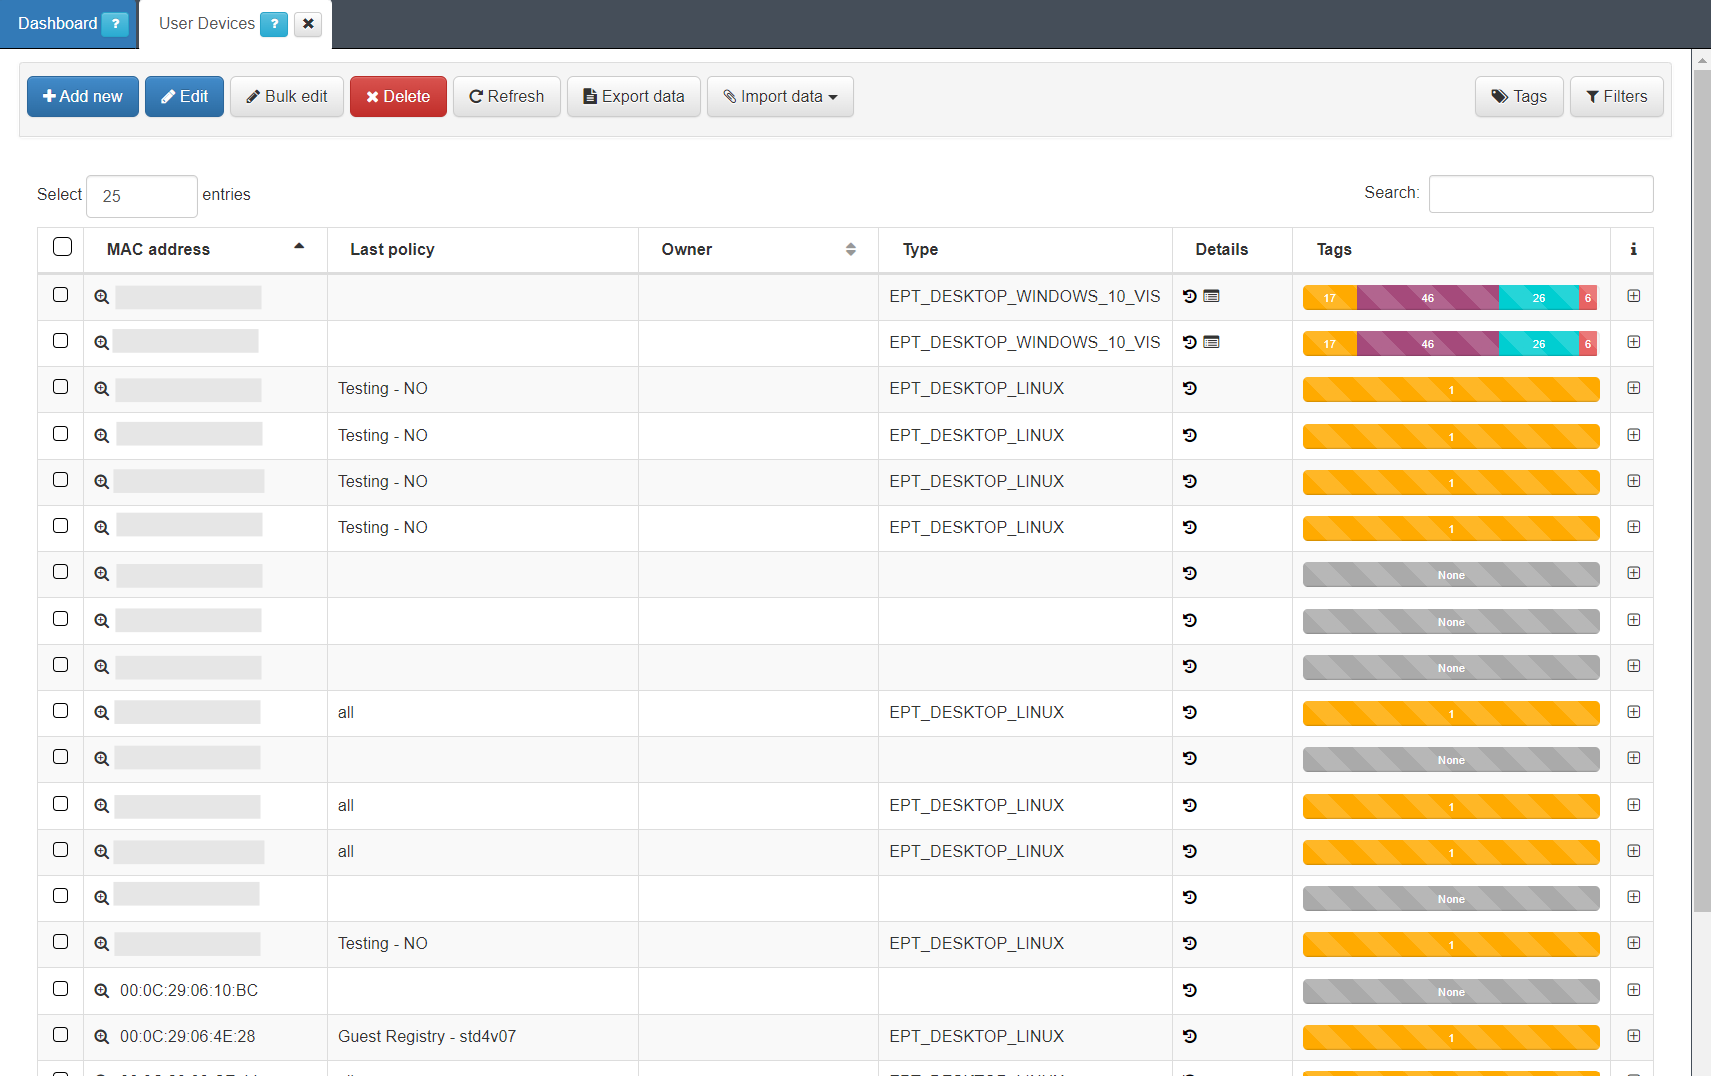
Expand the information for each user device by clicking the + icon at the right end of the device row.
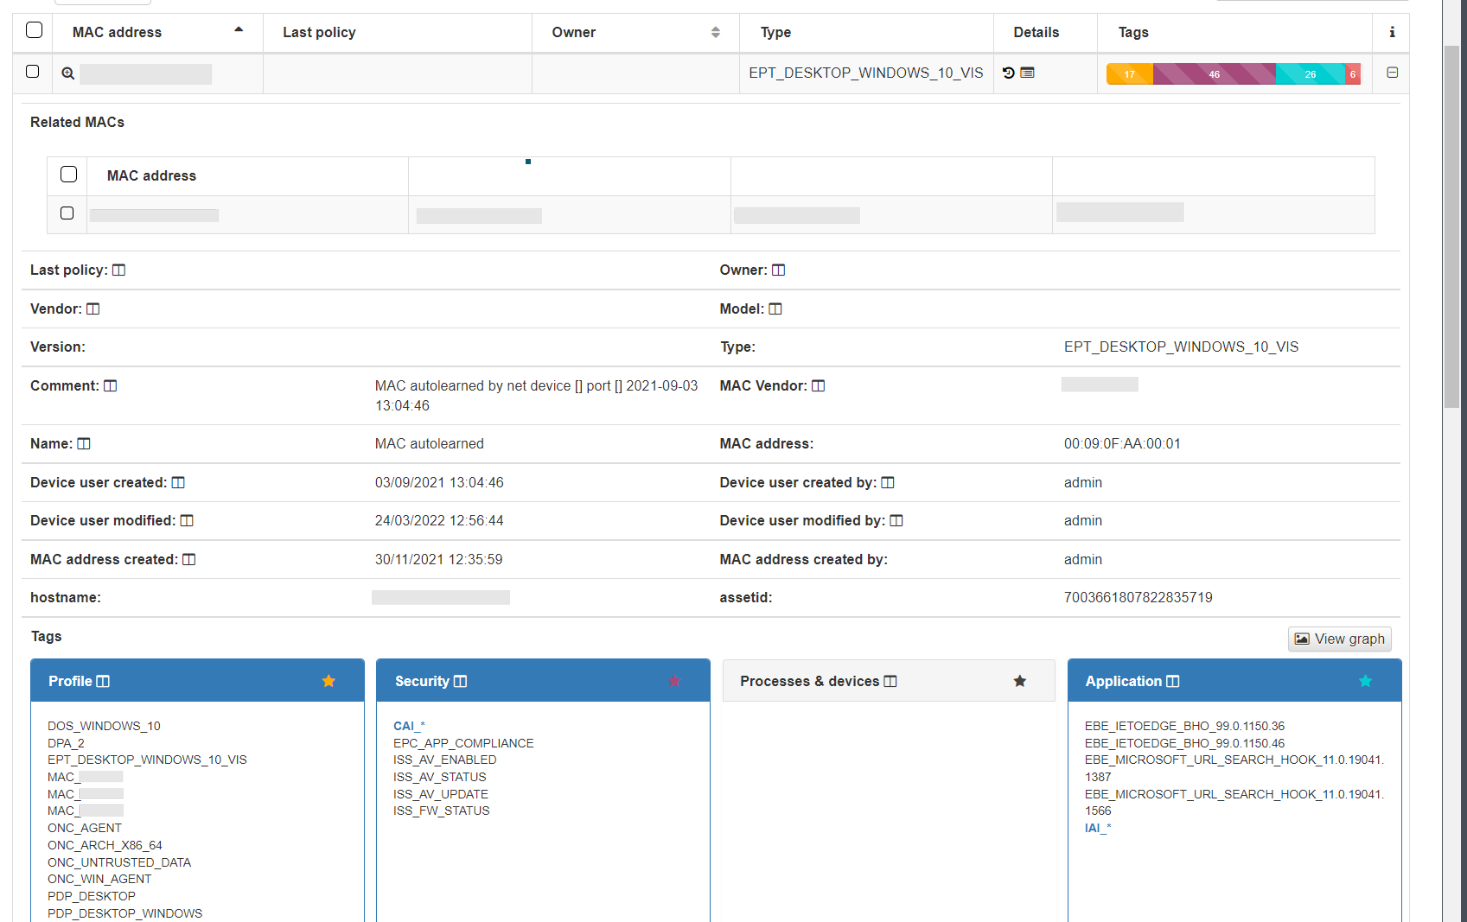
In the dropdown displaying device information, you can view basic details such as MAC address, device type, creation date, hostname, and more. This information is similar to what is available in Business Profiles, but in this case, it only includes details about the device itself, without displaying the connection status. At the bottom, you will find categorized groups showing all the Tags assigned to the device.
4.3.6.3. Security profiles enforcement check
Even with all the information displayed in the Business Profiles and Policy Evaluation views, we cannot verify if the ACLs created or assigned in the policy are accurately applied to the user device or transmitted to the network device for implementation.
To confirm whether they have been correctly applied, you can use the following methods:
Inspect the network device to check whether the ACL configured in the policy has been applied to any of the network device ports.
Use the user device to check if the restrictions have been applied correctly.
Check the RADIUS logs properly transmitted to the network device as RADIUS authorization parameters. For additional assistance, refer to the Troubleshooting section.