11.2.1. Healthcheck Operation
This section provides a guide on how to visualize Instances data in the different views of the Healthcheck Module and monitor their health status.
11.2.1.1. Filtering Data
All views of the Healthcheck Module feature a filtering bar. By exploring it from left to right, you will find two selectors that allow filtering by values associated with fields.
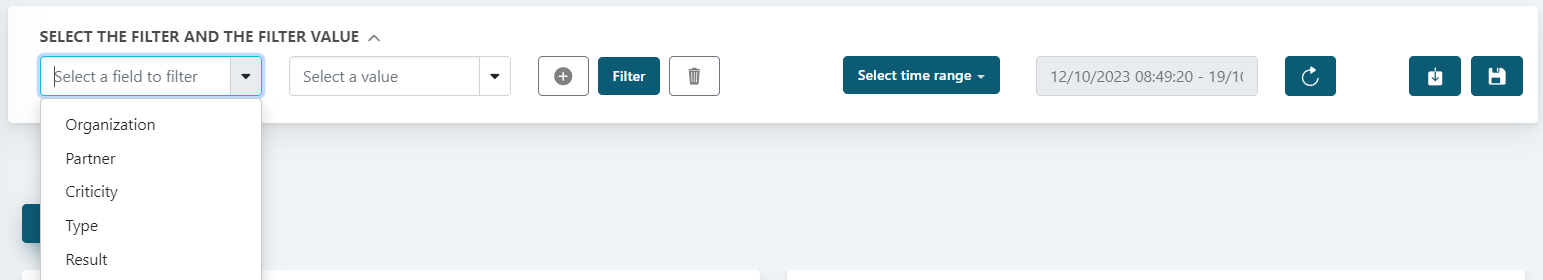
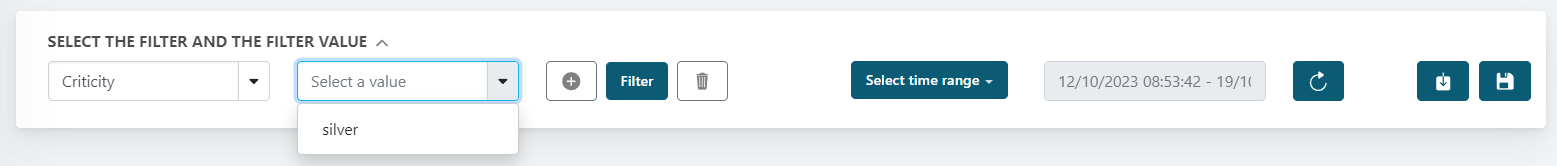
Once you select the field, it will enable the values:
In case you want to filter by more values you can click on the + button and it will display a new filter selector:
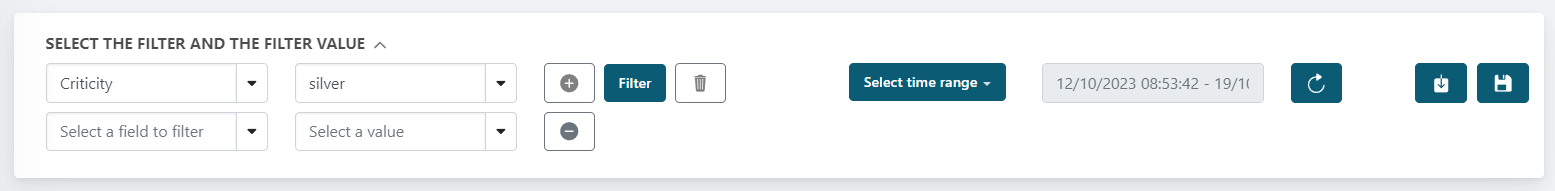
Once you have selected your filters, click on Filter and the dashboards will display the desired results. You can delete a filter by clicking on the bin icon.
Moving to the right side of the filtering bar, you will find a time range selector. This feature will be visible only on dashboards where presenting data in specific time ranges is relevant and meaningful. Click on Select time range to display the following dropdown menu:
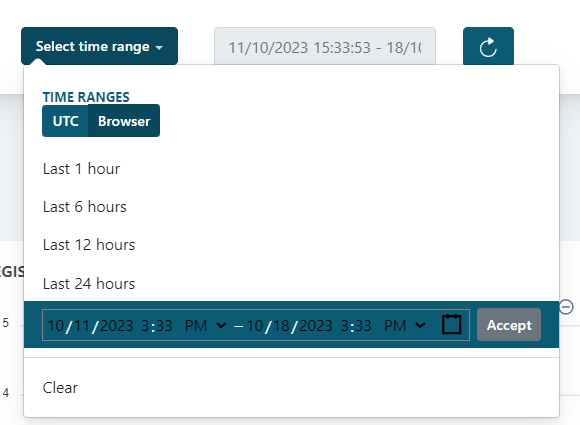
In the dropdown menu, you can decide whether to use UTC or the browser’s time zone, if you want to see data for a relative time range (last 5 minutes, last 12 hours, etc.) or if you want to see an absolute time range, which is selectable in the bottom bar.
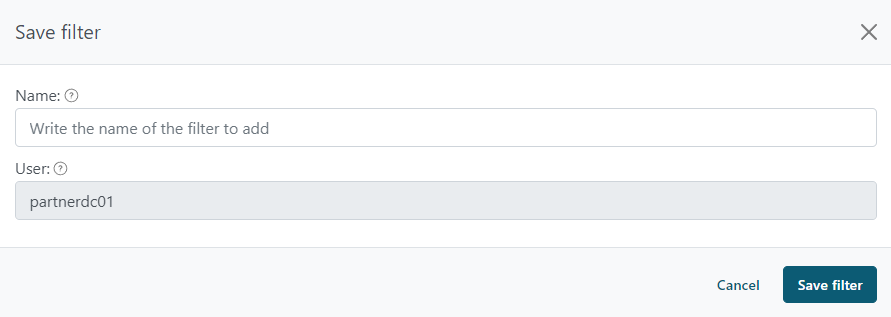
The three remaining buttons allow you to refresh data, load filters and save filters, respectively.

The Save filters button, allows you to save the filter currently in use by giving it a name for posterior identification.
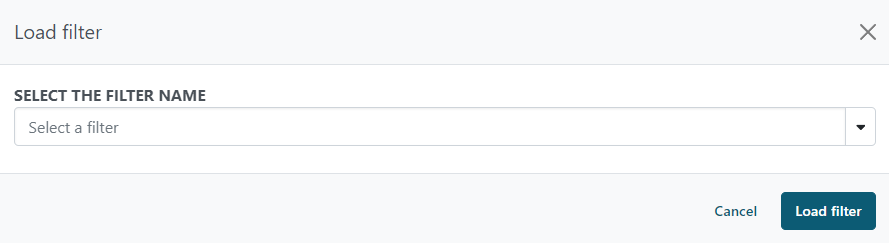
The Load filters button, enables you to choose from your saved filters for immediate use. You also have the option to designate one of your saved filters as the default, ensuring it loads automatically every time the dashboard is accessed.
Each dashboard has its own filters as not all dashboards share the same characteristics.
11.2.1.2. Instances
This sections groups all capabilities related to visualizing instances data, events, and registrations.
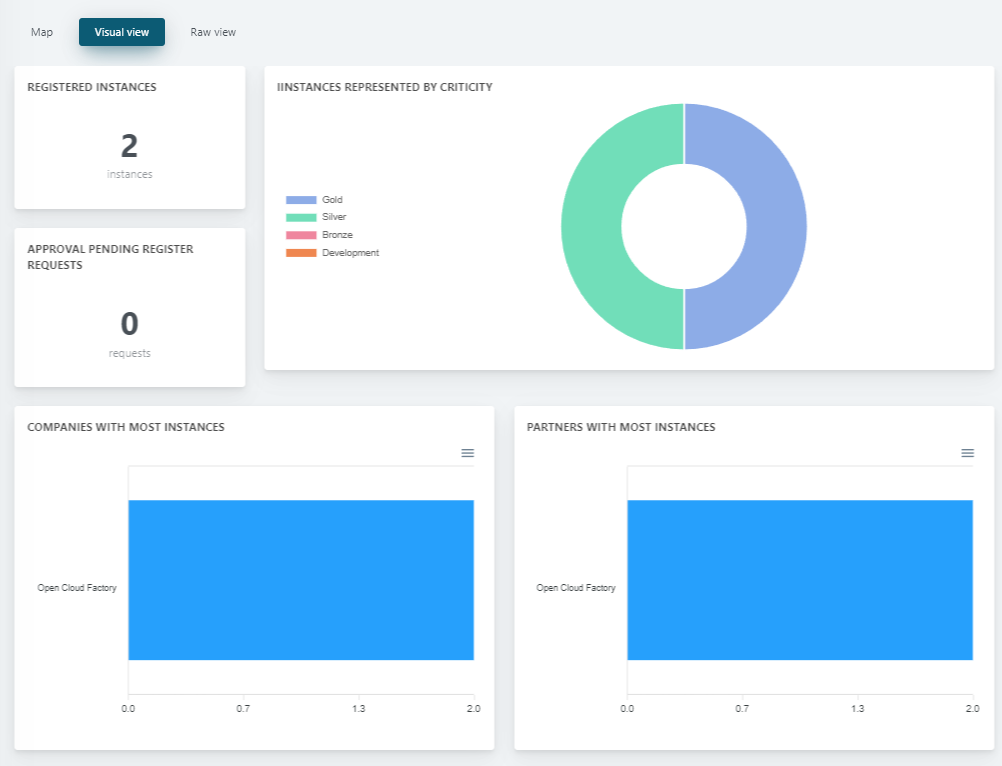
11.2.1.2.1. Registered Instances
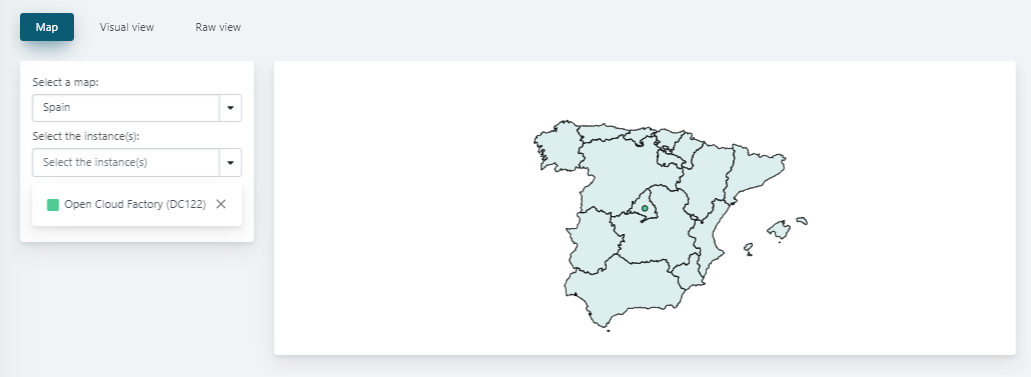
In Registered Instances, you can see information about the instances registered in Elevate, displayed in three views:
Map: Presents a location selector to visualize your instance placed on a map.
Visual view: Presents a comprehensive overview of data using graphics and textual elements, simplifying the information for a quick understanding.
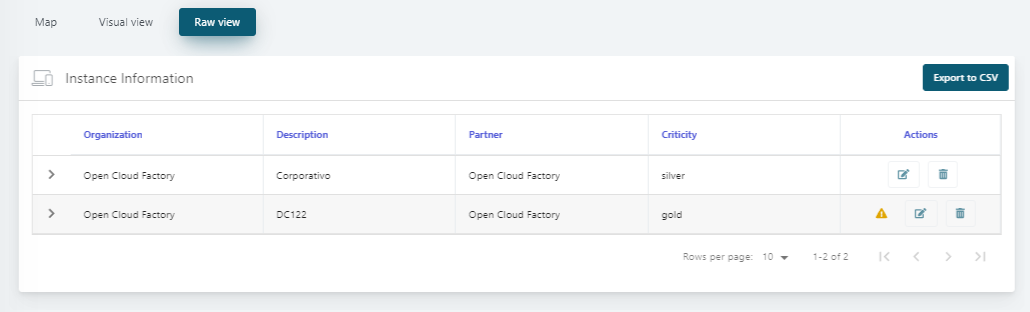
Raw view: Provides a more detailed perspective by displaying complete data in a tabular format. In this alternative view, you not only have the ability to adjust the instance’s partner and criticality but can also execute instance deletion, which will remove all associated data collected for that particular instance.
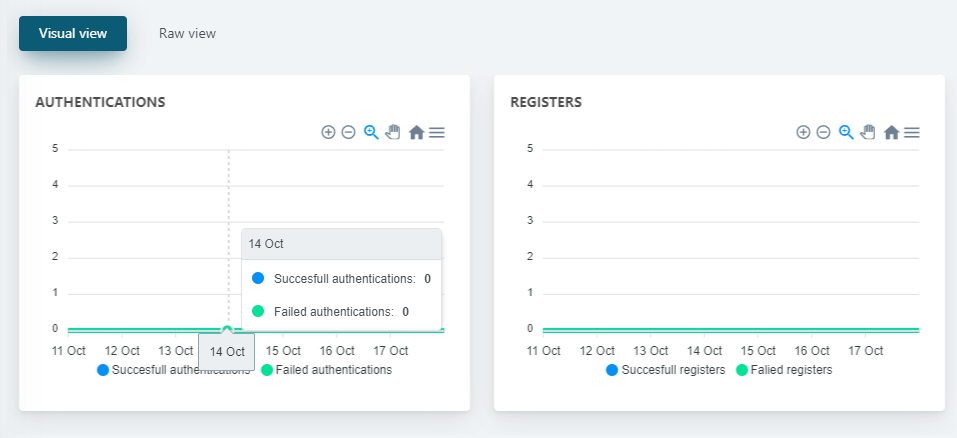
11.2.1.2.2. Events
This section provides information about the events recorded by the OPCC component for each OpenNAC instance. The Elevate system captures events from the OPCC to detect anomalies, which can include:
Failed instance authentication.
Attempts to register without a token.
Lost connections with their respective OpenNAC instances.
and more.
As in Registered Instances, it displays information in different views:
Visual view: Presents a comprehensive overview of data using graphics and textual elements, simplifying the information for a quick understanding.
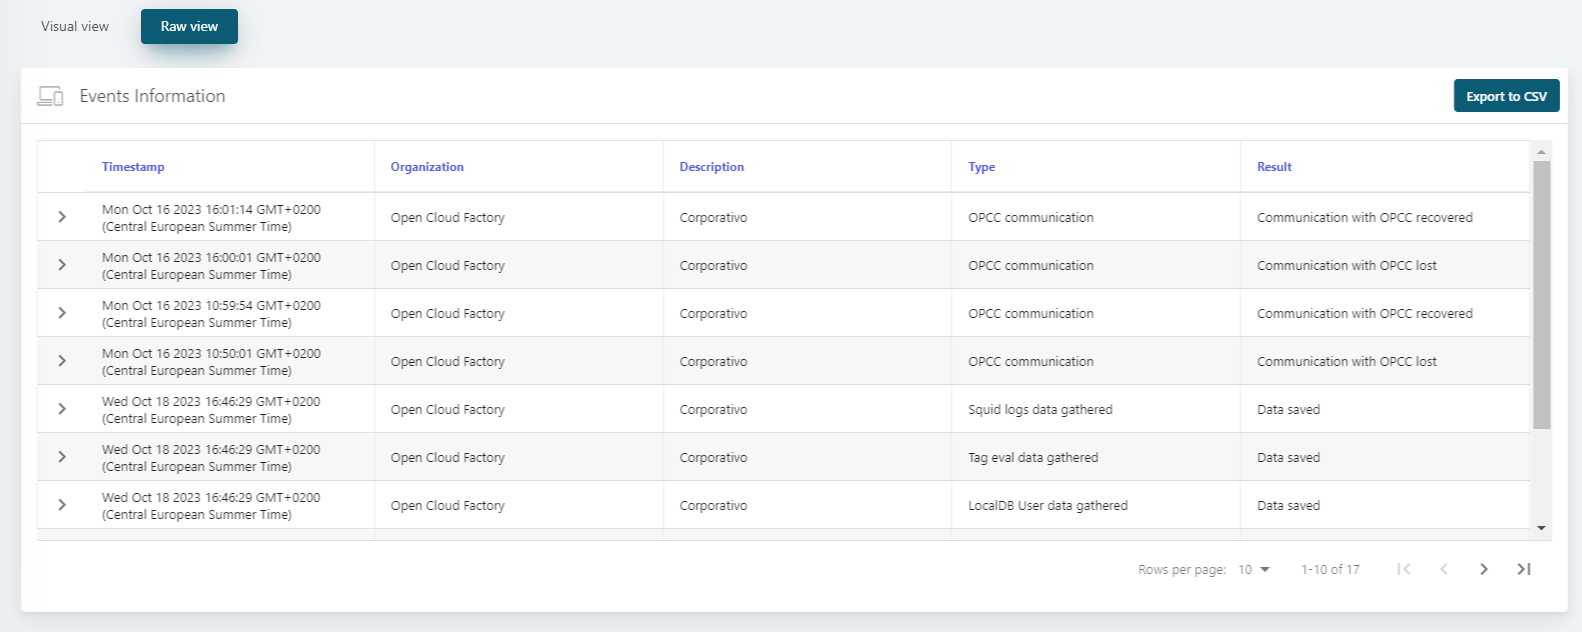
Raw view: Provides a more detailed perspective by displaying complete data in a tabular format.
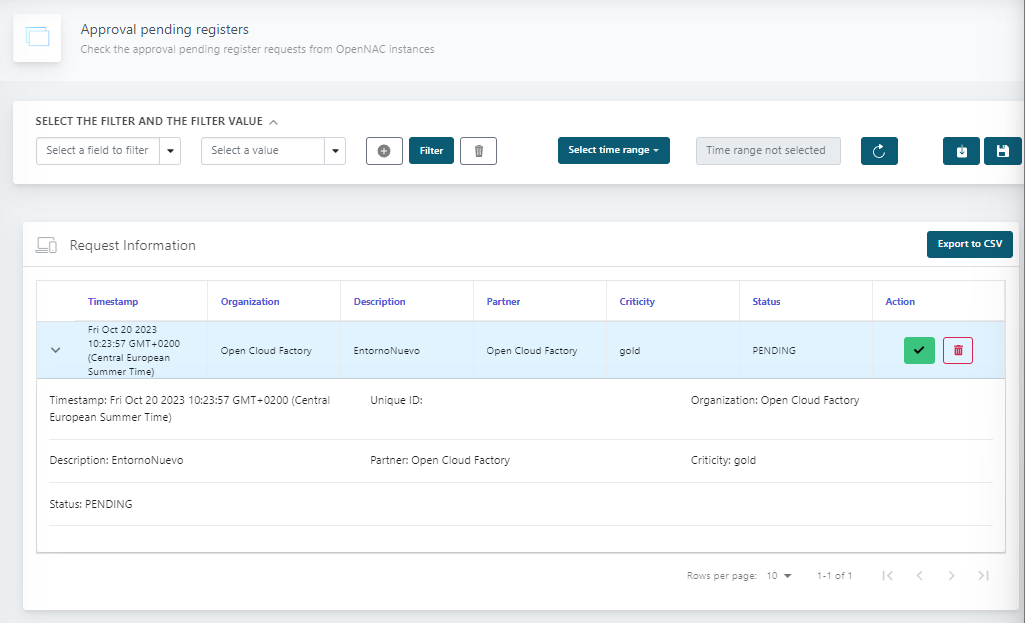
11.2.1.2.3. Pending Registrations
This section displays pending OpenNAC instance registrations. Pending registrations are those that have been registered with Gold criticality, which requires manual acceptance.
When a registration token is created for a Gold instance and this instance is attempted to be registered, a request arrives to Elevate asking for a manual confirmation that the instance should be registered as “Gold”.
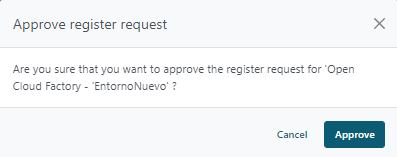
To accept this registration, simply click on the “check” icon.
It will display a pop up window asking for you to confirm this action. Click on Approve to finally approve this instance registration.
11.2.1.3. Monitorization
This section contains information about the health status of OpenNAC components and services. The health status of each component is calculated based on the percentage of services that are running correctly in the component (compliance).
There are two different dashboards, one designed to quickly obtain the health status of the instance (Overview) and another one that allows observing the data in detail (Detailed).
11.2.1.3.1. Overview
In this dashboard, you will find an entry for each instance, accompanied by health status information represented by a “traffic light” system:
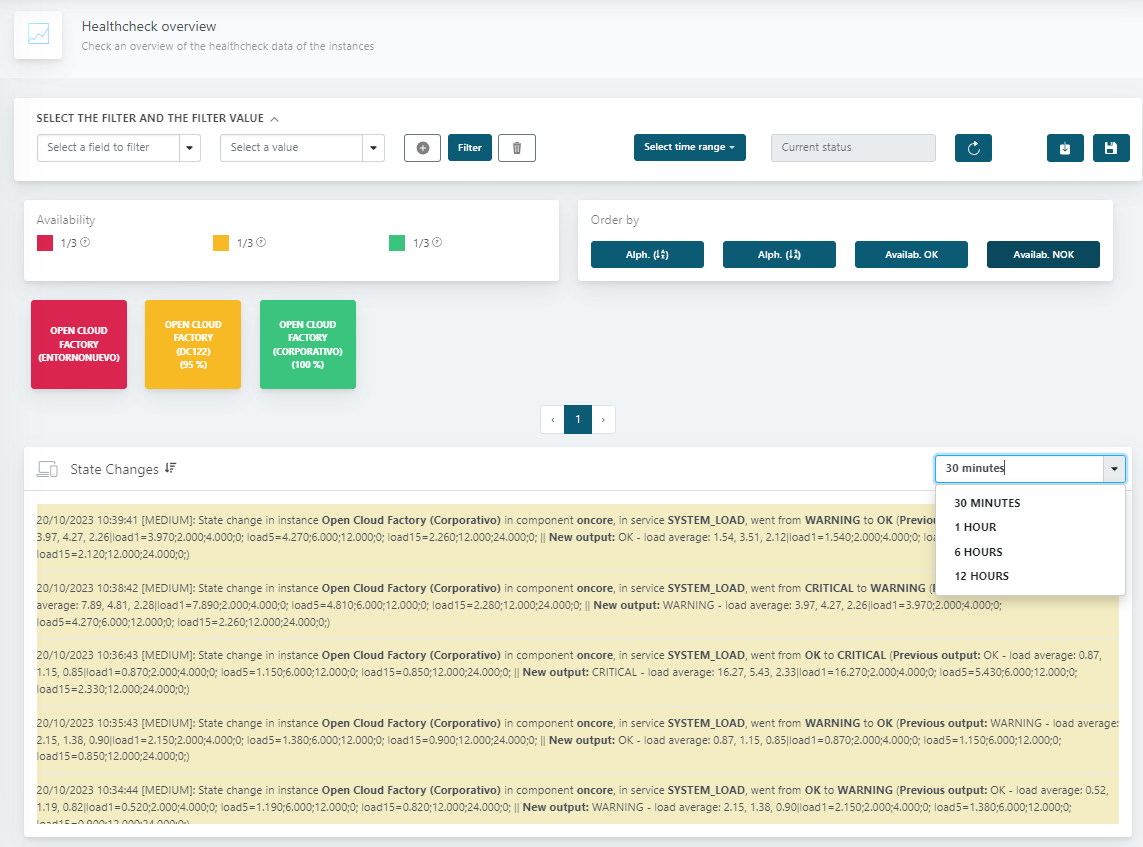
Red color: Indicates instances that have not been reported to Elevate for more than 10 minutes.
Orange color: Indicates instances that are reporting but have certain services not functioning correctly.
Green color: Indicates instances that are operational with all services functioning correctly.
The State Changes section can display the changes that occurred in the last 30 minutes, 1 hour, 6 hours, or 12 hours according to the filter you apply.
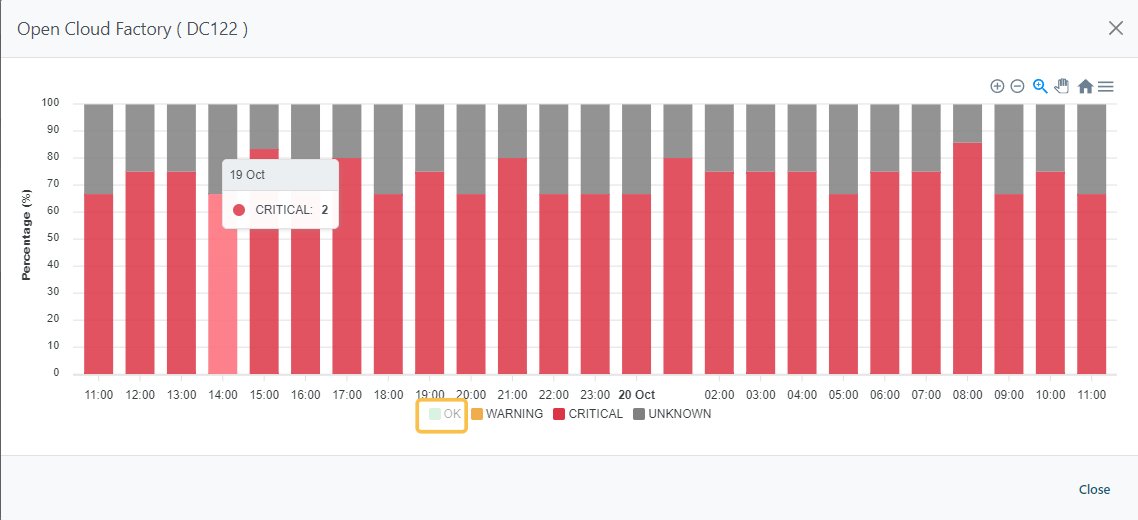
Clicking on any instance will trigger a pop-up window displaying the status of the services within the last 24 hours. It features several capabilities that we will detail below:
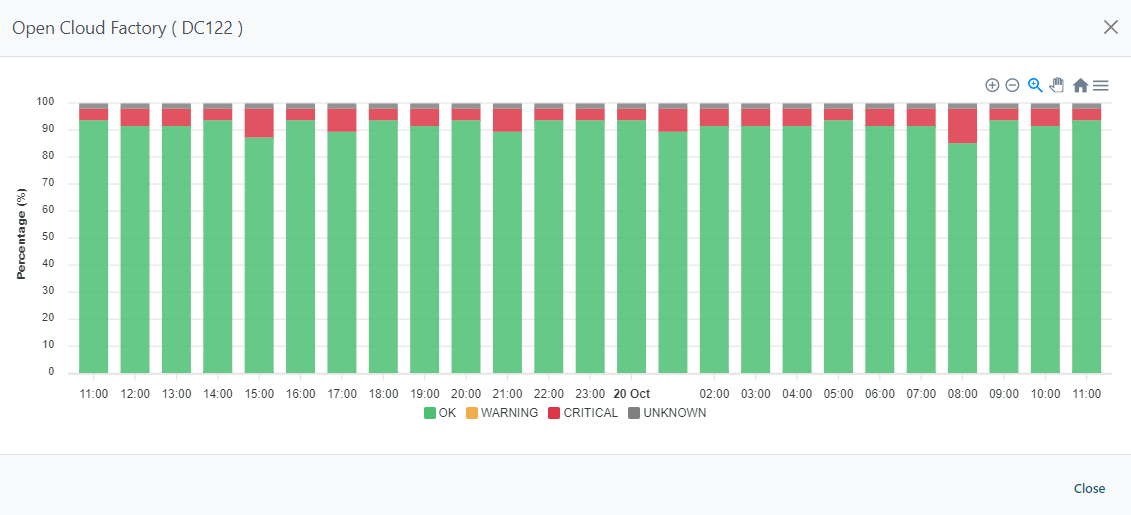
This view also includes the “traffic light” system that works as a filter. You can toggle the display of any status or combination of statuses. In the example below, we have disabled the “OK” status, so the dashboard only shows the remaining statuses for this instance, which are “Critical” and “Unknown”:
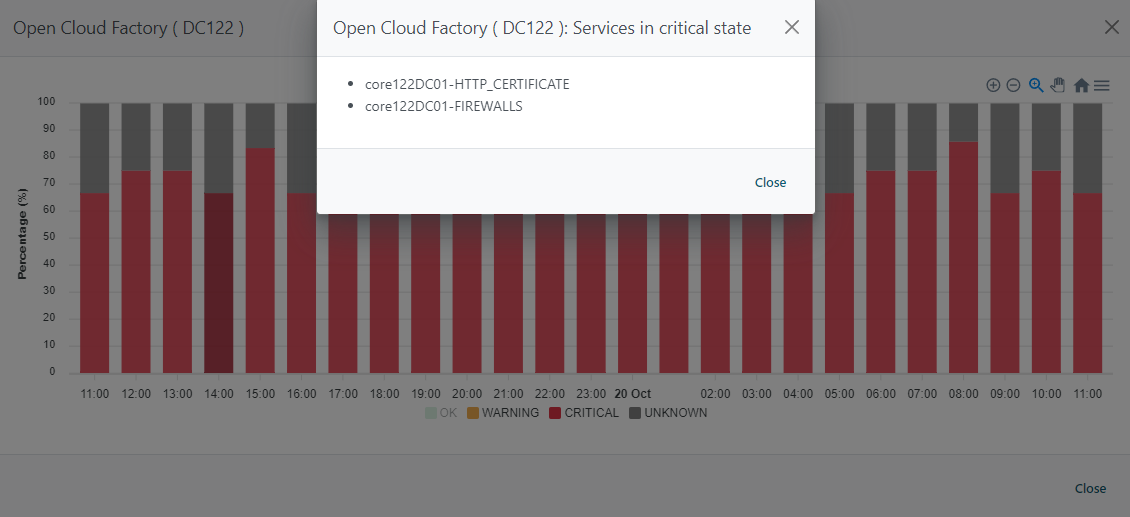
Click on any bar (time range) and it will display the Healthchecks for that status. In the example below, HTTP_CERTIFICATE and FIREWALLS were in a critical state in that specific time range.
Lastly, by clicking on the instance window title, it will lead you to the Detailed section for that specific instance.
11.2.1.3.2. Detailed
In this dashboard, the initial step is to choose the specific instance whose information you wish to view. To do this, select an organization and a description, then click on the Search button:

After selecting an instance, the dashboards will display information on the last 24 hours of activity. You can change the time range by using the Filter bar.
The Detailed healthchecks section features two views: Summary and Detailed.
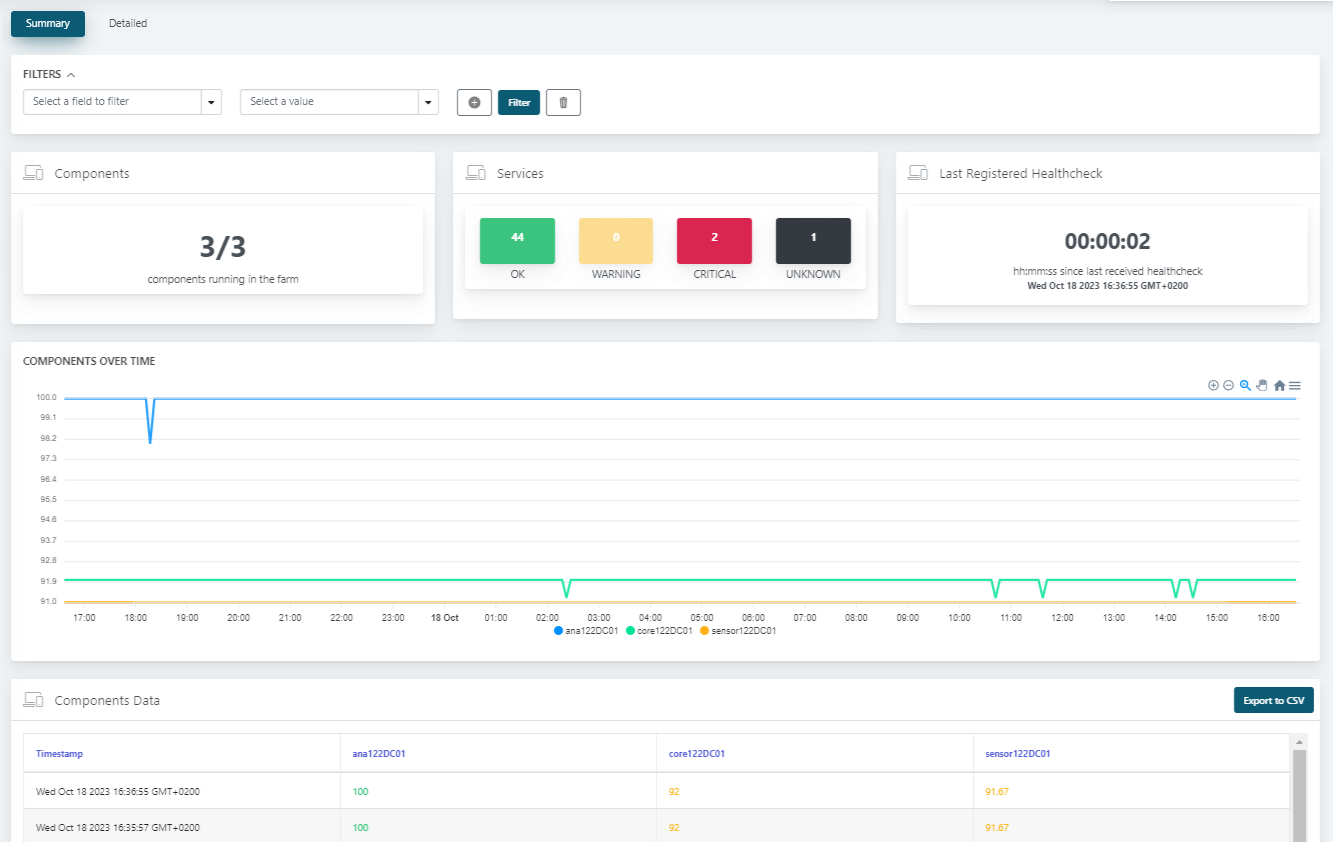
11.2.1.3.2.1. Summary
The Summary view displays the health status of the components, providing insight into the OpenNAC instance’s components, the timing of the last health check, and the historical evolution of each component’s compliance over time.
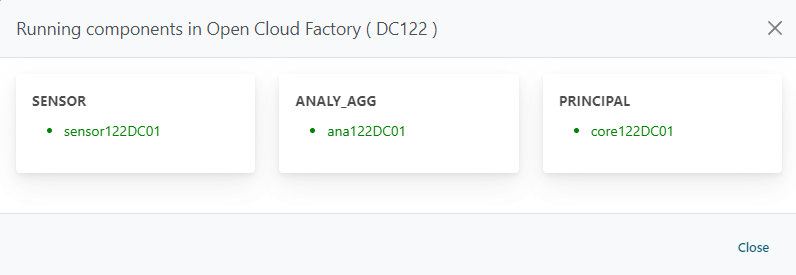
By clicking on the Components section, it will detail the components running on the farm.
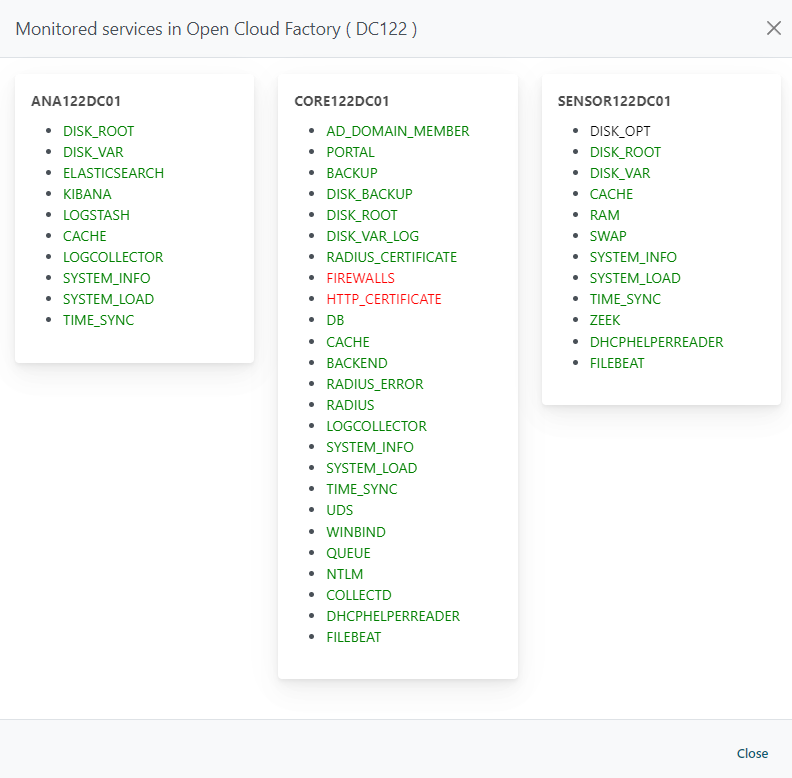
The Services section displays all healthcheck separately. Click on any of them to display a window where you can see the Healthchecks grouped by OpenNAC components:
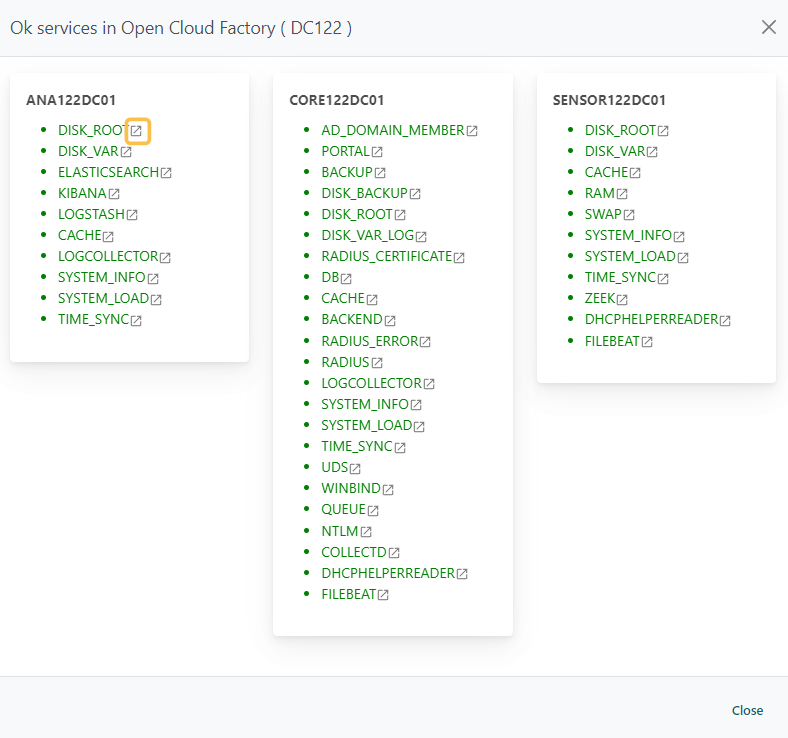
Each healthcheck features a link icon that you can see highlighted in the image above. By clicking on it, you will be taken to the healthcheck documentation page where you can obtain detailed information about that service.
11.2.1.3.2.2. Detailed
The Detailed view offers comprehensive information about each service, allowing you to examine all the services, their respective health status, identify those with the highest failure rates, monitor status changes, and access a detailed history of the health status for each service.
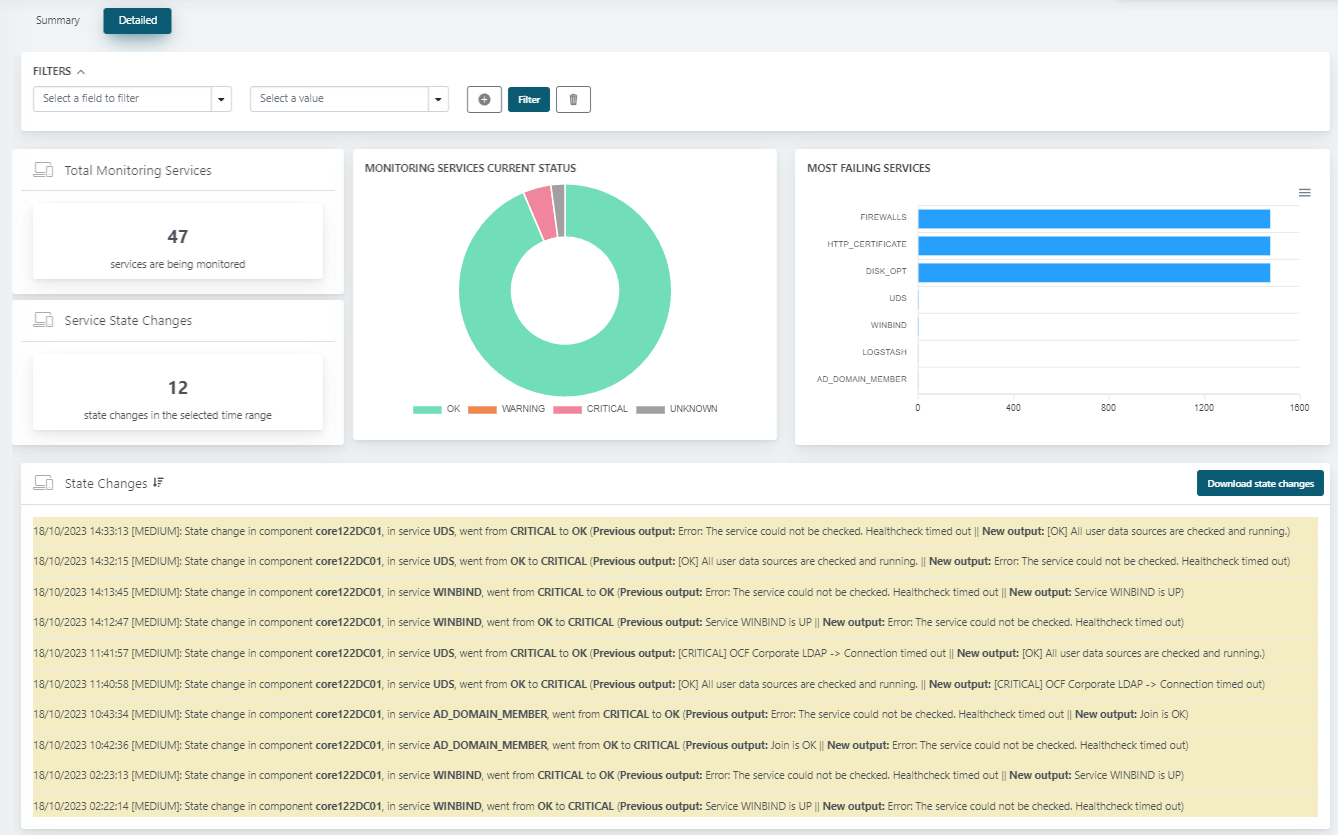
The Total Monitoring Services section displays all healthchecks with a link icon. By clicking on it, you will be taken to the healthcheck documentation page where you can obtain detailed information about that service.