2.6. HA in ELK Cluster
2.6.1. Introduction
In this section, we are going to see how to configure a high availability ELK cluster. Following this guide will ensure data conservation even in the case of losing cluster servers.

2.6.1.1. ELK services
The ELK services that run in our architectures are the following:
Beats: open source data shippers that you install as agents on your servers to send operational data to Elasticsearch. Beats can send data directly to Elasticsearch or via Logstash, where you can further process and enhance the data, before visualizing it in Kibana.
Logstash: open source data collection engine with real-time pipelining capabilities. Logstash can dynamically unify data from disparate sources and normalize the data into destinations of your choice. Cleanse and democratize all your data for diverse advanced downstream analytics and visualization use cases.
Elasticsearch: the distributed search and analytics engine at the heart of the Elastic Stack. Logstash and Beats facilitate collecting, aggregating, and enriching your data and storing it in Elasticsearch.
Kibana: Kibana enables you to give shape to your data and navigate the Elastic Stack. With Kibana, you can:
Search, observe, and protect your data. From discovering documents to analyzing logs to finding security vulnerabilities, Kibana is your portal for accessing these capabilities and more.
Analyses your data. Search for hidden insights, visualize what you’ve found in charts, gauges, maps, graphs, and more, and combine them in a dashboard.
Manage, monitor, and secure the Elastic Stack. Manage your data, monitor the health of your Elastic Stack cluster, and control which users have access to which features.
2.6.1.2. ELK component
Oncore: Provides the administration console, where the policy engine and the compliance rules engine reside. It can take 4 different roles:
Onprincipal
Onsecondary
Onworker
Onproxy
In all the oncore roles the Beats service is running, getting some relevant logs and sending them to Logstash.
Onaggregator: Provides the enrichment of all the information generated by any component of OpenNAC Enterprise. This is provided by Logstash filters, that enrich the logs that arrives from the Beats and send them to Elasticsearch.
Onanalytics: Provides search engine, based on Elasticsearch engine that allows you to easily search the information generated and collected by the OpenNAC Enterprise components. It also provides dashboards and reports using Kibana, that can be accessed from OpenNAC in the Analytics module. You can create and generate your own custom dashboards.
Onsensor: It processes the traffic generated in the network and using Beats sends it to Logstash.
Note
Onaggregator and onanalytics roles can be in the same server, but when we want to have high availability, we need to consider them as two separate servers.
2.6.1.3. ELK flow
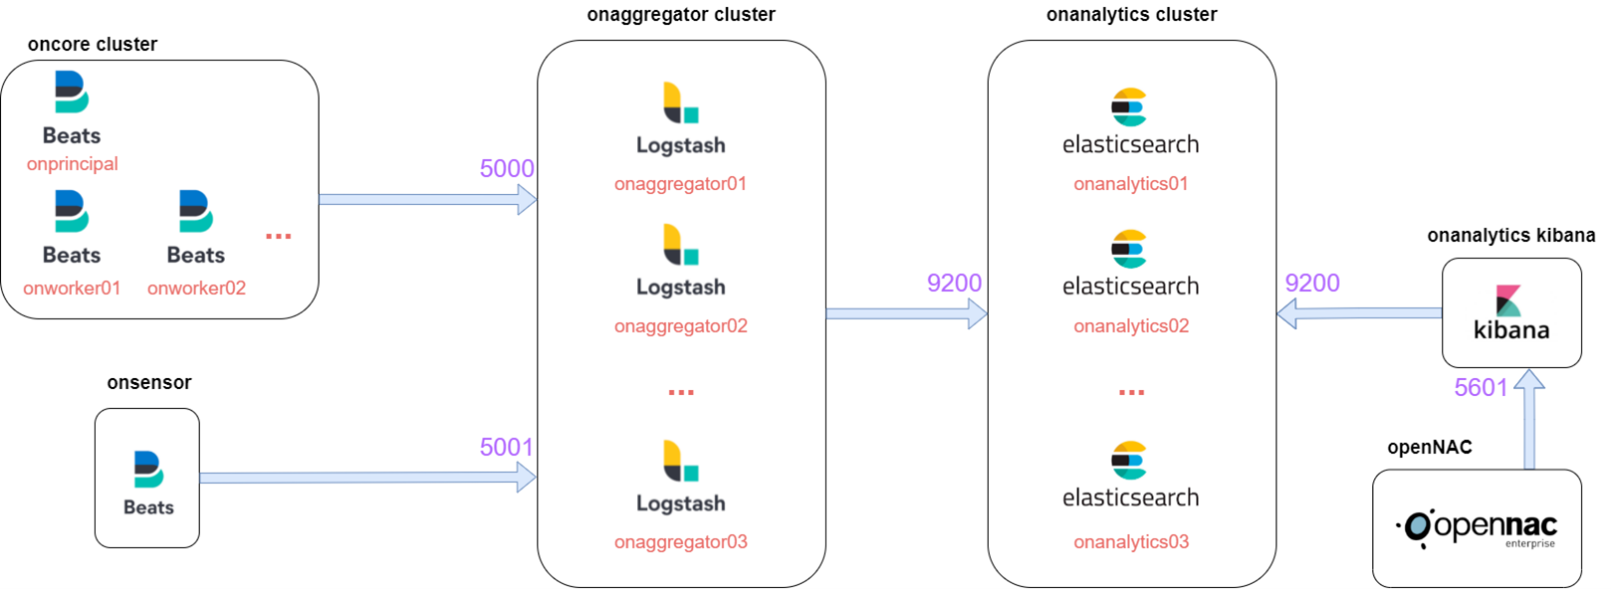
In the architectures with our components, we can find the following flow:

The components of oncore and onsensor contain the Beats, that will send the logs to Logstash situated at onaggregator on the ports 5000 and 5001.
Then, Logstash will enrich the logs and send them to the onanalytics cluster where there is the Elasticsearch cluster on port 9200.
Finally, Kibana connects to Elasticsearch cluster on port 9200 to get the data and provide dashboards, and OpenNAC connects to Kibana on port 5601 to represent the dashboards on its menu.
Note
It is important to keep this flow in mind when performing troubleshooting.
2.6.2. Components /etc/hosts
It is necessary to configure on the /etc/hosts of every component the different IPs associated with their role on the network. To do that, we need to edit the following file:
vi /etc/hosts
Every /etc/hosts needs to have all the network components added in the following format:
####################################################
# Hostname Guide
#
# The following is the structure that must be used
# when defining the different hostnames
#
# ON Core
# * Principal -> onprincipal
#
# ON Core (clustered)
# * Principal -> onprincipal
# * Secondary (Prin. Backup) -> onsecondary
# * Workers -> onworkerNN
# * Proxy -> onproxy
#
# ON Analytics
# * ON Analytics (single) -> onanalytics
# * ON Analytics (multiple) -> onanalyticsNN
#
# ON Aggregator
# * ON Aggregator (single) -> onaggregator
# * ON Aggregator (multiple) -> onaggregatorNN
#
# ON Sensor
# * ON Sensor (single) -> onsensor
# * ON Sensor (multiple) -> onsensorNN
#
# Cloud Deployment
# * <hostname>-<region>-<zone>
# * Example: onprincipal-westus-1
####################################################
It also needs to have the localhost configured for IPv4 and IPv6.
127.0.0.1    localhost localhost.localdomain localhost4 localhost4.localdomain4
::1          localhost localhost.localdomain localhost6 localhost6.localdomain6
127.0.0.1    <component_role>
For example, a onprincipal /etc/hosts should look like the following:
127.0.0.1    localhost localhost.localdomain localhost4 localhost4.localdomain4
::1          localhost localhost.localdomain localhost6 localhost6.localdomain6
127.0.0.1    onprincipal
192.168.69.101    onprincipal oncore
192.168.69.103    onworker
192.168.69.102    onproxy
192.168.69.107    onaggregator
192.168.69.104    onanalytics01
192.168.69.105    onanalytics02
192.168.69.106    onanalytics03
192.168.69.122    onsensor
2.6.3. Beats HA
The Beats service running in oncore and onsensor is Filebeat. Filebeat is configured at oncores clusters and at onsensors to send the logs file that we want to parse to Logstash on onaggregators.
To have HA and load balance the traffic, we need to add the following lines:
In the case of oncore:
output.logstash:
  enabled: true
  hosts: ["onaggregator01:5000","onaggregator02:5000"]
  loadbalance: true
  timeout: 300
  bulk_max_size: 100
In the case of onsensor:
output.logstash:
  enabled: true
  hosts: ["onaggregator01:5001","onaggregator02:5001"]
  loadbalance: true
  timeout: 300
  bulk_max_size: 512
2.6.3.1. Iptables
The are some iptables needed for ELK communication at oncore. We need to edit the file:
vi /etc/sysconfig/iptables
Logstash filters, make some Redis requests to the oncore for enrich with OpenNAC Enterprise information some logs. That is why we need to allow the access to oncores Redis for all the onaggregators in the network.
-A INPUT -s <onaggregatorXX_ip> -p tcp -m state --state NEW -m tcp --dport 6379 -j ACCEPT
It is necessary to restart the following services:
systemctl restart iptables
2.6.4. Logstash HA
The Logstash service operates within the onaggregator component, where it plays a crucial role in receiving data logs from Beats. Its primary functions include filtering and enriching these logs before forwarding them to Elasticsearch for storage.
In the /etc/logstash/conf.d/999_output.conf file, you will see that by default, all Elasticsearch output plugins in Logstash are configured to send information exclusively to a specific onanalytics instance.
elasticsearch {
    hosts => ["onanalytics:9200”]
    index => "radius-%{+YYYY.MM.dd}"
}
To configure the HA and load balance the output sent to Elasticsearch, it’s necessary to add all the onanalytics that we want to load balance.
elasticsearch {
    hosts => ["onanalytics01:9200","onanalytics02:9200"]
    index => "radius-%{+YYYY.MM.dd}"
}
For doing that automatically, change the variable OPENNAC_ES_HOSTS.
vi /etc/default/opennac
Add all the different onanalytics with the specified format:
#This parameter is only used on packet updates. The format for multiple hosts is '"onanalytics01:9200","onanalytics02:9200","etc"'
OPENNAC_ES_HOSTS='"onanalytics01:9200","onanalytics02:9200"'
To change the new configuration in the logstash file, execute the following command:
yes | cp /usr/share/opennac/aggregator/logstash/conf.d/999_output.conf /etc/logstash/conf.d/999_output.conf
eshosts=$(grep OPENNAC_ES_HOSTS /etc/default/opennac | awk -F"=" '{print $2}' | sed "s_'__g")
sed -i "s/#OPENNAC_ES_HOSTS#/${eshosts}/" /etc/logstash/conf.d/*.conf
Finally, restart the logstash service:
systemctl restart logstash
2.6.4.1. Iptables
The are some iptables needed for ELK communication at onaggregator. We need to edit the file:
vi /etc/sysconfig/iptables
The different Beats on the network will access Logstash on ports 5000 and 5001. So, it is necessary to add the following lines
-A INPUT -s <oncoreXX_ip> -p tcp -m state --state NEW -m tcp --dport 5000 -j ACCEPT
-A INPUT -s <onsensorXX_ip> -p tcp -m state --state NEW -m tcp --dport 5001 -j ACCEPT
It is necessary to restart the service:
systemctl restart iptables
2.6.5. Elasticsearch HA
2.6.6. Kibana HA
Kibana service is showing the information saved on elasticsearch cluster. So, we will connect elasticsearch to port 9200 to get this information.
If our OpenNAC Enterprise is a 1.2.5 version, it will have HA integrated and the best architecture scheme for our ELK cluster is to have all the Kibana listening in localhost. To have these, we need to edit the following file:
vi /etc/kibana/kibana.yml
The lines need to be the following:
server.port: 5601
server.host: "0.0.0.0"
server.basePath: "/admin/rest/elasticsearch"
server.rewriteBasePath: false
#elasticsearch.hosts: ["onanalytics01:9200","onanalytics02:9200"]
If we want to have another architecture with lower Kibana running on the cluster, or only one Kibana, we need the following.
To configure HA in Kibana we need to add the following line with the onanalytics on the cluster:
elasticsearch.hosts: ["onanalytics01:9200","onanalytics02:9200"]
This will allow to ask one onanalytics for the data to show, and if it doesn’t work, we will be able to get the data from the other onanalytics. The data is the same because onanalytics are forming a cluster of elasticsearch.
It is necessary to restart the service:
systemctl restart kibana
2.6.6.1. Iptables
There are some iptables needed for ELK communication at onanalytics with Kibana. We need to edit the file:
vi /etc/sysconfig/iptables
OpenNAC Enterprise accesses Kibana at port 5601. If we want to access as developers to edit and create new dashboards or visualizations, we need to access the following path:
https://<CORE_IP_OR_DOMAIN>/admin/rest/elasticsearch/app/home#/
-A INPUT -s <oncoreXX_ip> -p tcp -m state --state NEW -m tcp --dport 5601 -j ACCEPT
It is necessary to restart the service:
systemctl restart iptables
2.6.7. OpenNAC ELK
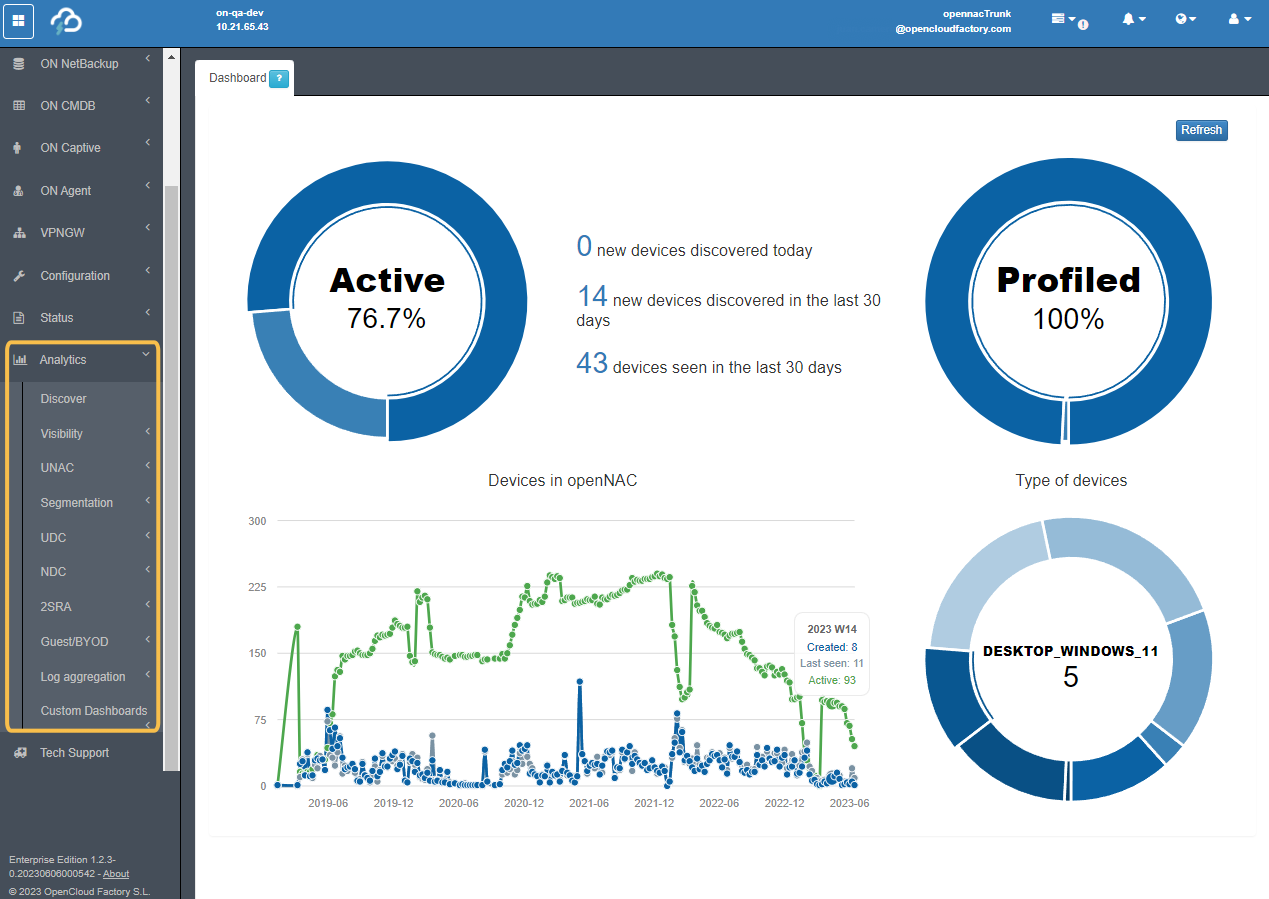
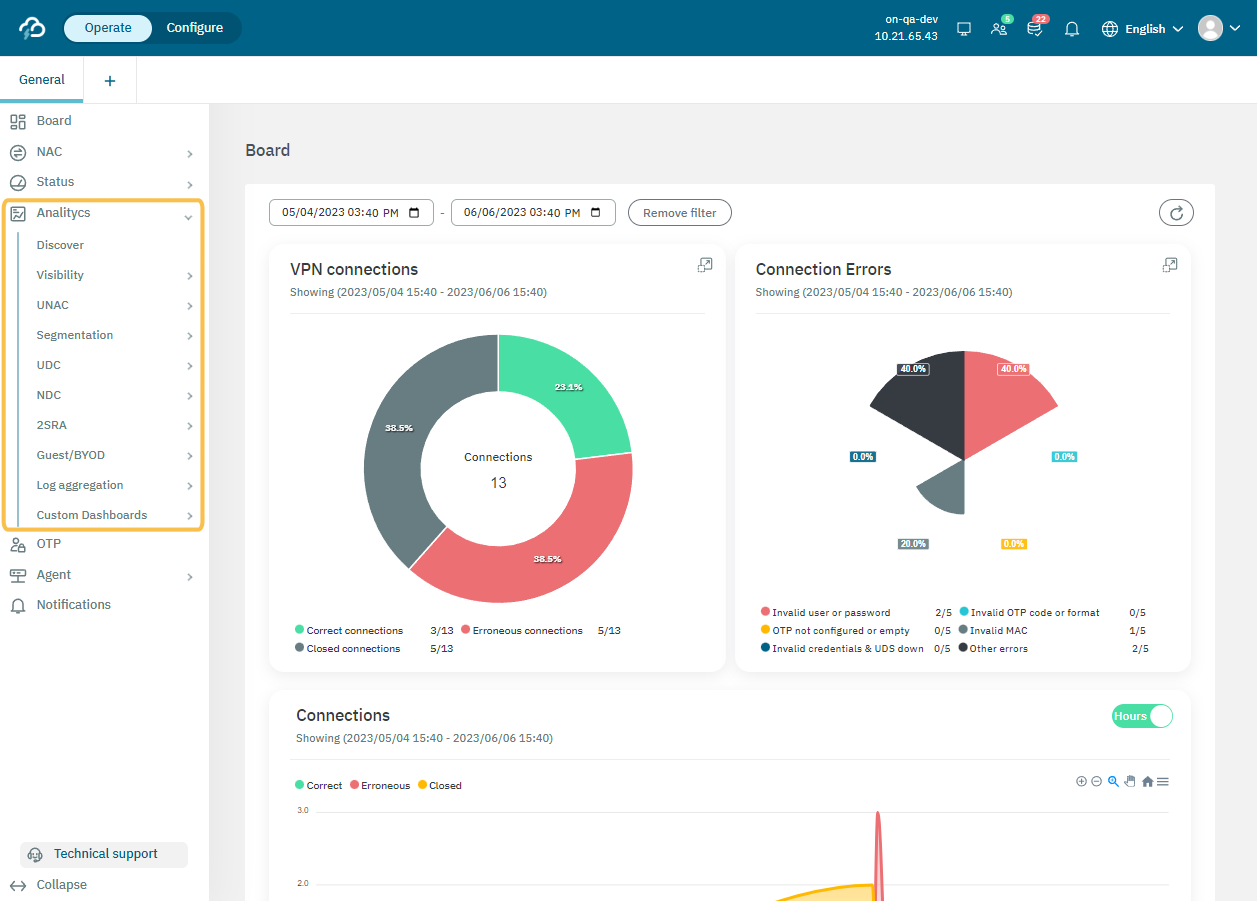
To access the information logged by our ELK system, we use OpenNAC Enterprise to reach Kibana. Kibana is accessible on port 5601, and the logged information is displayed within the Analytics module.
Default Portal

NextGen Portal

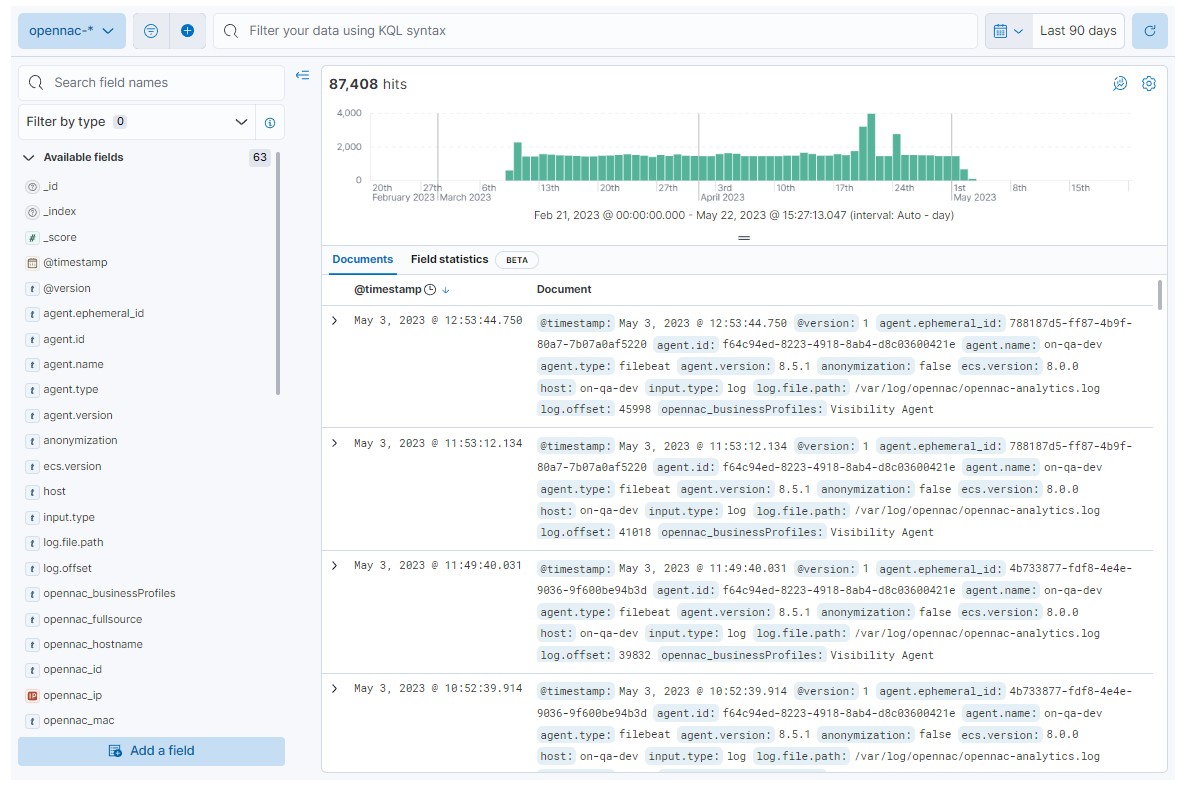
On the Discover dashboard we can find the logs that arrive to an index:

For more information about all available dashboards, see the Analytics section in either the Default Portal or the NextGen Portal, depending on your use case.
If you have any doubts regarding which portal documentation you should refer to, read the Administration Portal section. There you can find the details about both portals and the use cases they support.
Discover and User Device Profiling plugins also uses ELK to get information about the different devices.