3.2.3.6. KRI
The Key Risk Indicator (KRI) section is designed to provide a comprehensive overview of critical risk indicators related to network security and compliance.
3.2.3.6.1. KRI general overview
To maximize the benefits of this capability, it’s essential to understand the key features of this view.
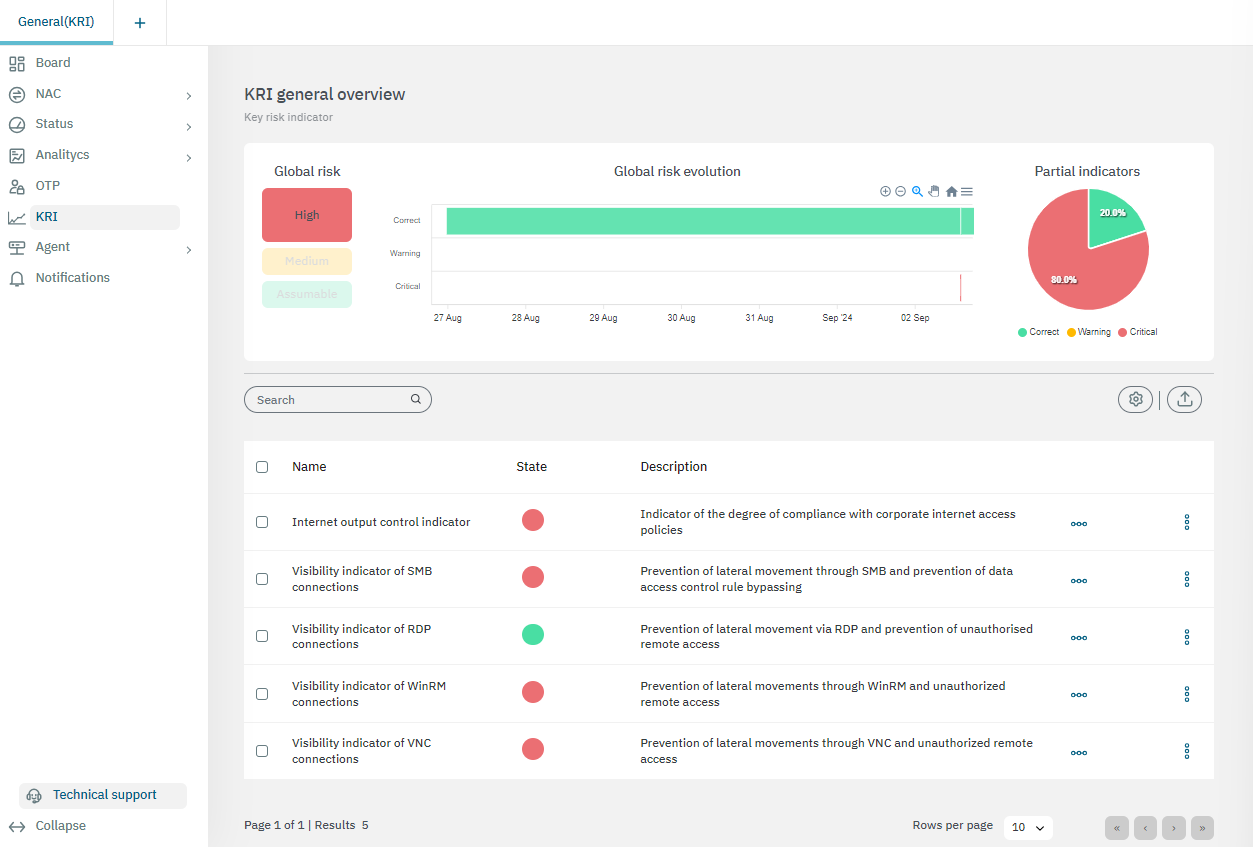
The upper section, presents a comprehensive view of global risk through three key visual elements:
Global Risk: This component visually represents the overall risk level using a color-coded system:
Red: Indicates high risk.
Yellow: Indicates medium risk.
Green: Indicates an assumable or low risk.
Global risk evolution: The timeline displays the progression of risk over a specific period, helping users track changes and trends in global risk.
Partial Indicators: A pie chart provides a quick overview of how individual risks contribute to the global average.
3.2.3.6.2. KRI Metrics
Each KRI reflects specific metrics that can help assess potential risks to the organization’s IT infrastructure:
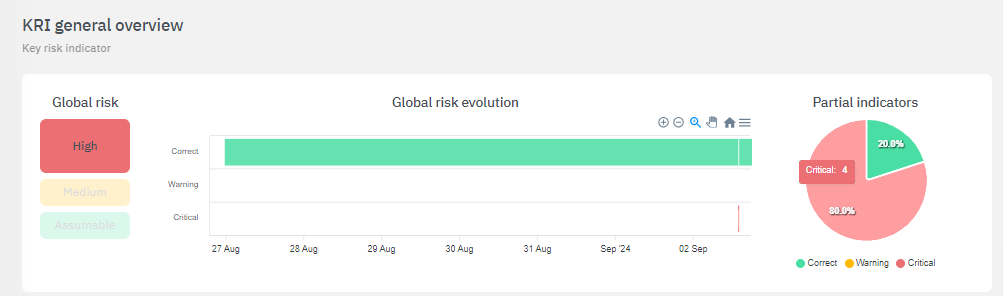
By clicking on the three horizontal dot icon (View detail), you can access the details of each metric.
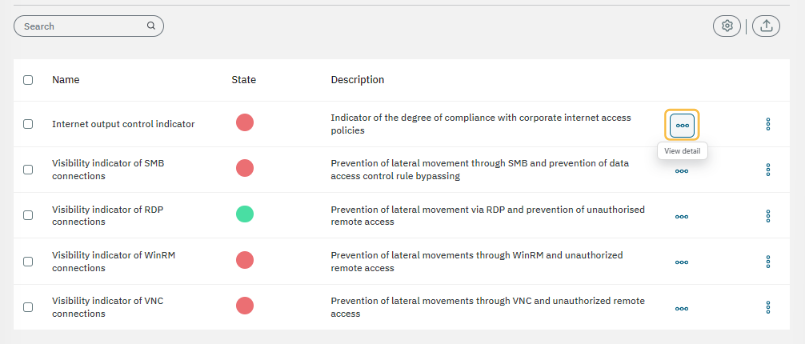
3.2.3.6.2.1. KRI details toolbar
All metrics share the same toolbar. at the top of the view:

Let’s explore it fom left to right:
Dashboard: By clicking on the first icon, it will lead you to an Analytics dashboard for the corresponding query.
Info: A help button that links to the KRI section of the OpenNAC technical documentation.
Refresh: This button refreshes the page.
Date selector: Choose from options such as last day, last week, last month, or set a custom date range.
Custom date: Allows you to specify the date range for the query you want to view.
3.2.3.6.2.2. Internet output control indicator
The first section displays the general description for this metric:
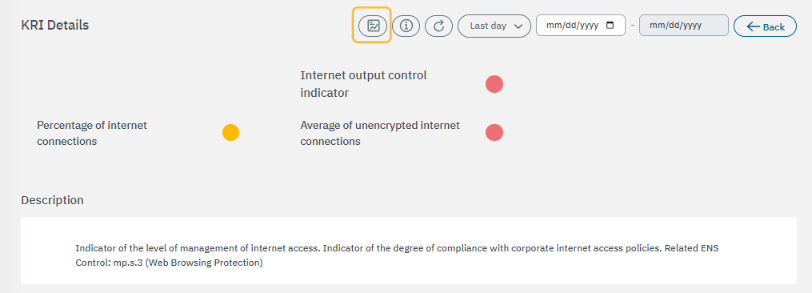
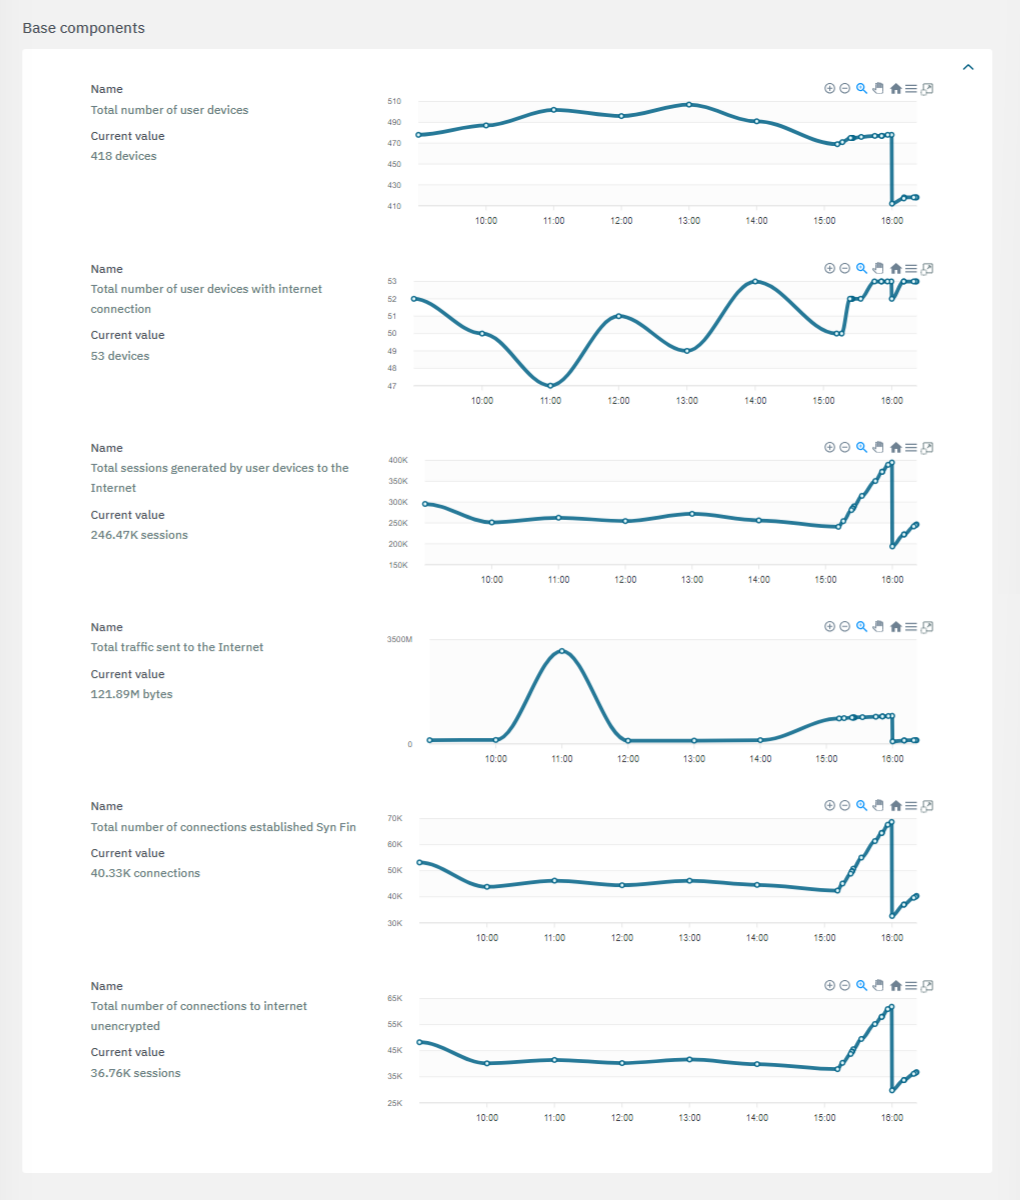
The second section features the base components used to calculate risks:
The third section features the calculated components:
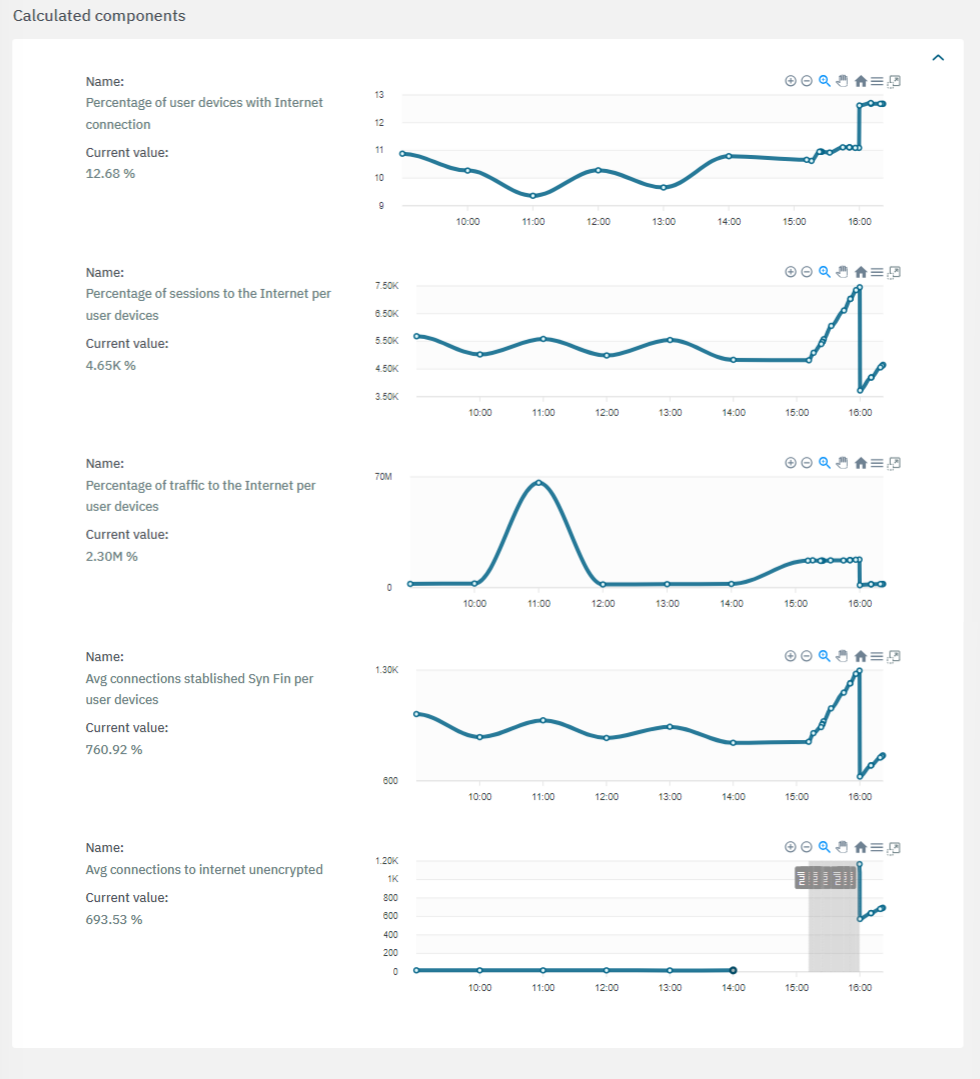
If a value is marked with the “Unreliable”
 flag, it indicates that there is insufficient data available to complete the calculations.
If a value is marked with the “Null”
 flag, it indicates that the calculations were unsuccessful or that the necessary services were unavailable.
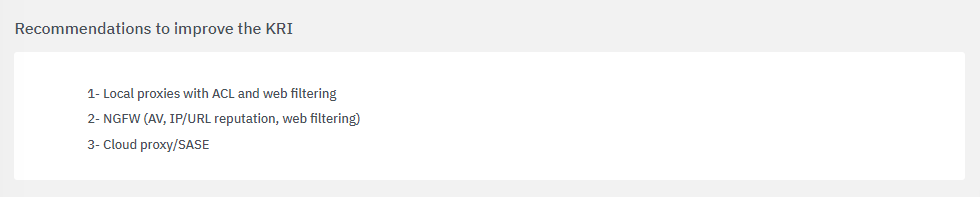
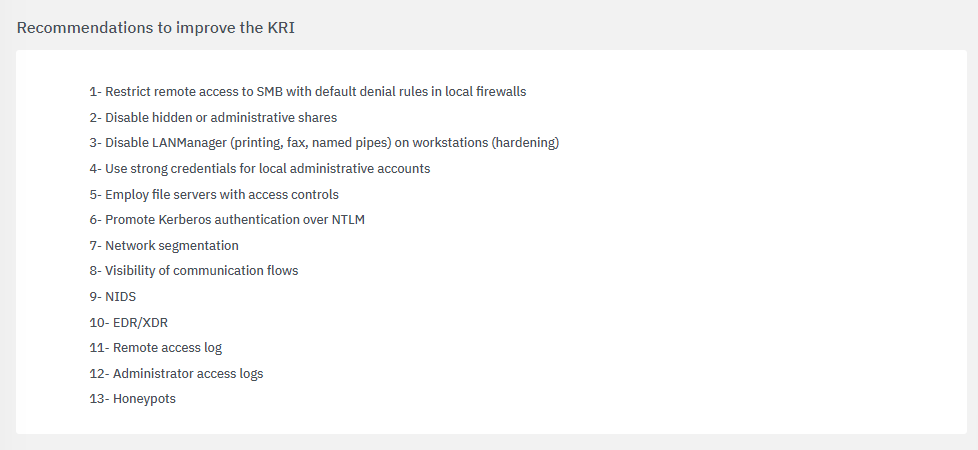
The fourth section includes recommendations to improve the KRI:
The fifth section features tactics, techniques and procedures based on the MITRE ATT&CK knowledge base:
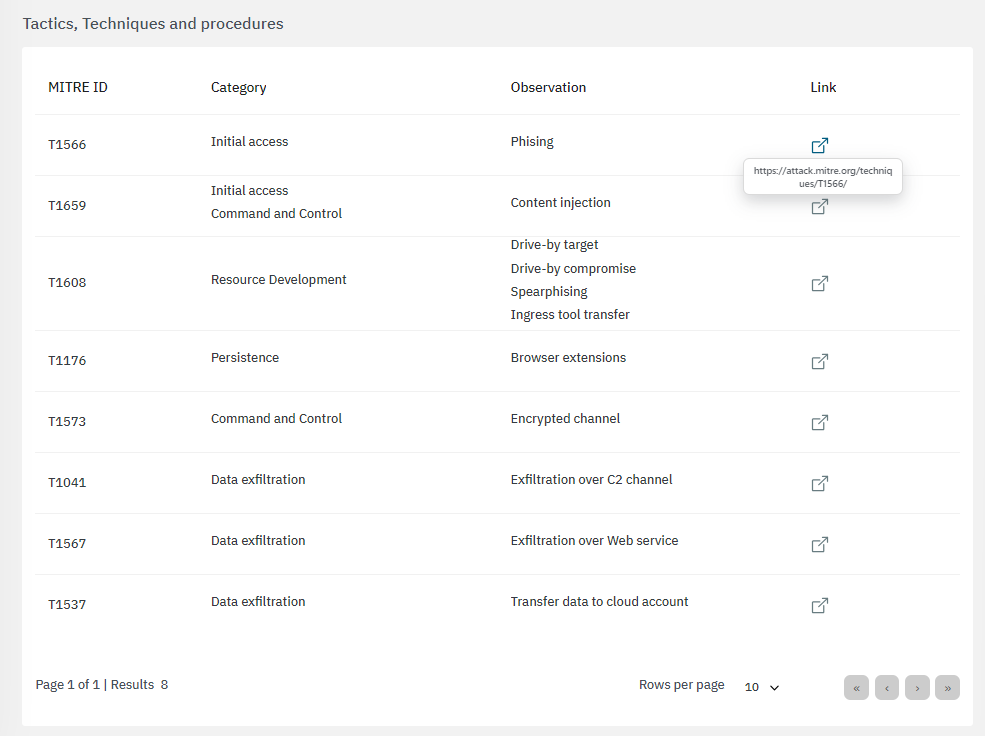
By clicking on the “link” icon, it will lead you to the ATT&CK Knowledge base containing proper indications of problem mitigation, detections and further references.
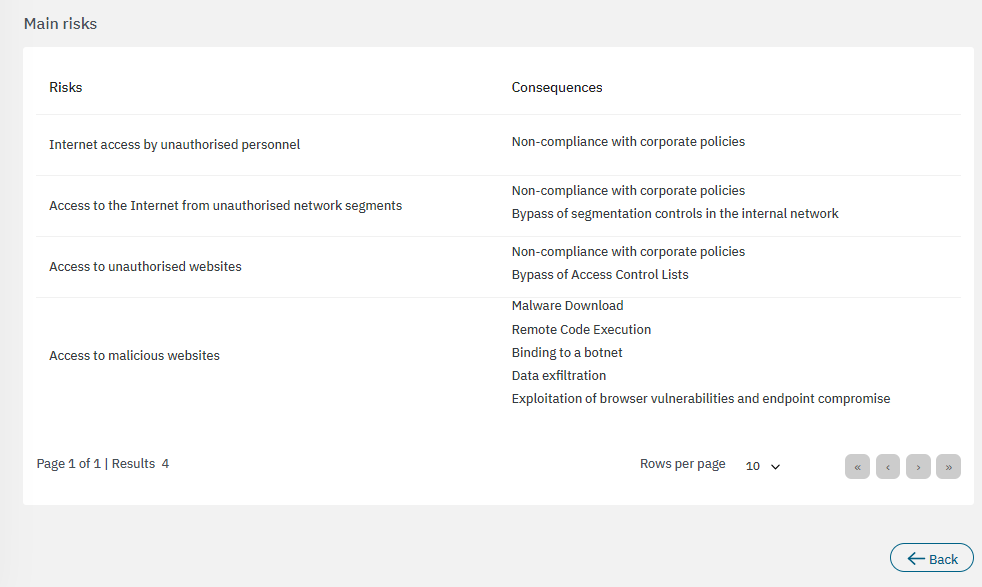
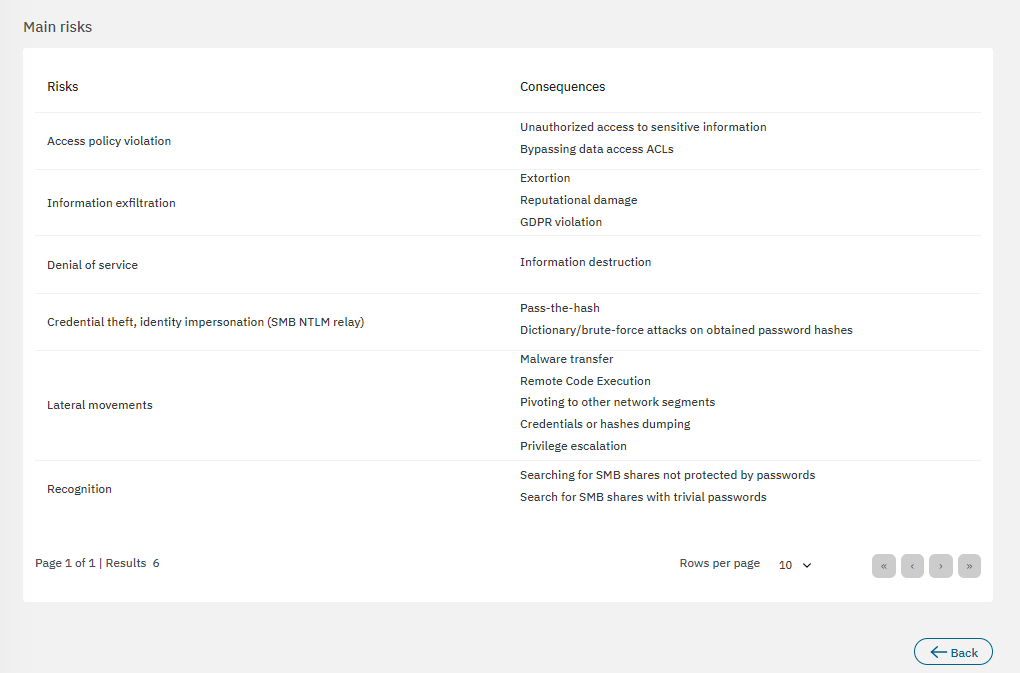
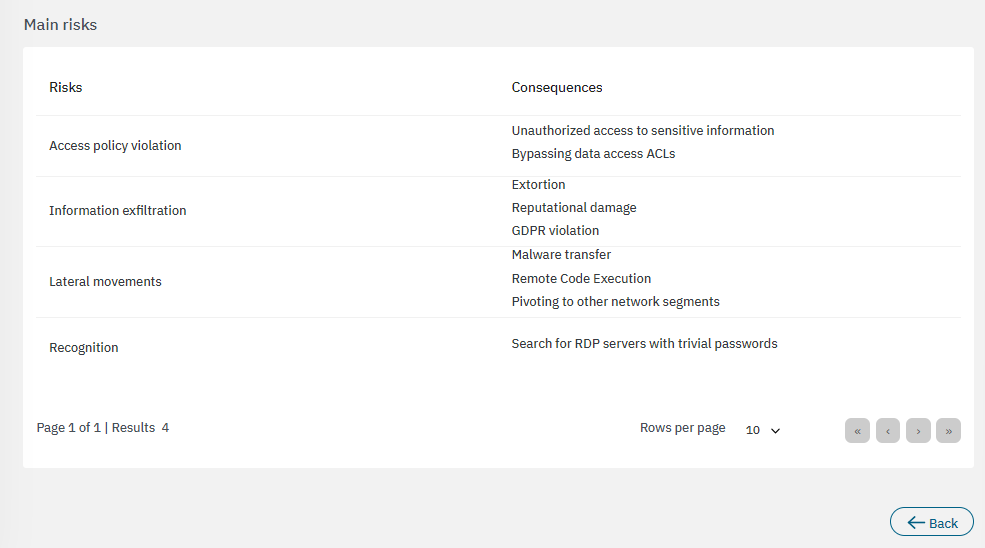
The bottom section features the main risks associated to the calculations:
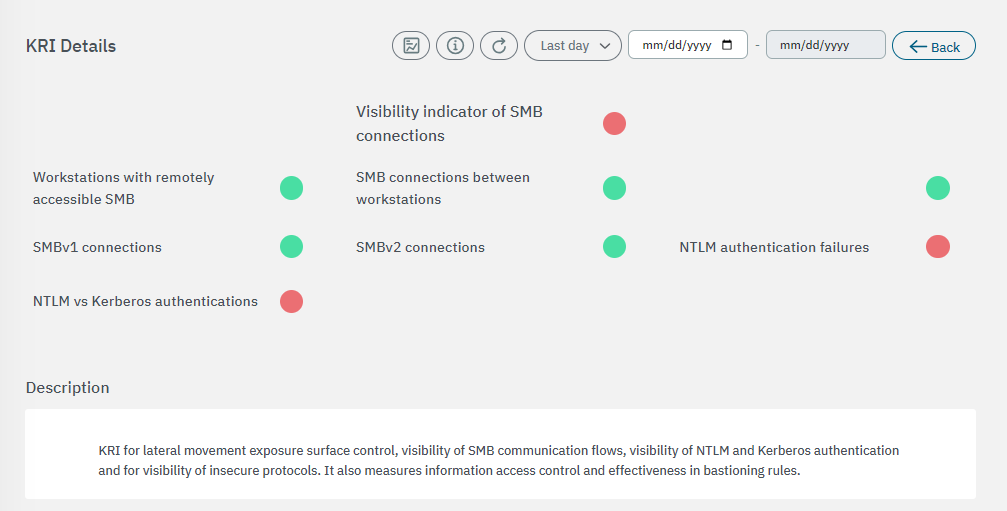
3.2.3.6.2.3. Visibility indicator of SMB connections
The first section displays the general description for this metric:
The second section features the base components used to calculate risks:
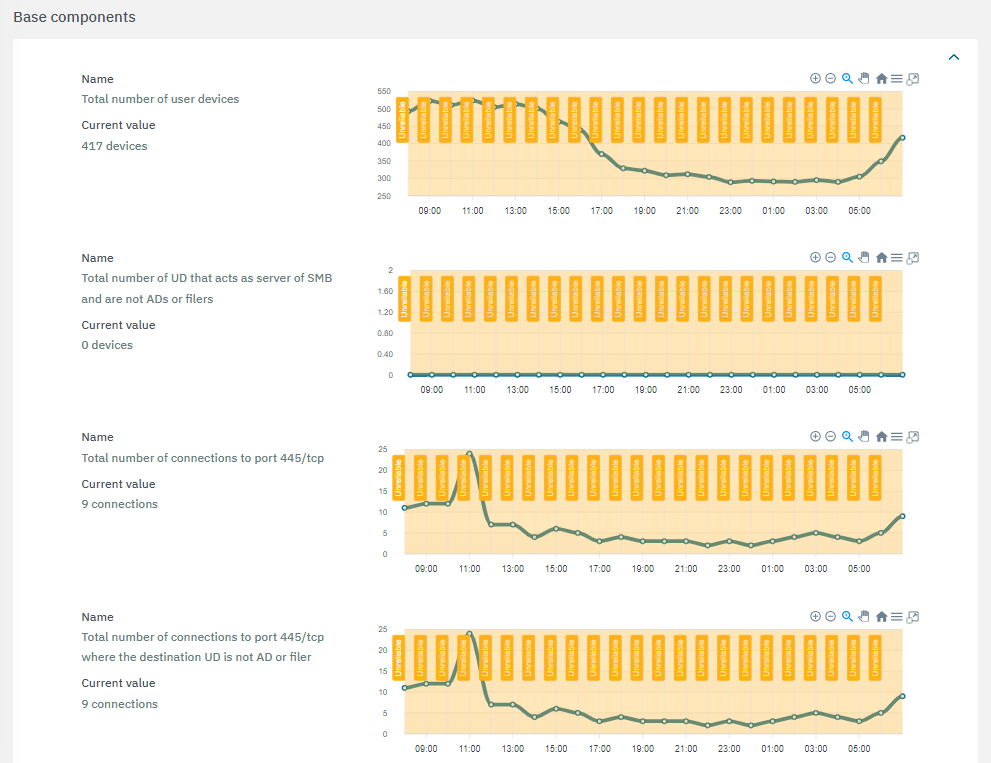
The extensive list of base components include:
Total number of user devices
Total number of UD that acts as server of SMB and are not ADs or filers
Total number of connections to port 445/tcp
Total number of connections to port 445/tcp where the destination UD is not AD or filer
Total number of SMB connections to C$
Total number of SMB connection to Admin$ where the destination UD is not AD or filer
Total number of SMB connections to IPC$ where the destination UD is not AD or filer
Total number of SMB connections to Print$ where the destination UD is not AD or filer
Total number of SMB connections to Fax$ where the destination UD is not AD or filer
Total number of SMBv1 connections
Total number of SMBv2 connections
Total number of SMB connections which are not SMBv1 neither SMBv2
Total number of NTLM successful authtentications
Total number of NTLM failed authentications
Total number of Kerberos successful authentications
The third section features the calculated components:
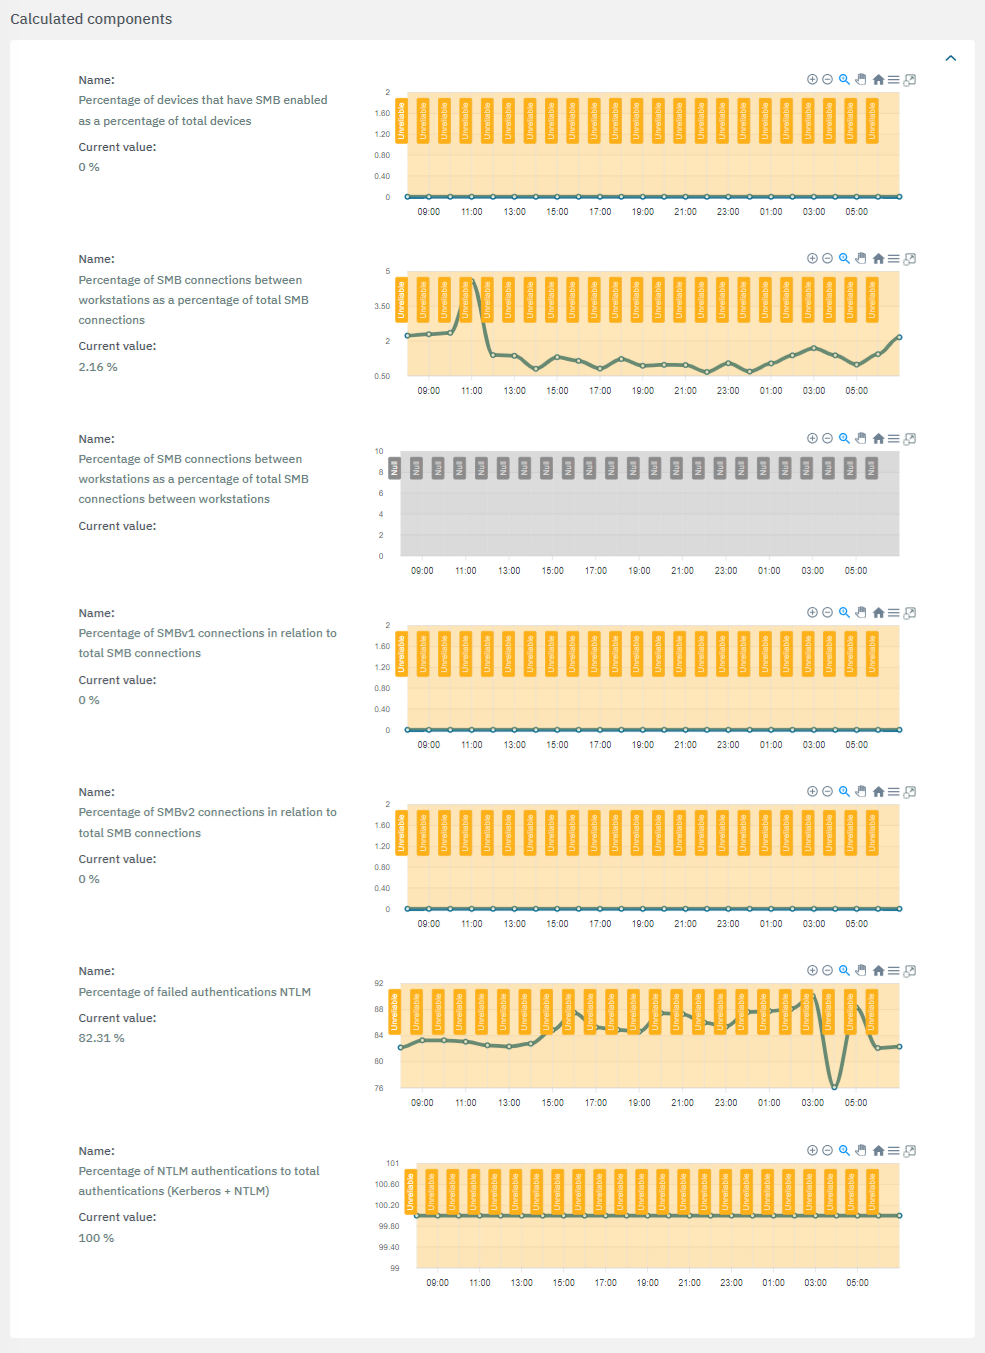
If a value is marked with the “Unreliable”
flag, it indicates that there is insufficient data available to complete the calculations.If a value is marked with the “Null”
flag, it indicates that the calculations were unsuccessful or that the necessary services were unavailable.
The fourth section includes recommendations to improve the KRI:
The bottom section features tactics, techniques and procedures based on the MITRE ATT&CK knowledge base:
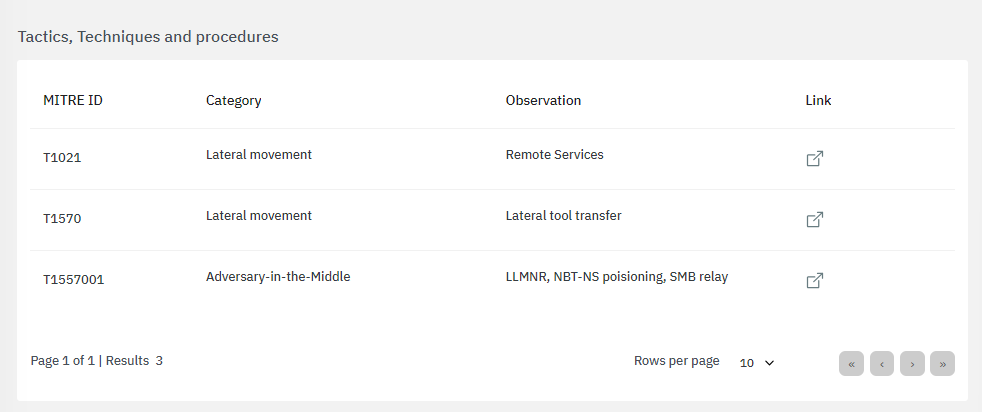
By clicking on the “link” icon, it will lead you to the ATT&CK Knowledge base containing proper indications of problem mitigation, detections and further references.
The bottom section features the main risks associated to the calculations:
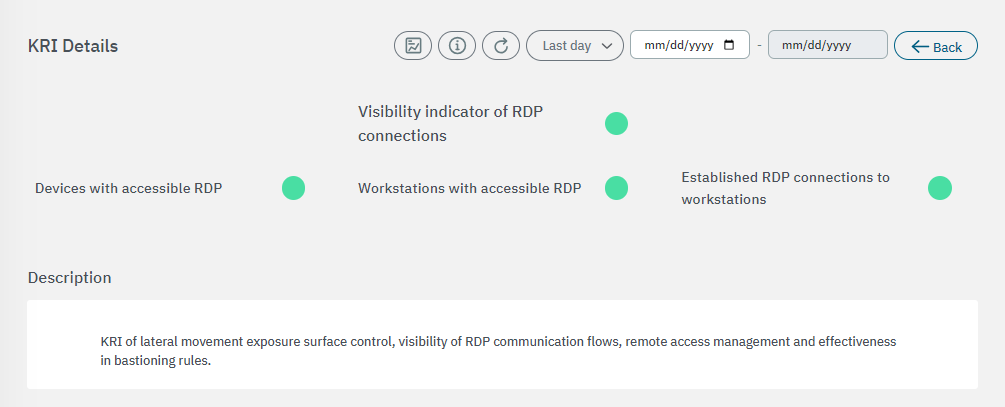
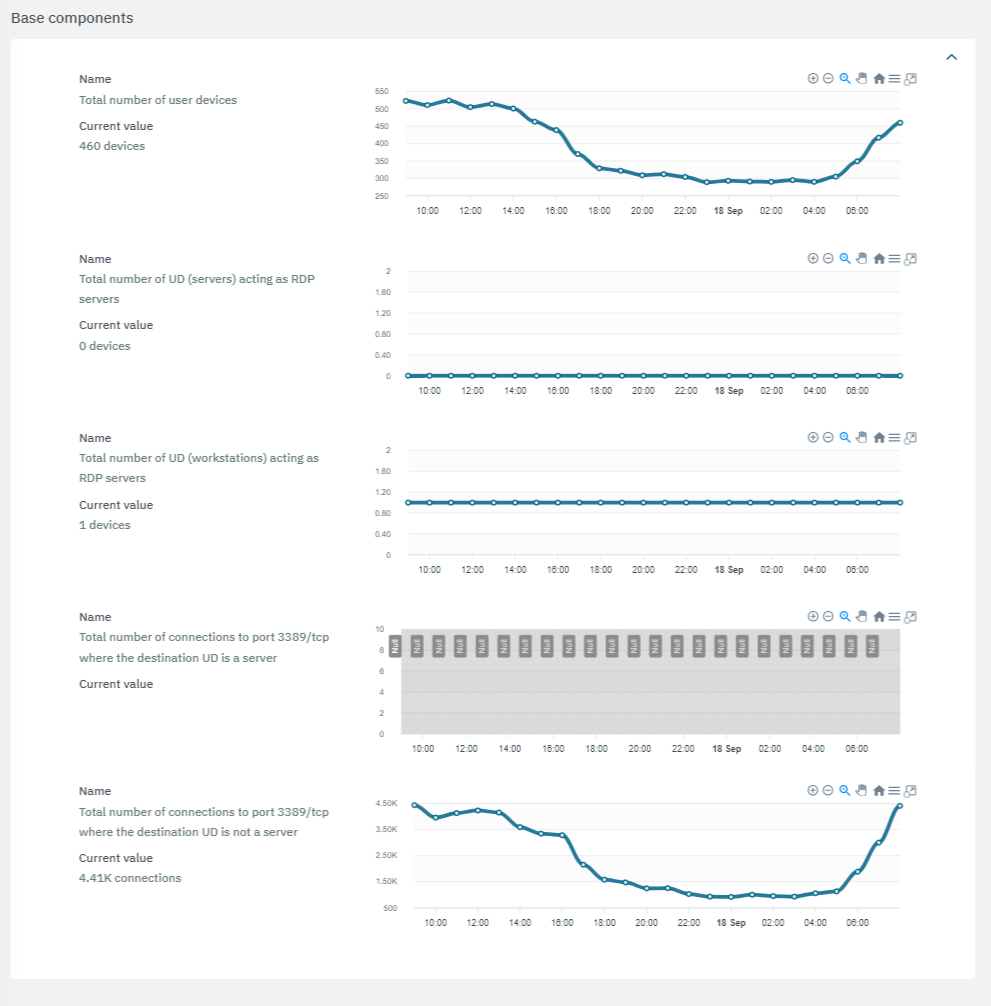
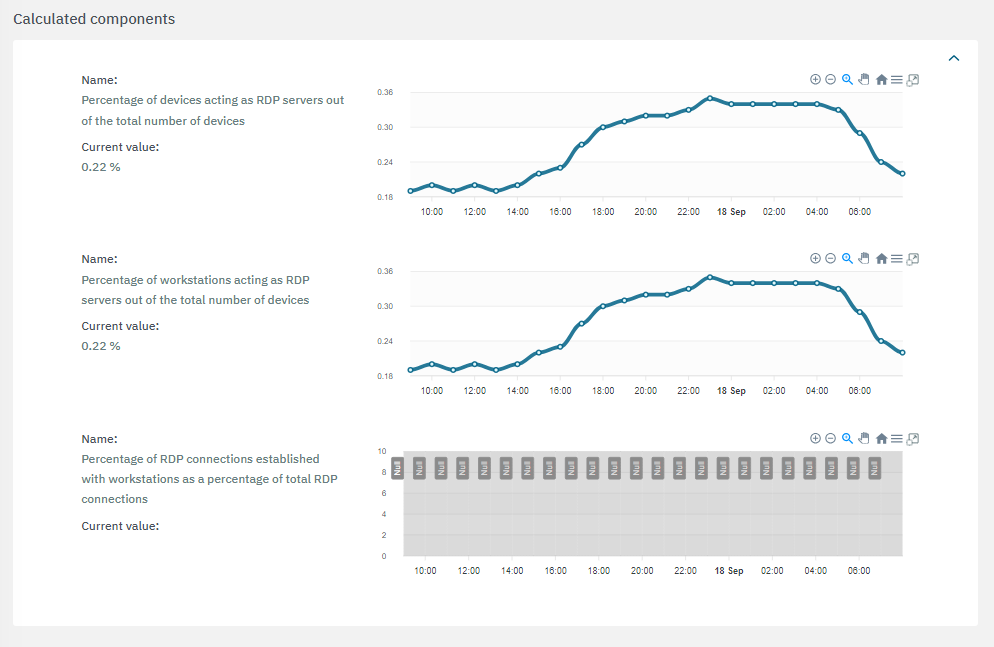
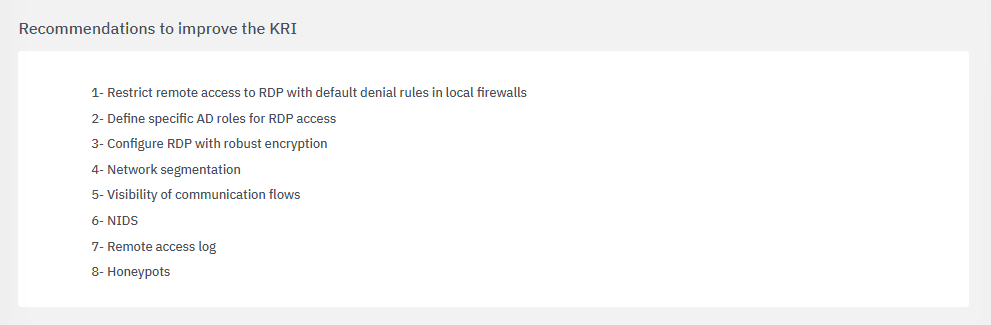
3.2.3.6.2.4. Visibility indicator of RDP connections
The first section displays the general description for this metric:
The second section features the base components used to calculate risks:
The third section features the calculated components:
If a value is marked with the “Unreliable”
flag, it indicates that there is insufficient data available to complete the calculations.If a value is marked with the “Null”
flag, it indicates that the calculations were unsuccessful or that the necessary services were unavailable.
The fourth section includes recommendations to improve the KRI:
The bottom section features tactics, techniques and procedures based on the MITRE ATT&CK knowledge base:
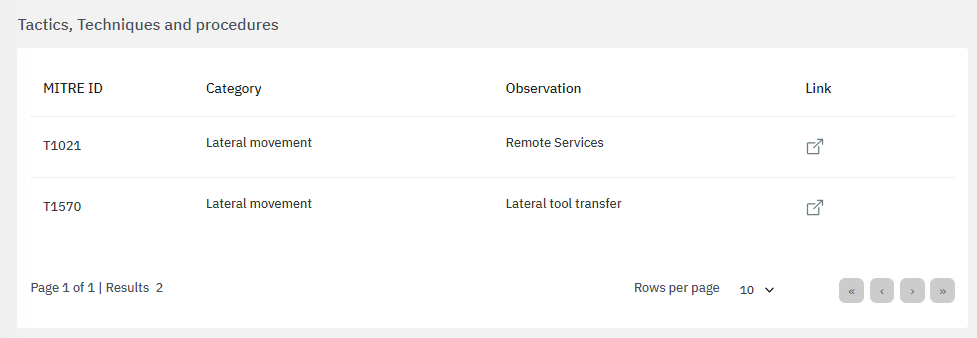
By clicking on the “link” icon, it will lead you to the ATT&CK Knowledge base containing proper indications of problem mitigation, detections and further references.
The bottom section features the main risks associated to the calculations:
3.2.3.6.2.5. Visibility indicator of WinRM connections
The first section displays the general description for this metric:
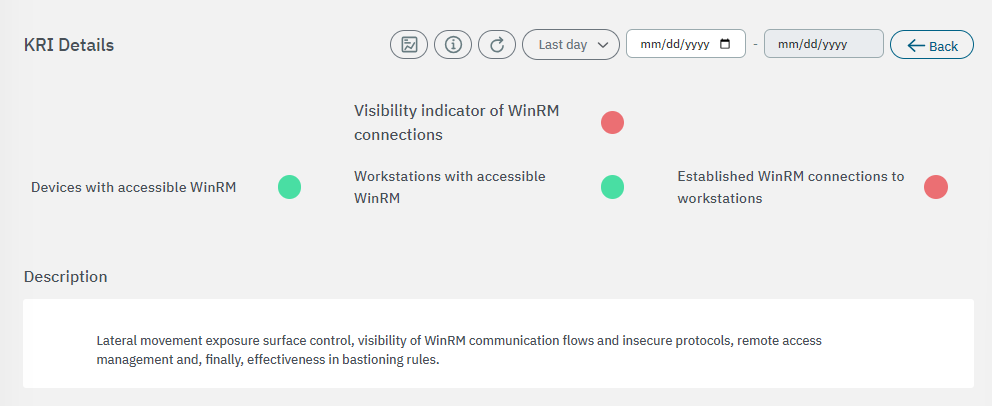
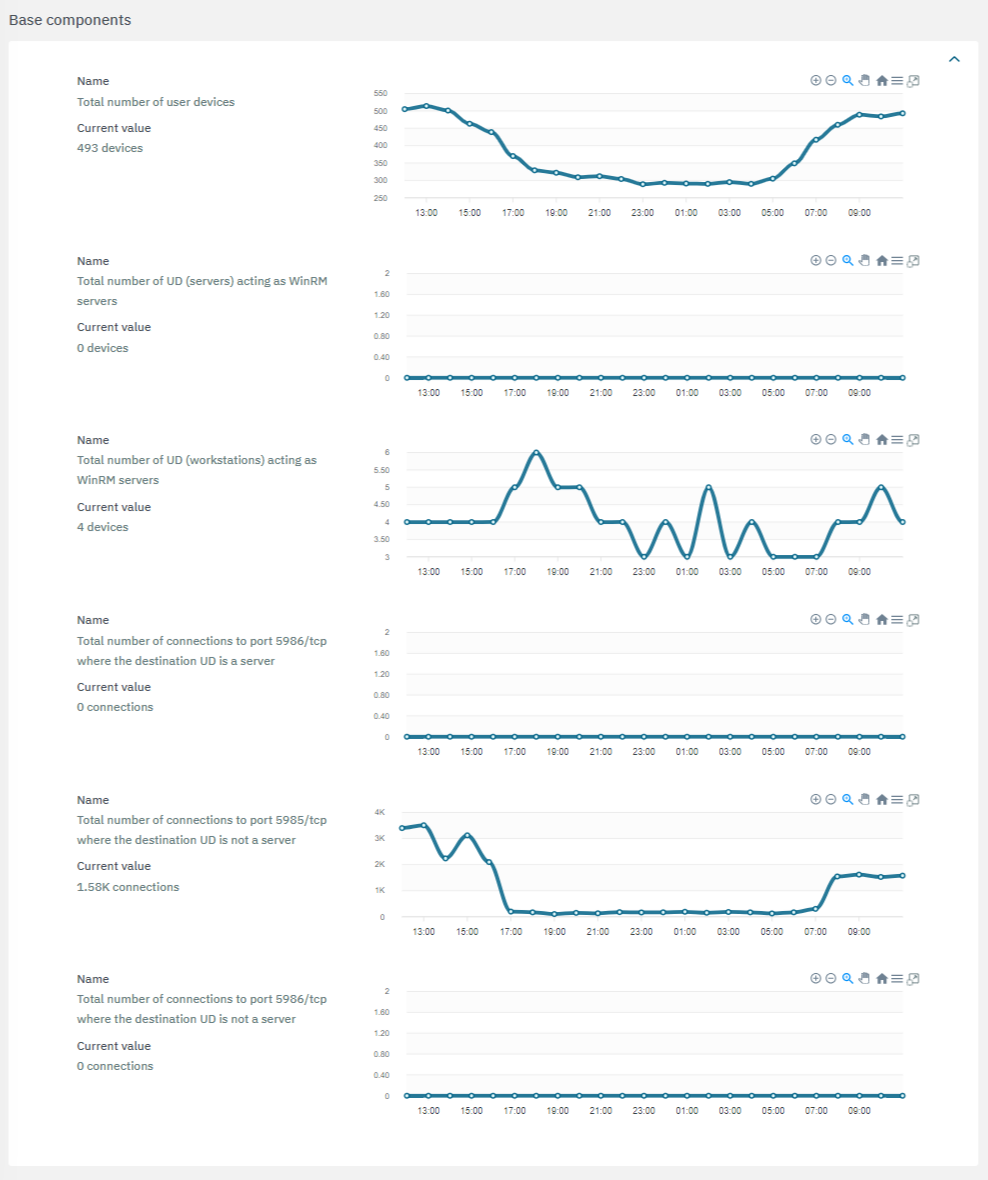
The second section features the base components used to calculate risks:
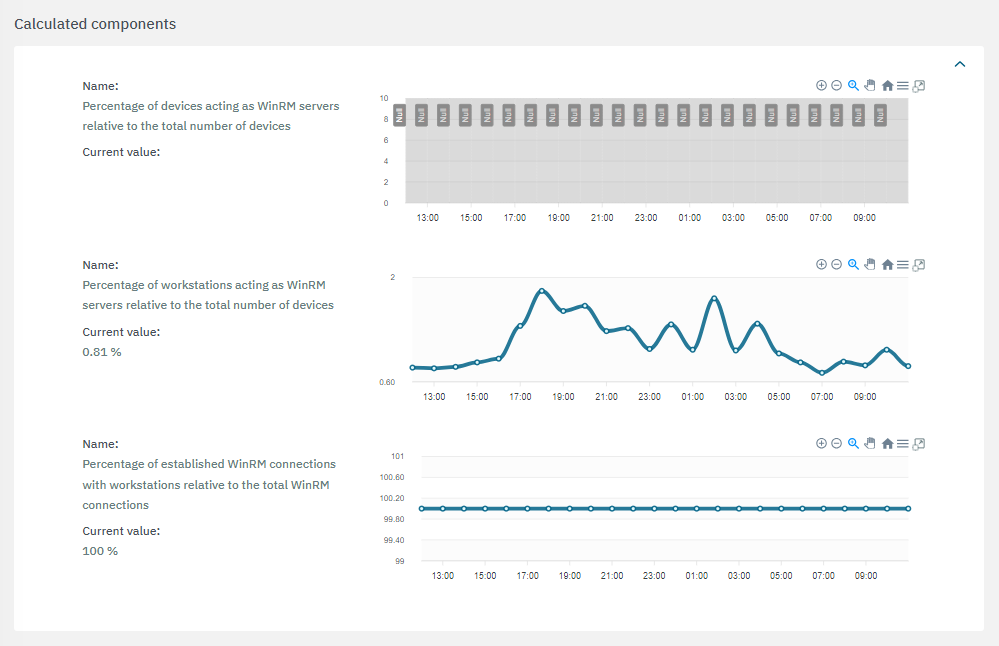
The third section features the calculated components:
If a value is marked with the “Unreliable”
flag, it indicates that there is insufficient data available to complete the calculations.If a value is marked with the “Null”
flag, it indicates that the calculations were unsuccessful or that the necessary services were unavailable.
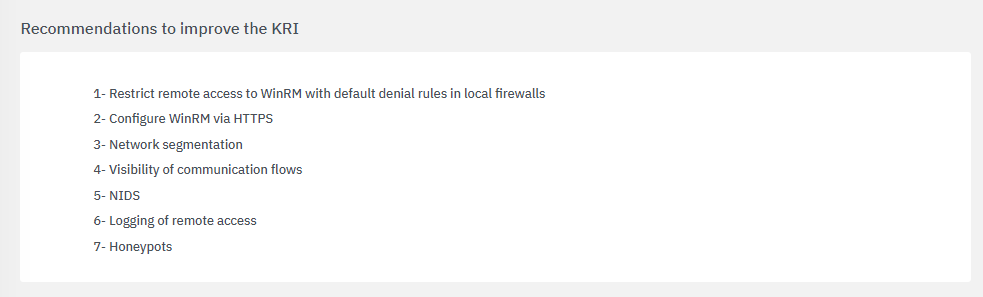
The fourth section includes recommendations to improve the KRI:
The bottom section features tactics, techniques and procedures based on the MITRE ATT&CK knowledge base:
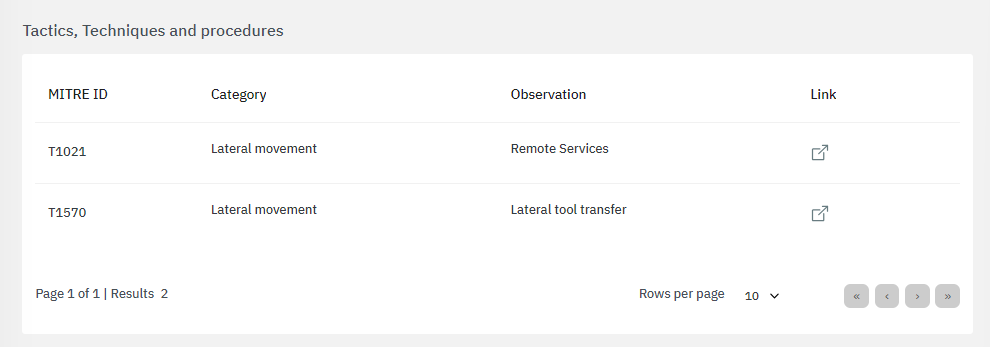
By clicking on the “link” icon, it will lead you to the ATT&CK Knowledge base containing proper indications of problem mitigation, detections and further references.
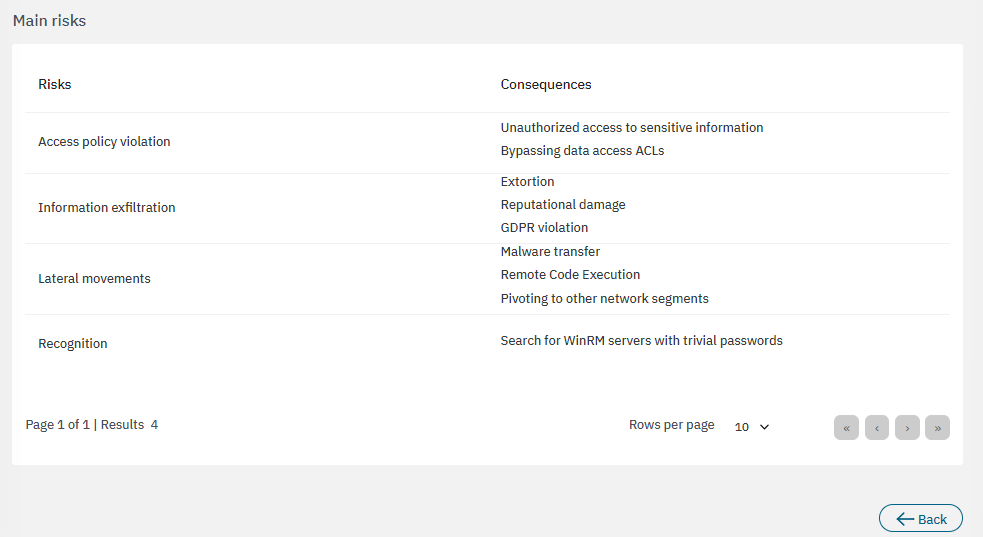
The bottom section features the main risks associated to the calculations:
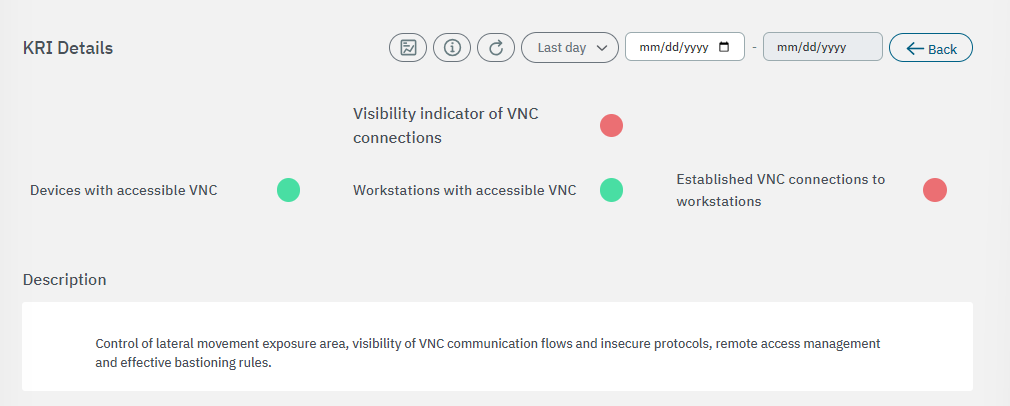
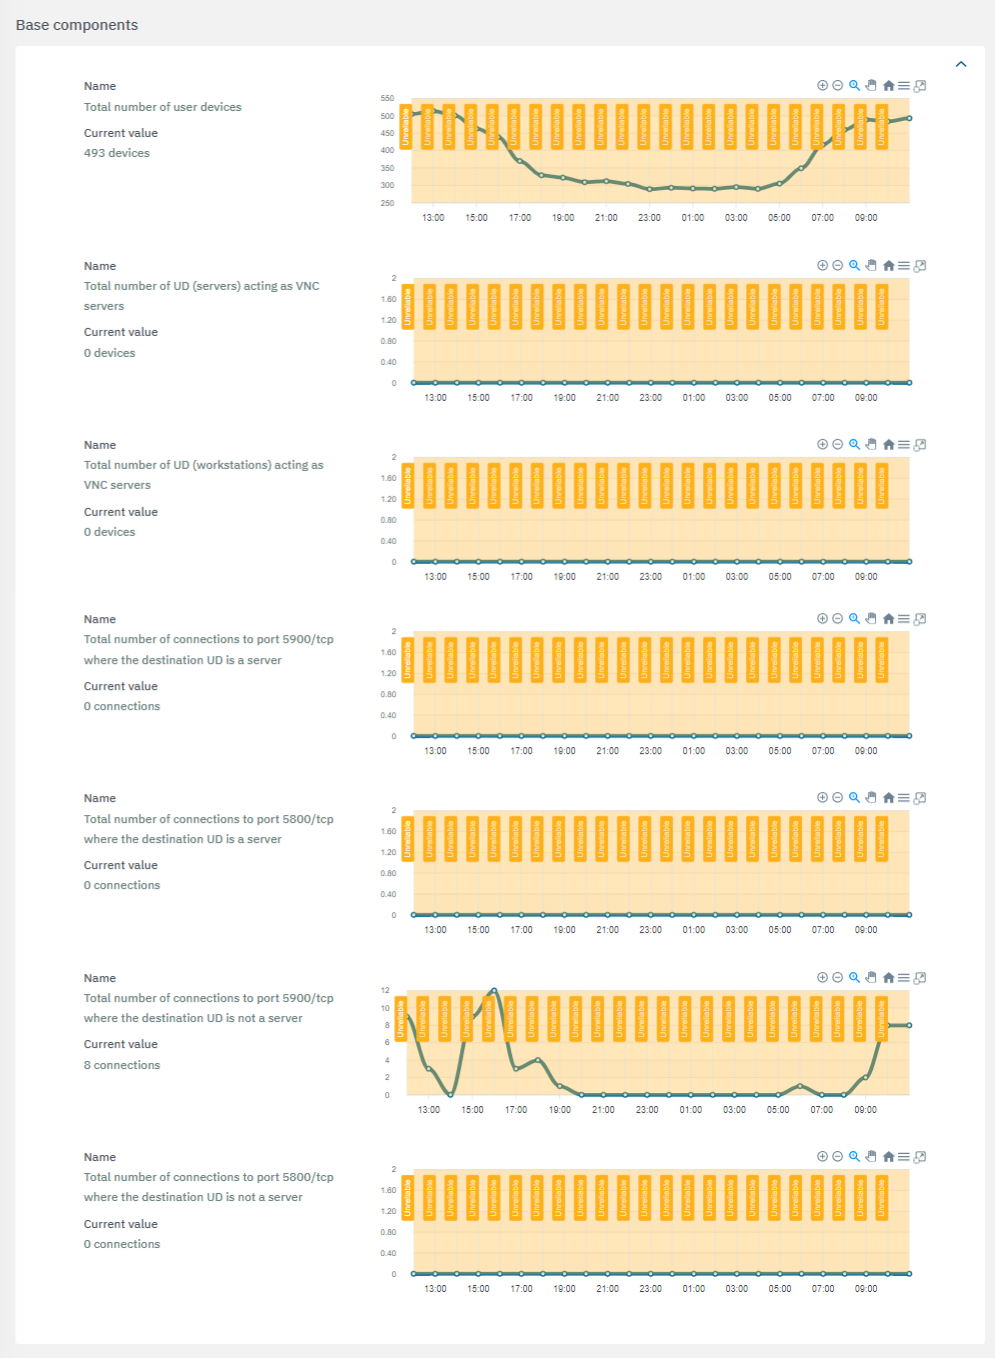
3.2.3.6.2.6. Visibility indicator of VNC connections
The first section displays the general description for this metric:
The second section features the base components used to calculate risks:
The third section features the calculated components:
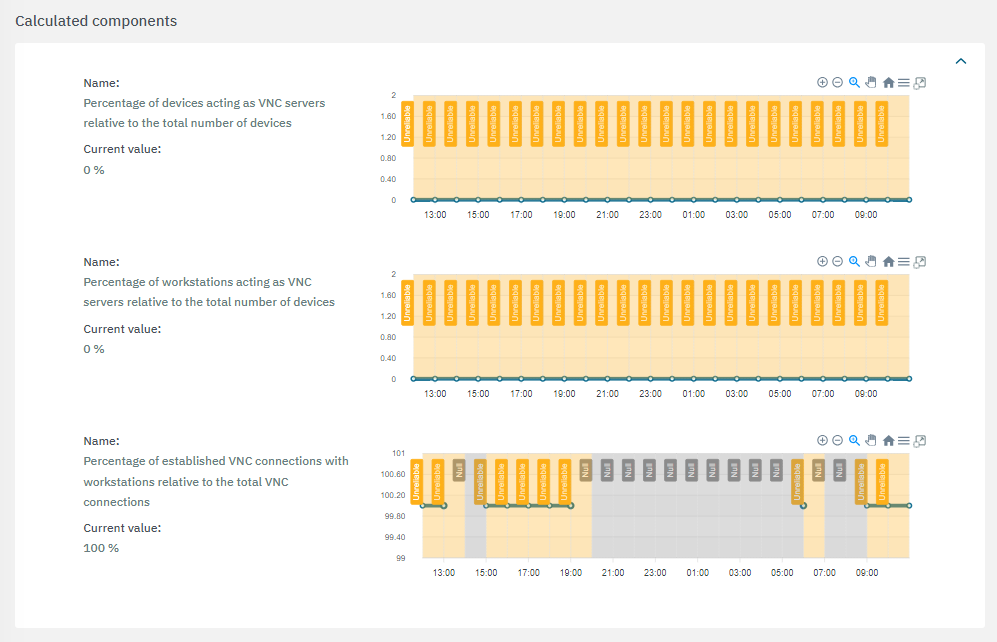
If a value is marked with the “Unreliable”
flag, it indicates that there is insufficient data available to complete the calculations.If a value is marked with the “Null”
flag, it indicates that the calculations were unsuccessful or that the necessary services were unavailable.
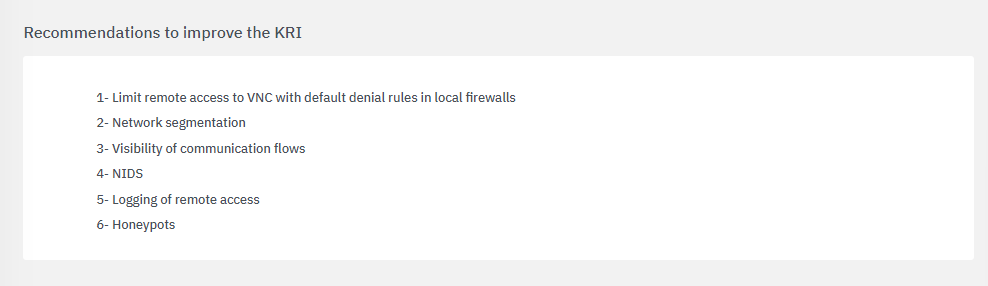
The fourth section includes recommendations to improve the KRI:
The bottom section features tactics, techniques and procedures based on the MITRE ATT&CK knowledge base:
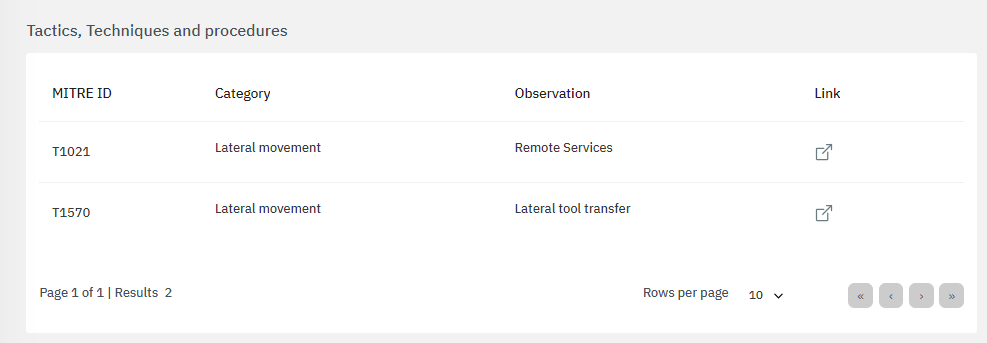
By clicking on the “link” icon, it will lead you to the ATT&CK Knowledge base containing proper indications of problem mitigation, detections and further references.
The bottom section features the main risks associated to the calculations:

3.2.3.6.3. KRI Dashboards
Each metric features its own dashboard that can be accessed by clicking on the first icon of the main toolbar:
3.2.3.6.3.1. Internet output control indicator Dashboard
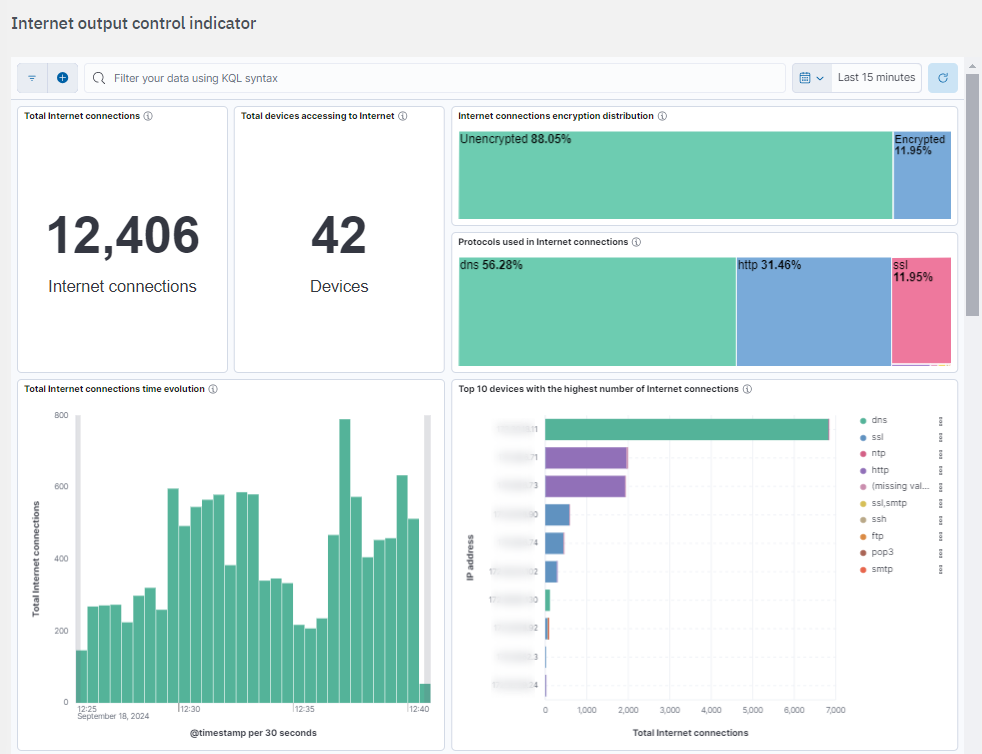
Total Internet connections: Metric showing the total number of connections to the internet.
Total devices accessing to Internet: Metric showing the total unique devices connecting to the Internet.
Internet connections encryption distribution: Tree map showing the encryption status of the connections to the Internet.
Protocols used in Internet connections: Tree map showing the distribution of protocols used in the internet connections.
Total Internet connections time evolution: Histogram showing the time evolution of the Internet connections.
Top 10 devices with the highest number of Internet connections: Bar chart showing the top 10 devices by the total number of connections to the Internet. Each bar indicates the Internet connections for a specific client IP address and is segmented by the protocol used: DNS, SSL, HTTP, etc. If the connection does not have a specific protocol, it will show “missing value”.
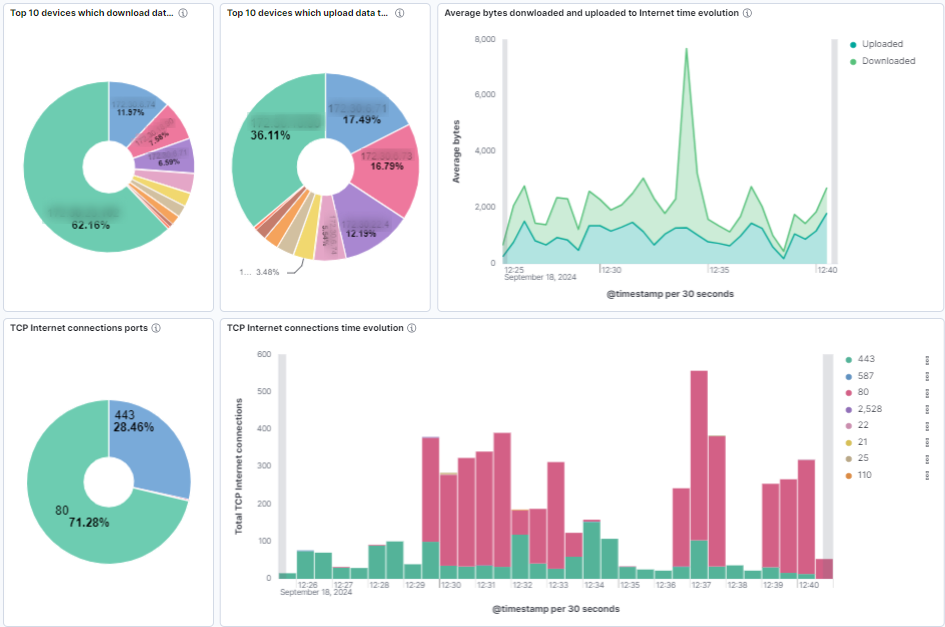
Top 10 devices which download data from Internet: Pie chart showing the top 10 devices with the highest downloaded bytes from internet.
Top 10 devices which upload data to Internet: Pie chart showing the top 10 devices with the highest downloaded bytes from internet.
Average bytes downloaded and uploaded to Internet time evolution: Histogram showing the time evolution of the average bytes downloaded and uploaded in Internet connections.
TCP Internet connections ports: Pie chart showing the distribution of destination TCP ports in Internet connections.
TCP Internet connections time evolution: Histogram showing the time evolution of TCP Internet connections. The bar stacks are segmented by the destination TCP port.
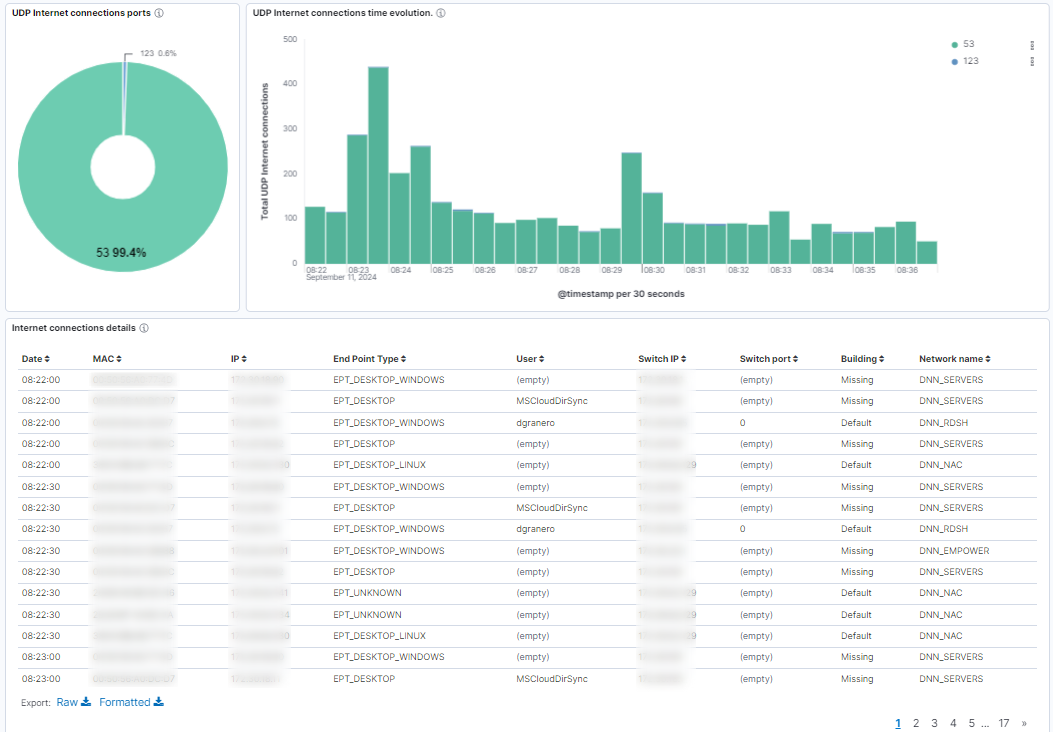
UDP Internet connections ports: Pie chart showing the distribution of destination UDP ports in Internet connections.
UDP Internet connections time evolution: Histogram showing the time evolution of UDP Internet connections. The bar stacks are segmented by the destination UDP port.
Internet connections details: Table showing the following information about Internet connections: dates, device info (MAC, IP, type), user, switch details (IP,port), and building and network names.
3.2.3.6.3.2. Visibility indicator of SMB connections dashboard
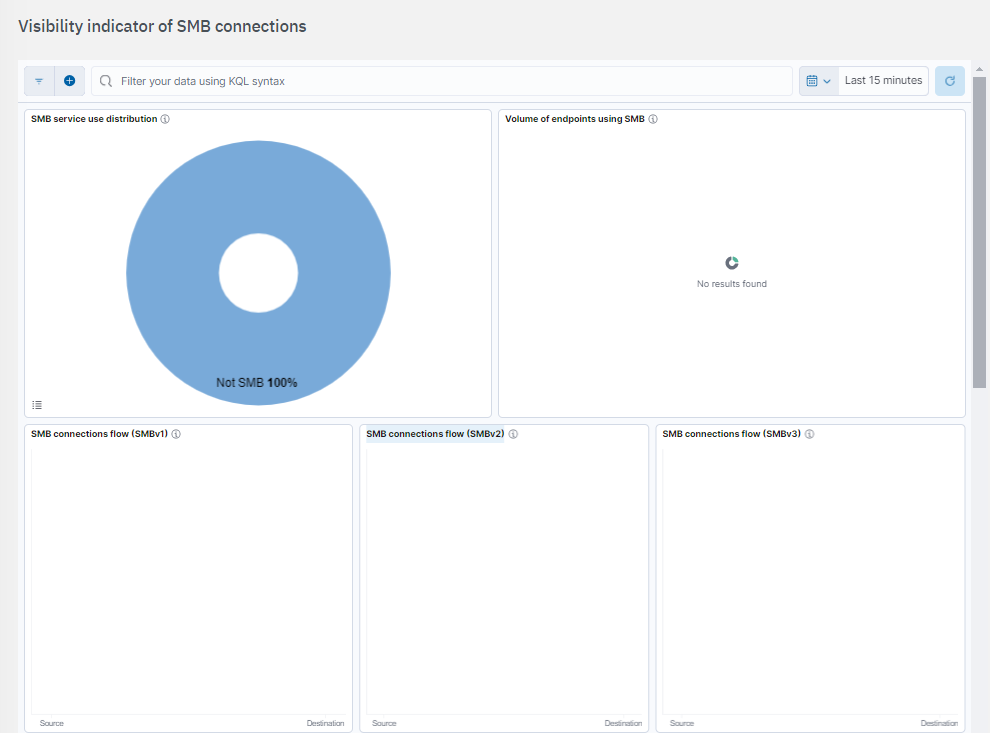
SMB service use distribution: Displays which endpoints are utilizing the SMB service.
Volume of endpoints using SMB: Percentage of devices acting as SMB server and distinction between server type endpoints and workstations.
SMB connections flow (SMBv1): Visibility of SMB (SMBv1) connections established from IP ranges that are not assigned to sysadmin.
SMB connections flow (SMBv2): Visibility of SMB (SMBv2) connections established from IP ranges that are not assigned to sysadmin.
SMB connections flow (SMBv3): Visibility of SMB (SMBv3) connections established from IP ranges that are not assigned to sysadmin.
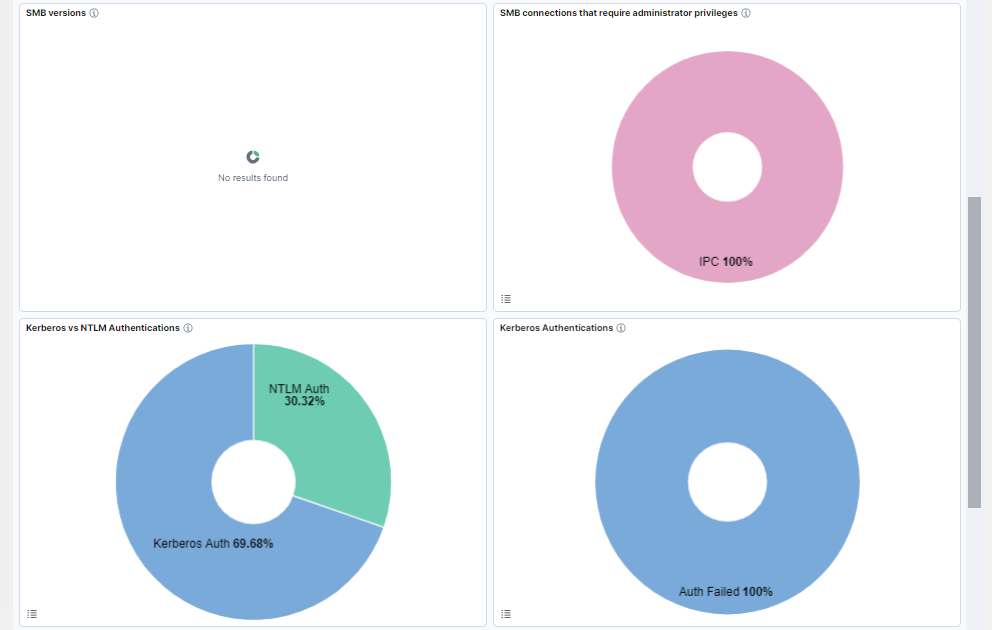
SMB versions: Percentage of SMB versions.
SMB connections that require administrator privileges: Percentage of devices acting as SMB, such as C$, Admin$, IPC$, Printer, or Fax.
Kerberos vs NTLM Authentications: Percentage of Kerberos/NTLM Authentications.
Kerberos Authentications: Percentage of Kerberos success/failed authentications.
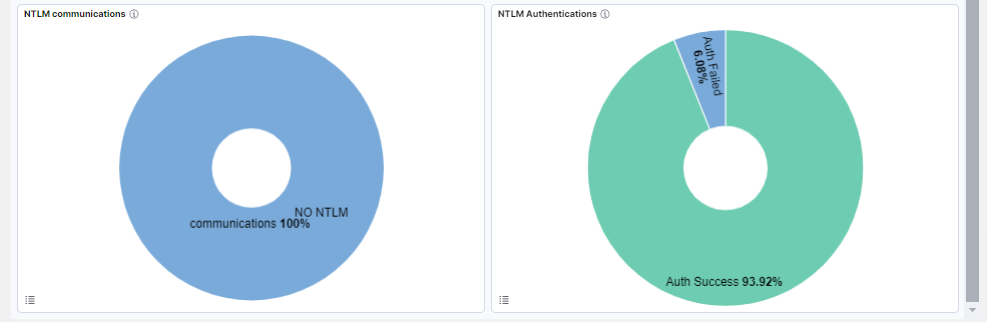
NTLM communications: Percentage of NTLM communications.
NTLM Authentications: Percentage of NTLM success/failed authentications.
3.2.3.6.3.3. Visibility indicator of RDP connections dashboard
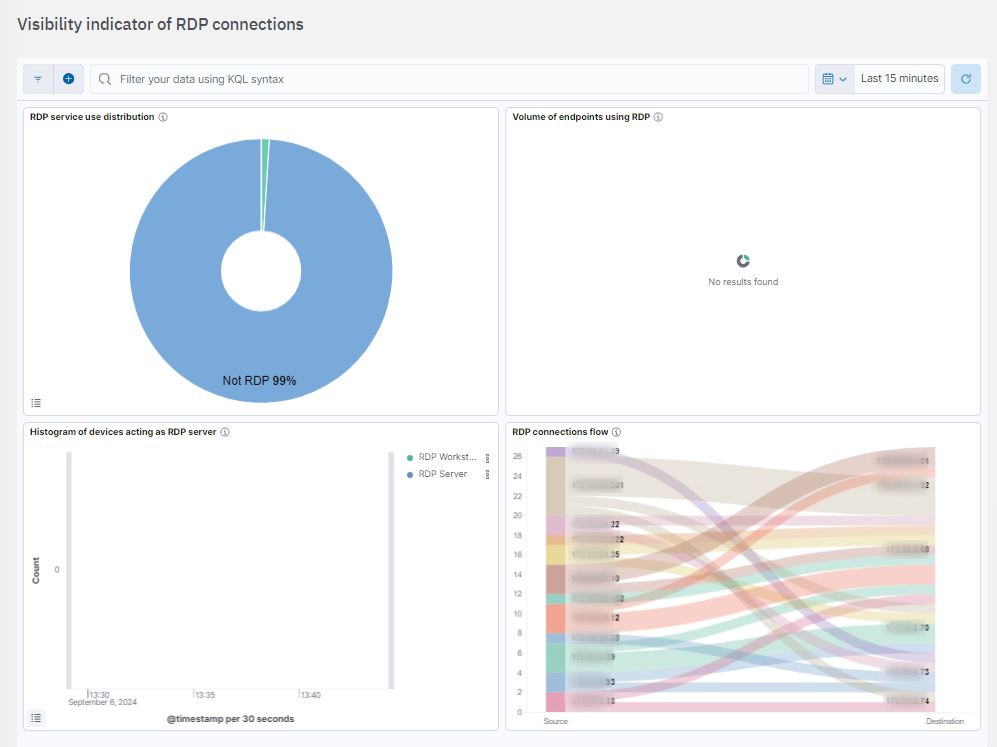
RDP service use distribution: Displays which endpoints are utilizing RDP, who is the server and who is the client.
Volume of endpoints using RDP: Percentage of devices acting as RDP server and distinction between server type endpoints and workstations.
Histogram of devices acting as RDP server: Histogram to distinguish workstations from servers.
RDP connections flow: Visibility of RDP connections established from IP ranges that are not assigned to sysadmin.
3.2.3.6.3.4. Visibility indicator of WinRM connections dashboard
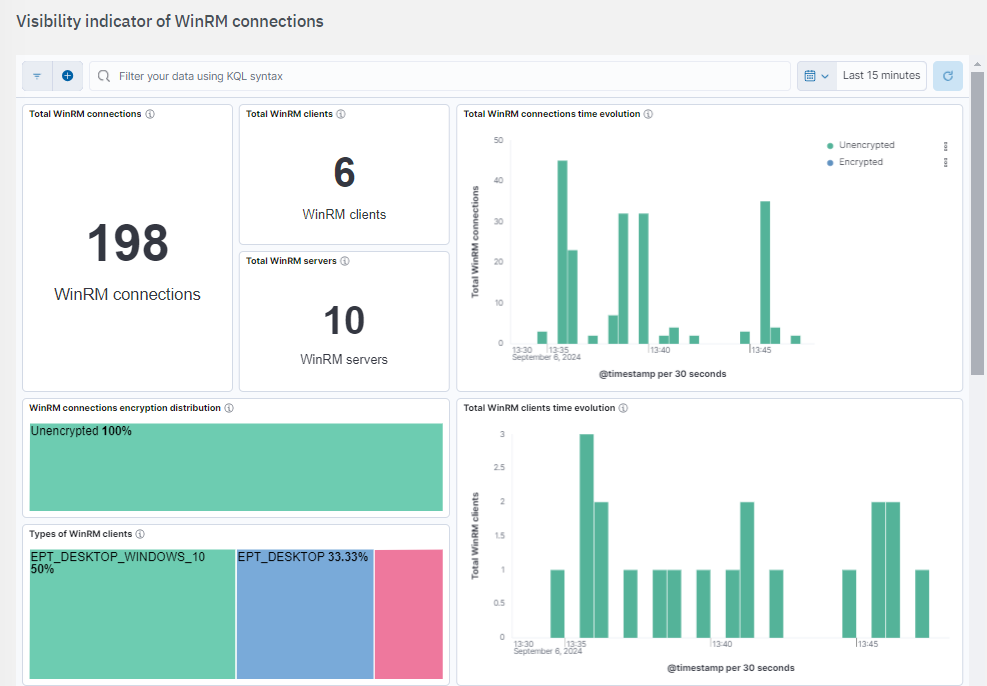
Total WinRM connections: Metric showing total WinRM connections.
Total WinRM clients: Metric showing the total number of unique clients on WinRM connections.
Total WinRM servers: Metric showing the total number of unique servers on WinRM connections.
Total WinRM connections time evolution: Histogram showing the temporal evolution of WinRM connections. The bars are segmented by unencrypted (HTTP, port TCP 5985) or encrypted (HTTPS, port TCP 5986).
WinRM connections encryption distribution: Tree map showing the distribution of the encryption in WinRM connections: unencrypted (HTTP, port TCP 5985) or encrypted (HTTPS, port TCP 5986).
Types of WinRM clients: Tree map showing the distribution of the different types of WinRM clients.
Total WinRM clients time evolution: Histogram showing the time evolution of total unique WinRM clients.
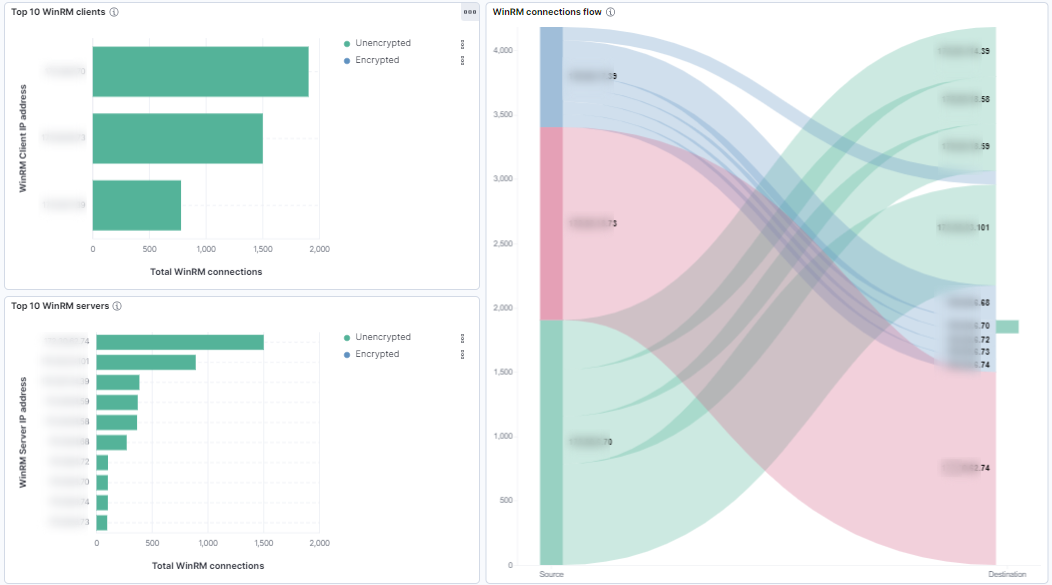
Top 10 WinRM clients: Bar chart showing the top 10 WinRM clients by the total number of WinRM connections. Each bar indicates the WinRM connections for a specific client IP address and is segmented by unencrypted (HTTP, port TCP 5985) or encrypted (HTTPS, port TCP 5986).
Top 10 WinRM servers: Bar chart showing the top 10 WinRM servers by the total number of WinRM connections. Each bar indicates the WinRM connections for a specific client IP address and is segmented by unencrypted (HTTP, port TCP 5985) or encrypted (HTTPS, port TCP 5986).
WinRM connections flow: Sankey diagram showing the flow of WinRM connections between source and destination IP addresses. Each line represents the number of connections from a specific source IP on the right. Different colors indicate the various connections paths.
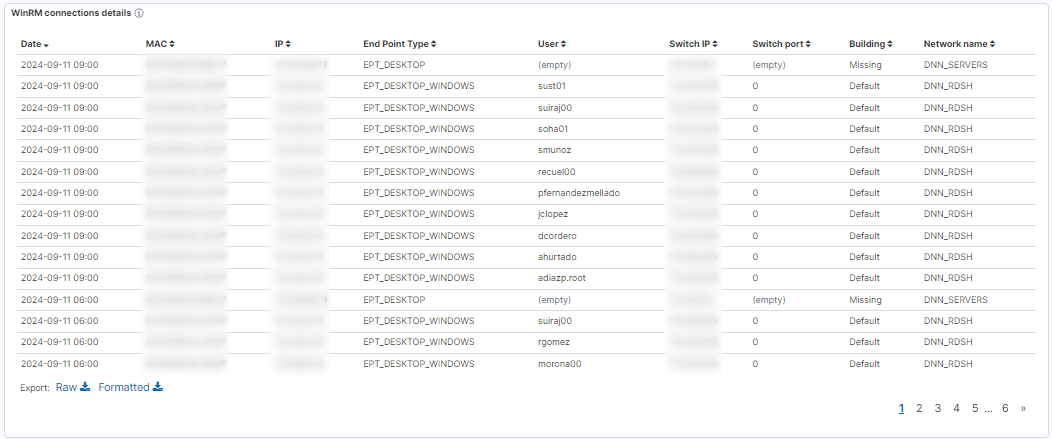
WinRM connections details: Table showing the following information of WinRM connections: dates, device info (MAC, IP, type), user, switch details (IP, port), and building and network names.
3.2.3.6.3.5. Visibility indicator of VNC connections dashboard
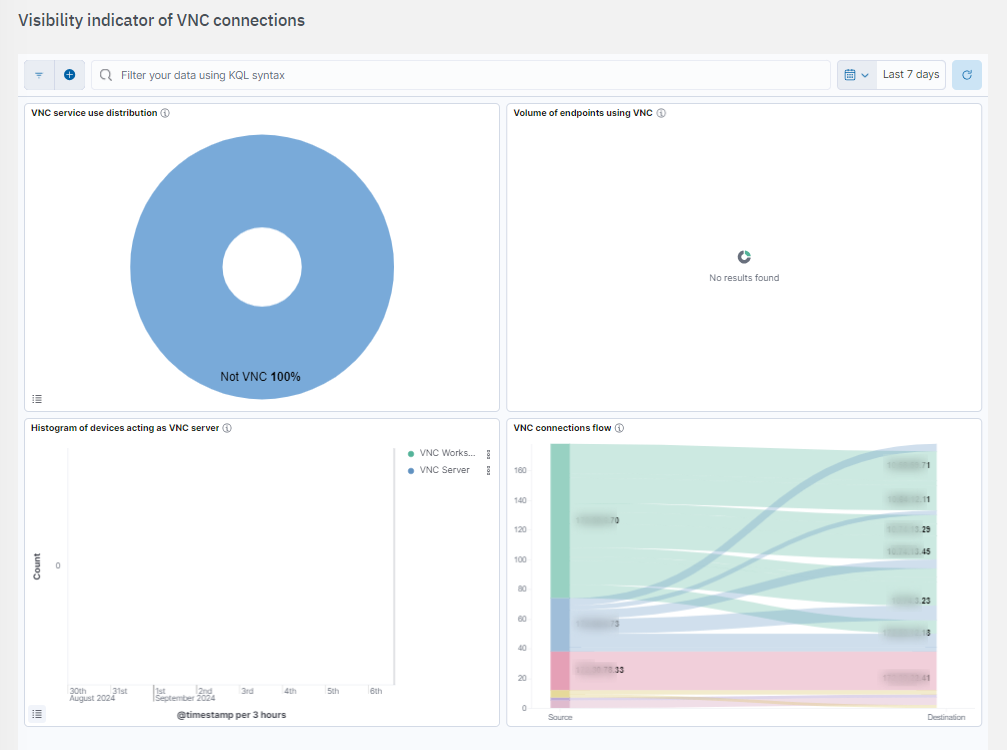
VNC service use distribution: Displays which endpoints are utilizing VNC.
Volume of endpoints using VNC: percentage of devices acting as VNC server and distinction between server type endpoints and workstations.
Histogram of devices acting as VNC server: Histogram od devices acting as VNC server
VNC connections flow: Visibility of VNC connections established from Ip ranges that are nt assigned to sysadmins.