3.2.1. Overview
This section will present an overview of the NextGen Portal. This interface offers an enhanced user experience that will enable users to optimize their workflows with an intuitive and fresh design.
To access the NextGen Portal, use the IP just configured during deployment and you favorite browser.
Open your favorite browser and type https://<ON_Principal_ip_management>/admin. It is important to use /admin to reach the right logon page.
Important
If you are starting from a fresh installation and the SSL certificates have not been configured, OpenNAC Enterprise defaults to using self-signed certificates. This means that on the first access to the Web Portal Administration, you will have to trust the website from your browser as it will be shown as “Not Secure”. To configure your SSL certificates, see Certificates.
The default credentials created when the product is being installed are:
Username: admin
Password: opennac
Note
You should change the password as soon as you are done with the configuration. You can do it directly from the Settings menu or through SSH.
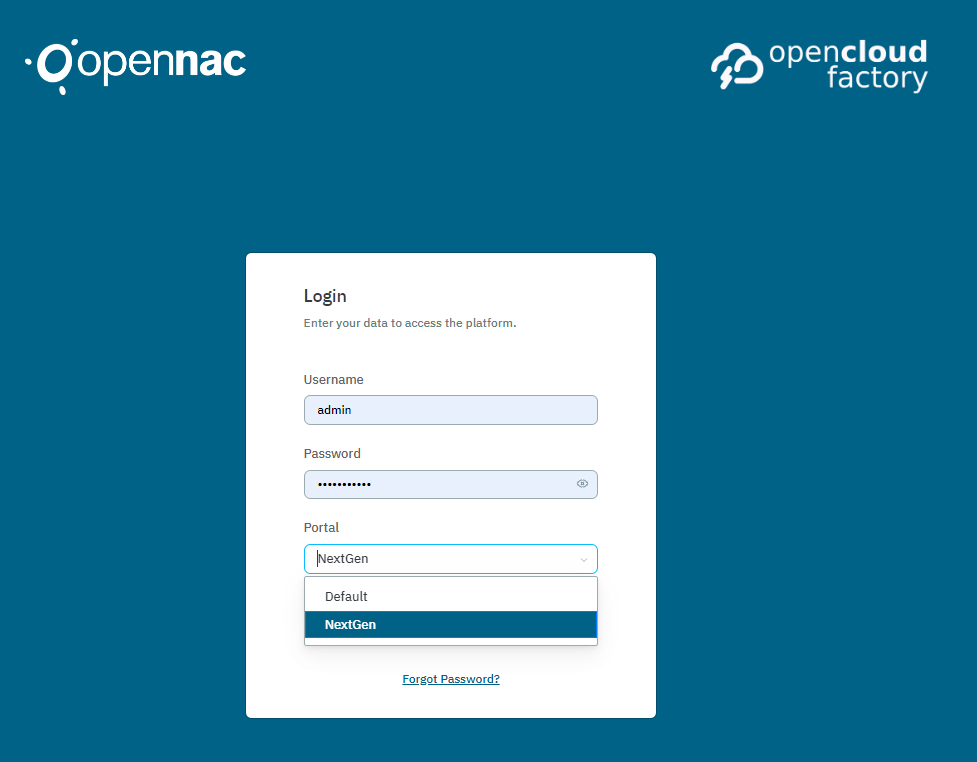
To access the NextGen Portal from the login page, enter your credentials and choose NextGen in the Portal field:
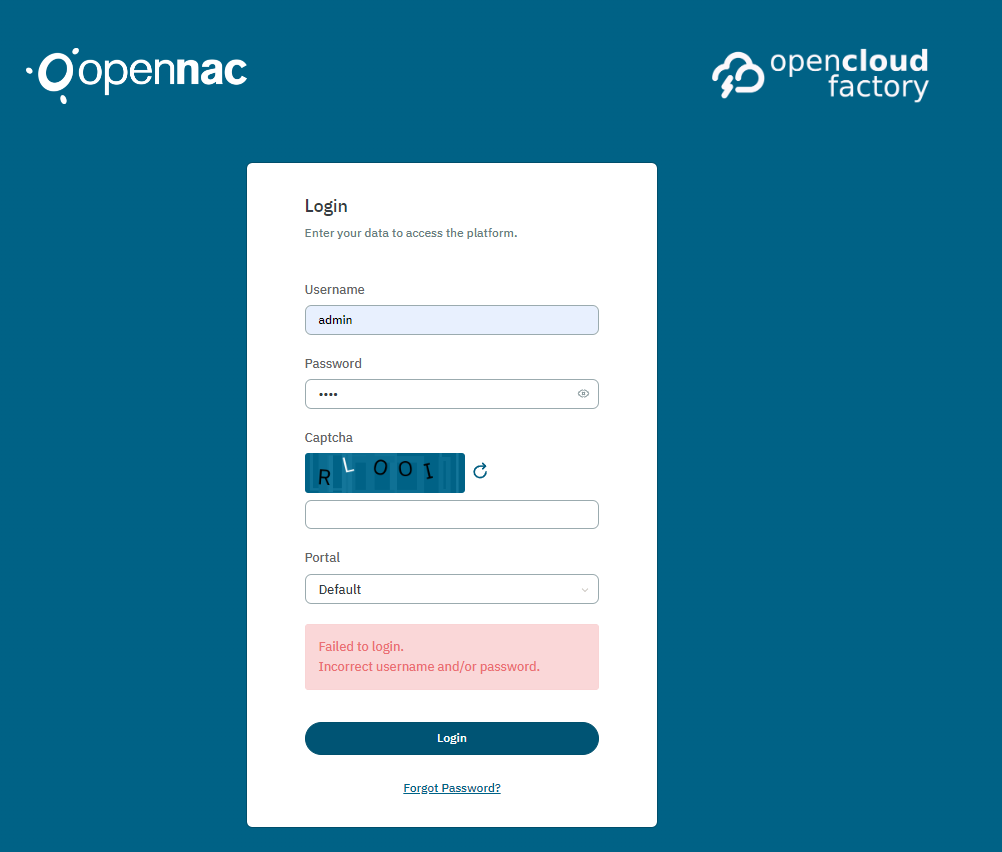
The login is protected with the Captcha security control. This feature is placed to make sure that login attempts are made by humans, therefore reducing the risk of DoS/DDoS, or bruteforce attacks. The Login page will require Captcha if you fail to introduce your credentials correctly:
In case you forgot your password, click on the “Forgot Password?” option:”
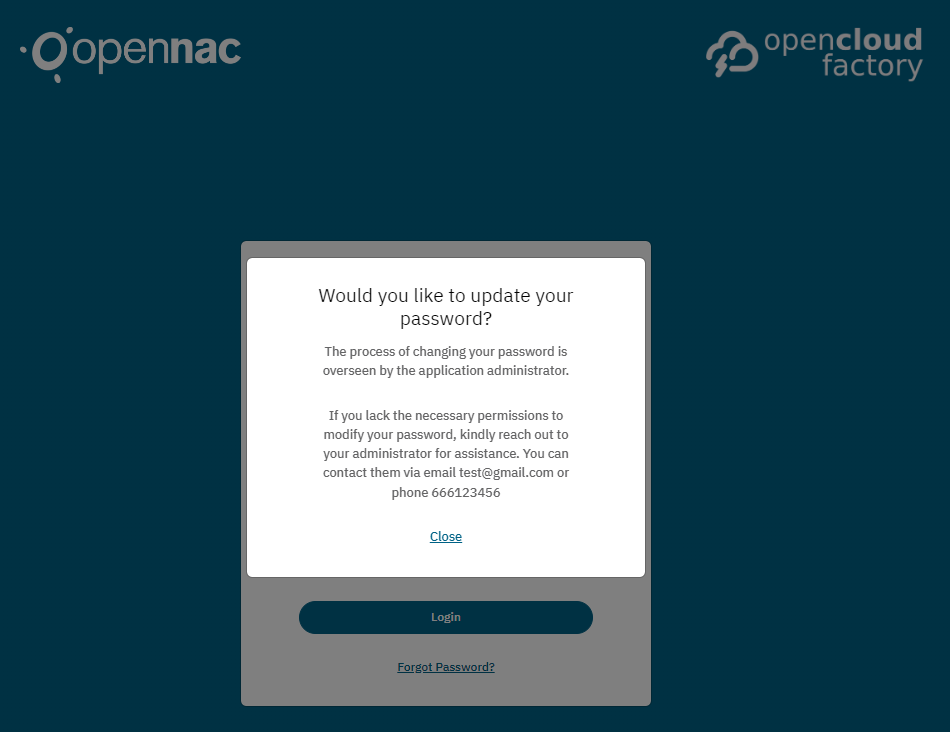
You can configure the email and telephone number displayed on this window in the Configure > Configuration > Configuration vars > General - Frontend section.
If you logged in choosing Default, click on the user dropdown menu located at the upper right corner.
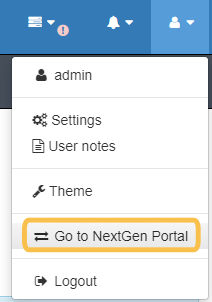
Now, click on Go to NextGen to be redirected to the new console.
3.2.1.1. Settings Menu
This section will explore the settings menu starting from the left corner.
Within this user interface, you can choose between two views: Configure and Operate.

Configure: From this view you can configure your workflows.
Operate: From this view you can operate, apply filters, view and download data, and control your network. No configuration option is available here.
In the following sections, we will explore both views in detail.
You can switch back to the Default Portal by clicking on the monitor icon you can see highlighted in the image below:

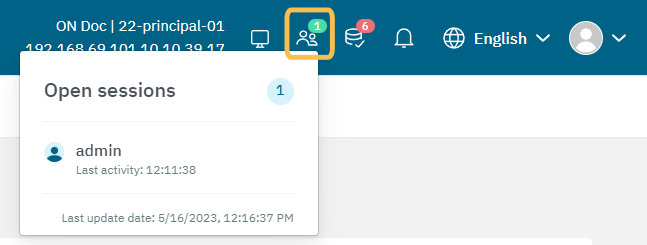
Open Sessions
See users’ activity in the Administration Portal, by clicking on the Open sessions icon. It displays the user name and the time of activity.
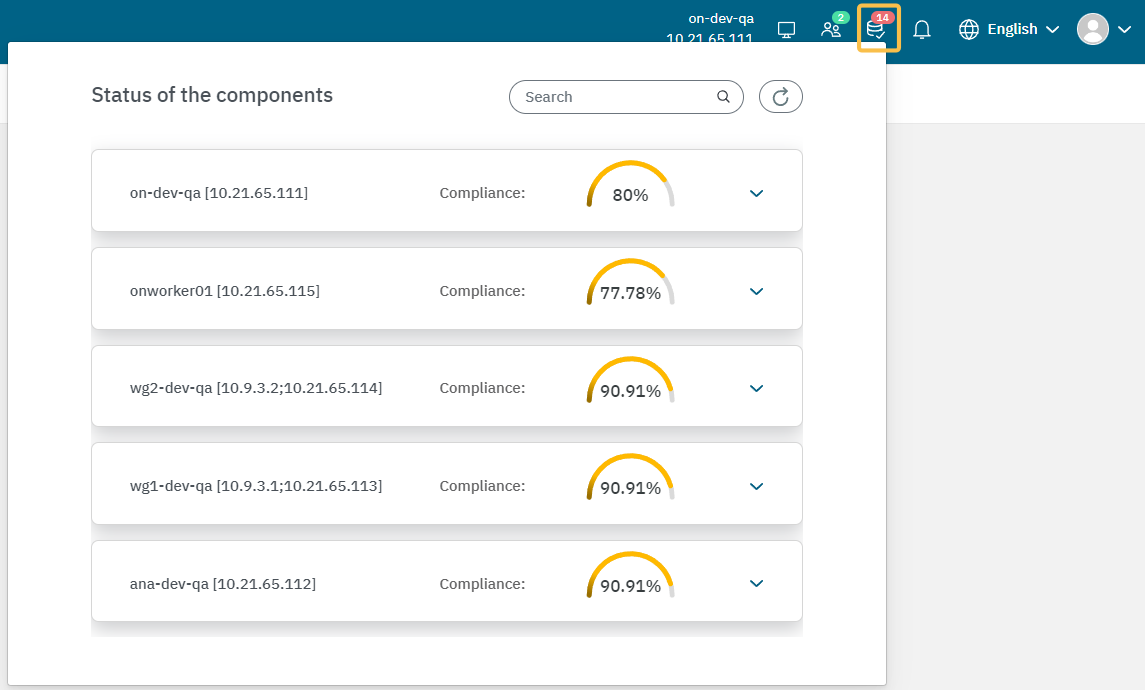
Healthchecks
The Core includes an internal service monitoring feature called Healthcheck which provides real-time status updates on OpenNAC Services, as shown in the picture below.
The Healthcheck dropdown displays the component along with its IP address, facilitating the retrieval of information for SSH access when needed.
These monitoring checks are customizable, allowing users to disable or enable them, and make internal modifications such as adjusting check intervals, specifying the process to be monitored, setting thresholds, and more.
See the details of each OpenNAC infrastructure component, by clicking on their arrow.
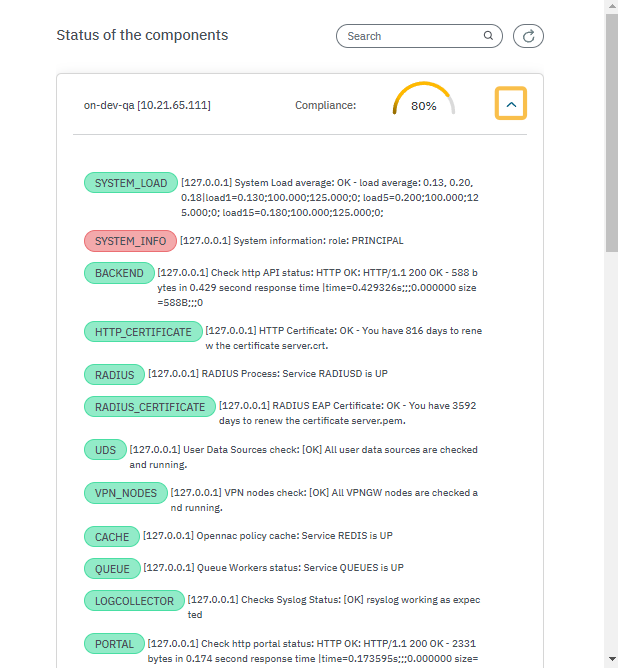
Consult the complete list of the Healthchecks performed by the system in the Platform Administration section.
From the /usr/share/opennac/healthcheck/healthcheck.ini path you can change monitoring parameters and its options on every server. Monitoring checks are based on API queries. ON Core includes an API RESTfull that allows monitoring the main components from outside of the product OpenNAC API.
Note
If you are opening a support case, please attach the expanded information from the healthcheck, as it provides the most detailed explanation of the alert.
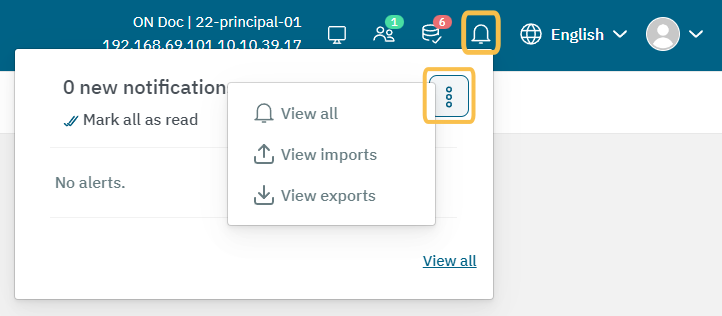
Notifications
By clicking on the bell icon, you can see the notifications, and also view imports and exports.
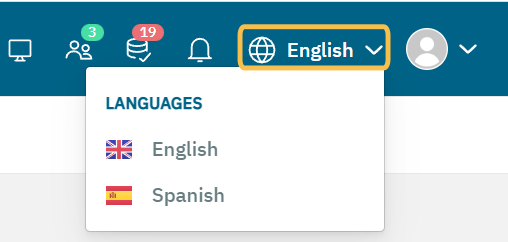
Language selector
You can switch the interface language to English or Spanish. You can configure a default language in the dropdown menu as described in the following step.
Dropdown menu
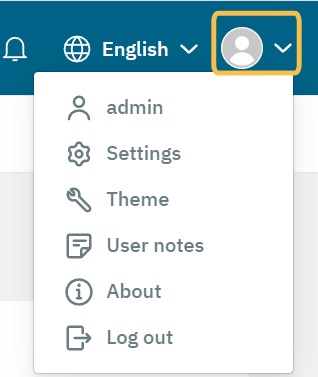
Admin: Displays the user currently logged.
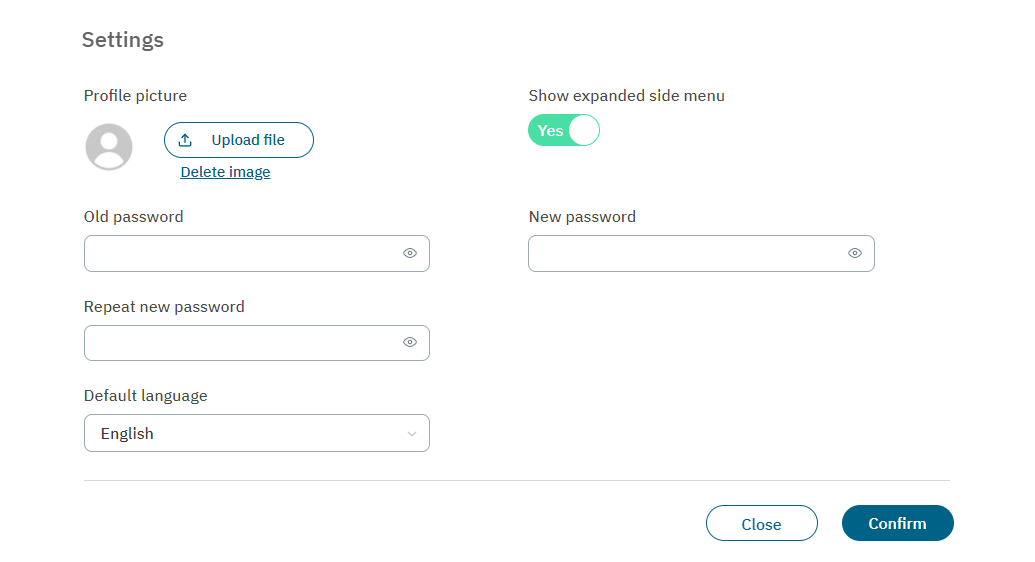
Settings: Here you can upload a profile picture, change your password, and choose between an expanded or contracted side menu. Additionally, here you can define the default language for the Administration Portal display independently from the web browser language.
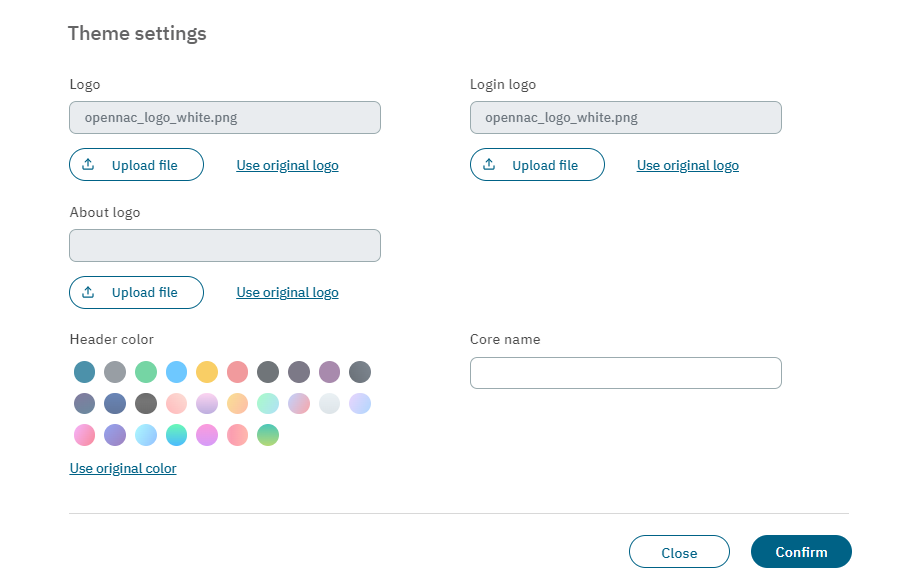
Theme: Allows you to upload a logo for the login page, another for the “About” window, and one for the header. You can also change the header color, and customize the Core name displayed in the header.
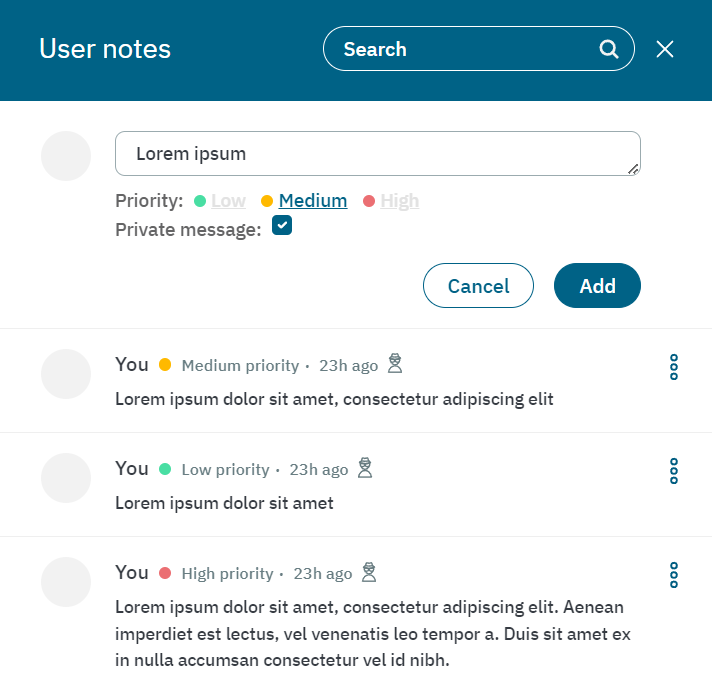
User Notes: You can create user notes as private or public messages and categorize them according to their priority. It can be a useful tool for keeping track of work or personal tasks and priorities.
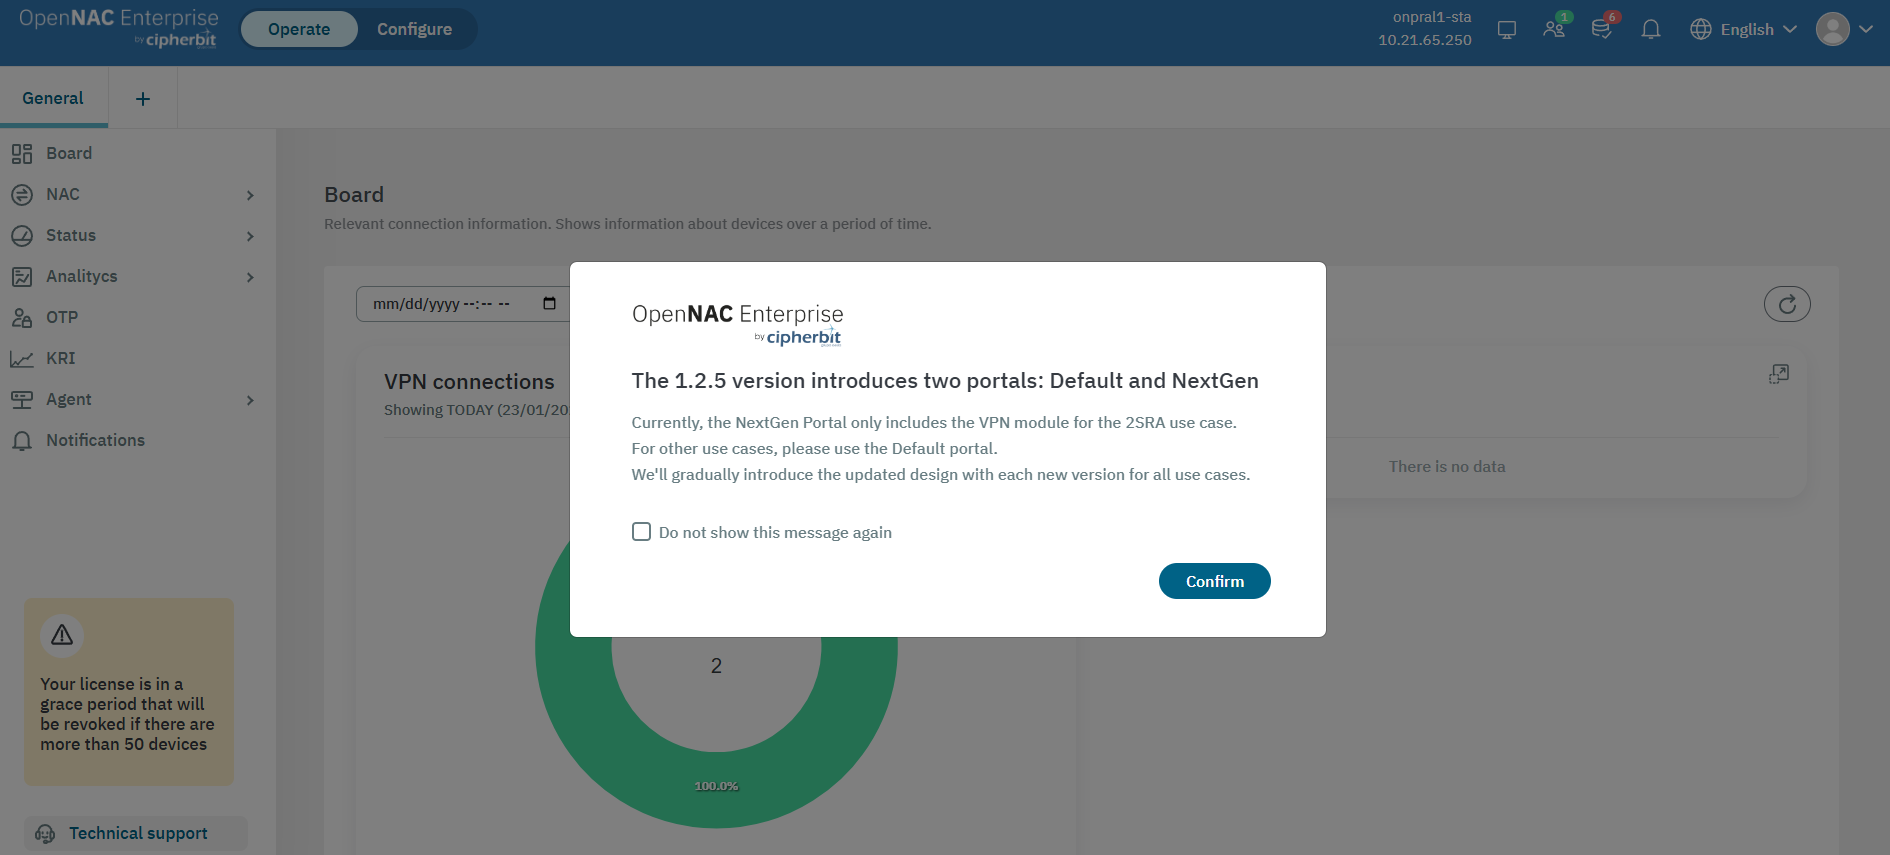
About: By clicking on it, it will display the current software version and the service license information.
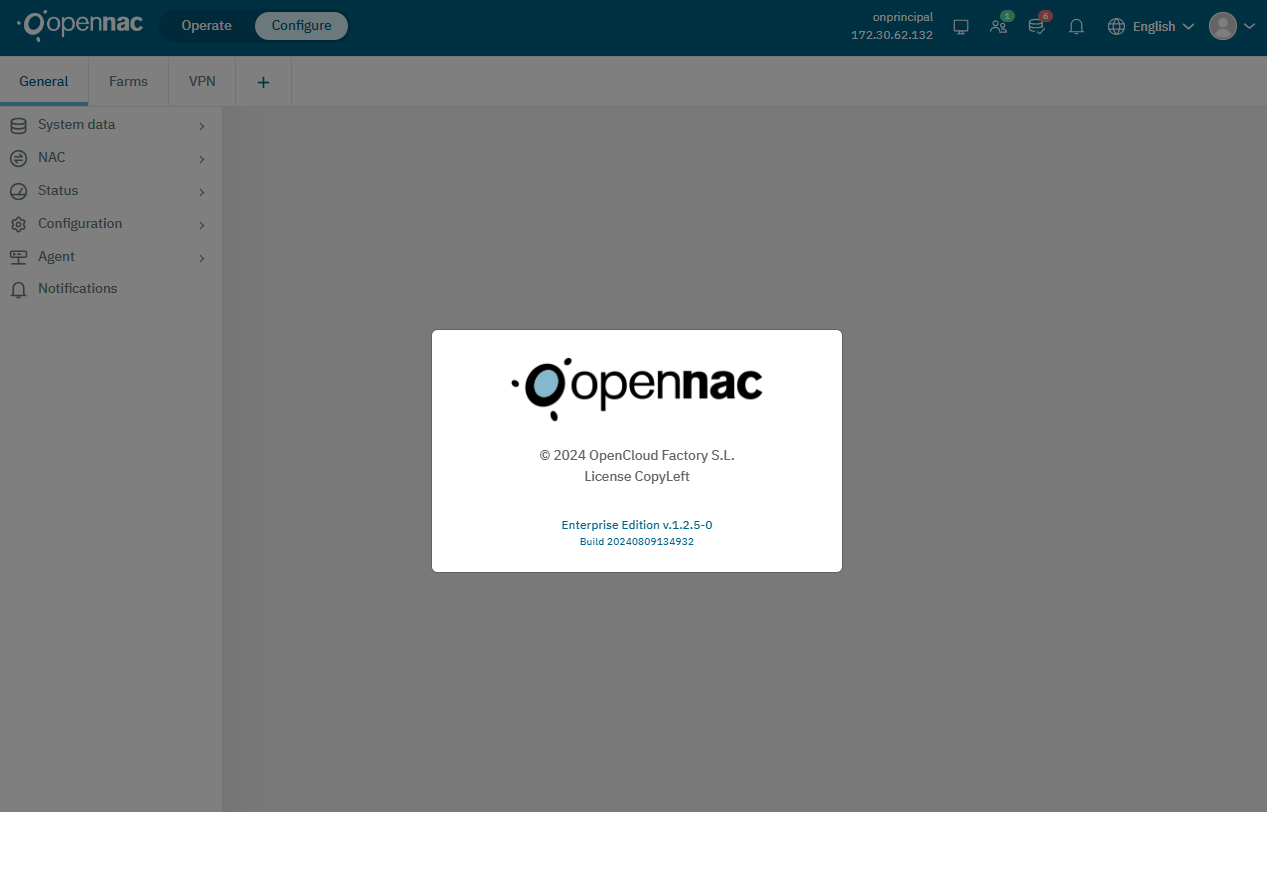
Log out: Here you can log out of the current session.
3.2.1.2. Managing tabs
Note that as a default setting, the interface opens with two tabs: General and VPN.
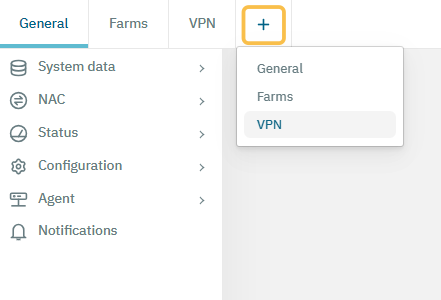
Next to these two tabs, you will find a “+” icon. Clicking on it, allows you to open new tabs and choose between General and VPN options.

This feature enables you to keep multiple tabs open, facilitating the configuration and monitoring of different sections.
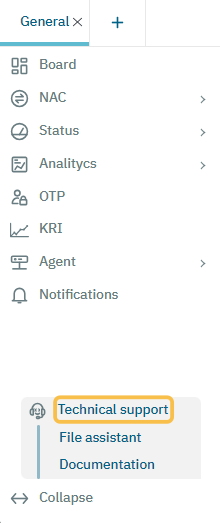
3.2.1.3. Technical support
By clicking on Technical support, you can see the following options:
3.2.1.3.1. File assistant
The File assistant is a tool that enables the creation of backup copies of the files on your computer, which can be analyzed later to identify any issues.This can provide valuable clues during the troubleshooting process, helping to identify the root cause of the problem.
By clicking on File assistant it will display the following view:
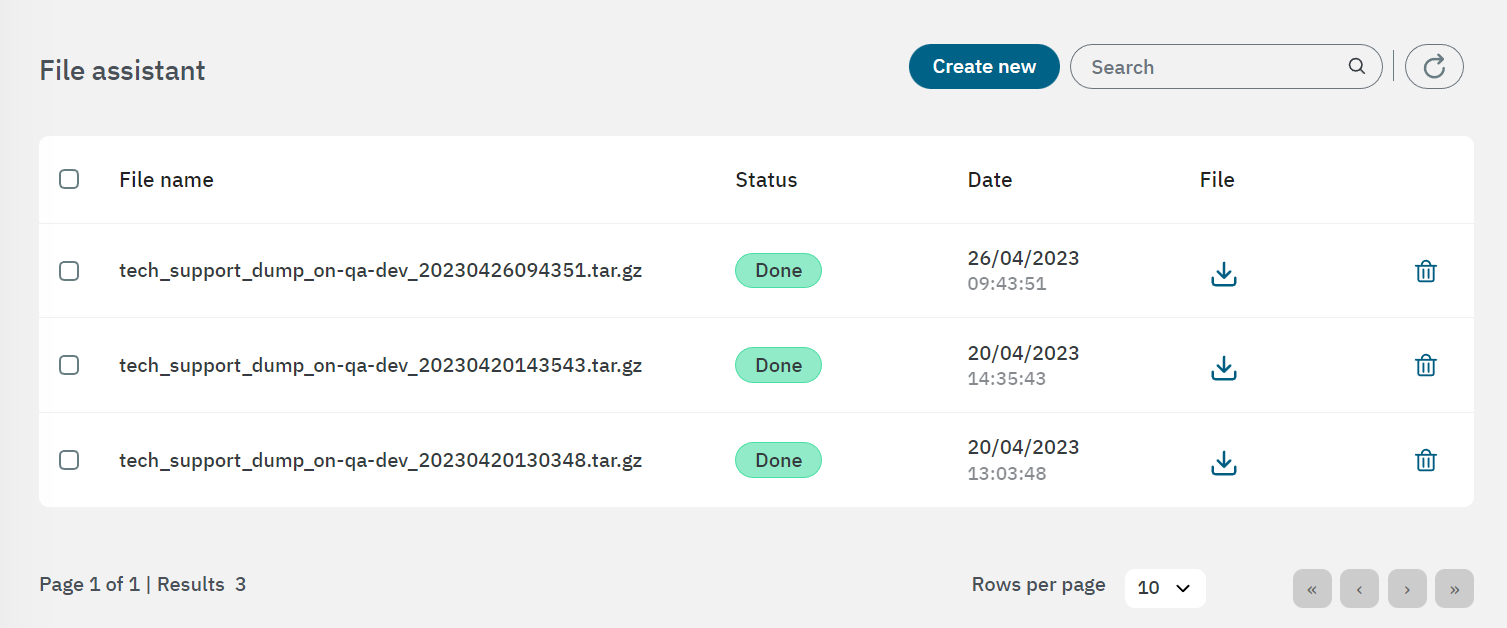
Create new: By clicking on this button, OpenNAC Enterprise will internally run the tech_support_file.sh script. This will lead to a “Loading” notification and to the creation of the backups.
The state will display “In Process”. Be patient until you see the compressed file “tech_support_dump_<hostname>_<datetime>” with the status set to “Done”.
Once the backup is done, you will see a download icon in the File column. Click on it to start the download. This may take several minutes as it can contain several GiB of information.
Here is what you will find inside the compressed file:
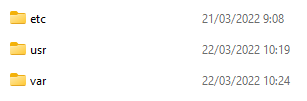
Inside the etc folder you may find important files.
The openNAC code, php files and others are on the usr directory. We can find the installed packages and its version on /usr/share/opennac/api/data/tech-support/rpm-qa.txt. There is also a compressed file with a dump of the database on /usr/share/opennac/api/data/tech-support/backup-v<version>.el8.noarch-<date>.sql.gz.
The logs files are inside the var folder. This is an important part because it is likely that you can find the error in these files.
3.2.1.3.2. Documentation
Click on Documentation to be automatically redirected to the OpenNAC Enterprise Technical Documentation.