4.4.1.3. Architecture
This section outlines the necessary nodes for the use case, offering essential information on its architecture, including components, simplified architecture, and recommended sizing.
4.4.1.3.1. Components
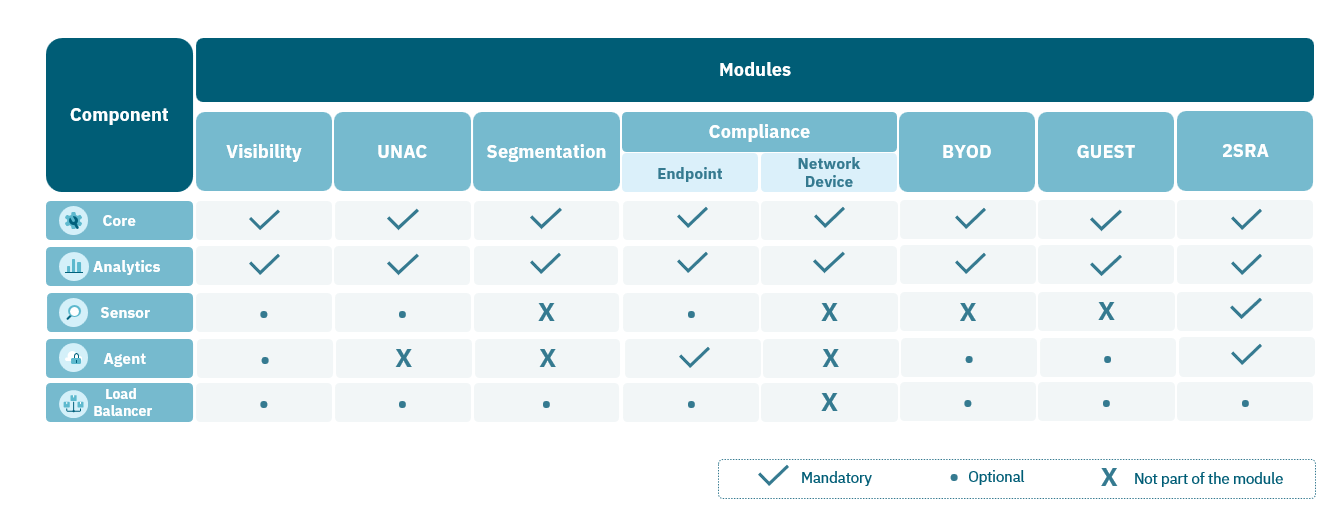
The EPC module is made up of two components called CORE and ANALYTICS.
ON CORE: Implements an administration portal from which it manages the rule engine and its CMDB. Provides a Rest API.
ON ANALYTICS: It is a reporting tool that integrates all the solution’s logs and provides dashboards and a search engine.
The different components used for Network Device Compliance at ON Analytics are:
Logstash: This tool will allow us to collect and process the data we receive from the Core through Filebeats. In Logstash, the data is filtered and shaped and then sent to Elasticsearch.
Elasticsearch: When the data has been modeled with Logstash, it reaches Elasticsearch where it is indexed and stored so that the user can execute queries and Kibana can generate the dashboards from this data.
Kibana: Kibana will generate the dashboards with different types of charts and tables from the data it extracts from Elasticsearch.
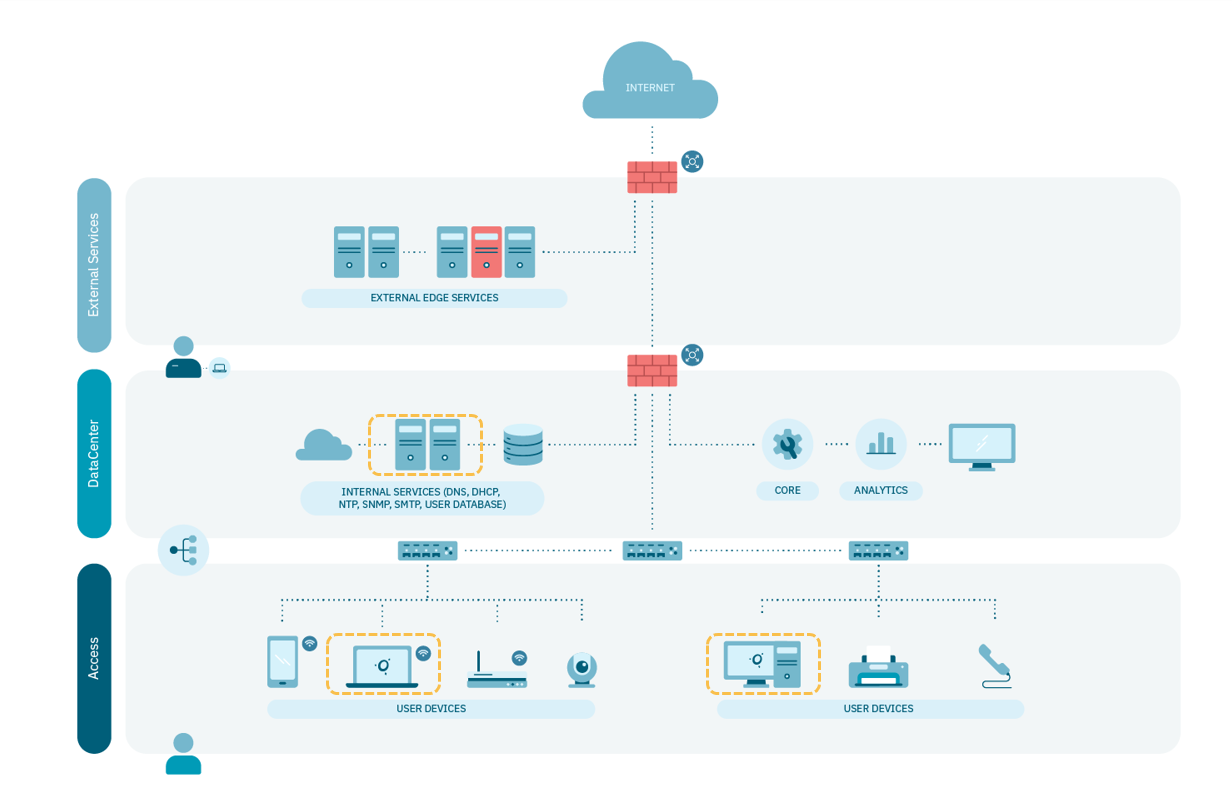
4.4.1.3.2. Standard Architecture
The End Point Compliance use case is applied on the access zone -where the endpoints are located.