1.4.1. Visibility
This section will introduce the Visibility use case, going through its explanation, benefits, steps, and sources.
1.4.1.1. What is visibility?
Visibility is the module of OpenNAC Enterprise that discovers, quantifies, and qualifies the assets connected to the corporate network.
This comprehensive understanding provides a solid foundation for establishing security controls, essential for managing associated risks effectively. Furthermore, visibility enables organizations to discern communication flows within the network, contributing to the identification and management of potential attack surfaces.
1.4.1.2. Visibility in 6 Steps
Our Visibility workflow establishes 6 steps:
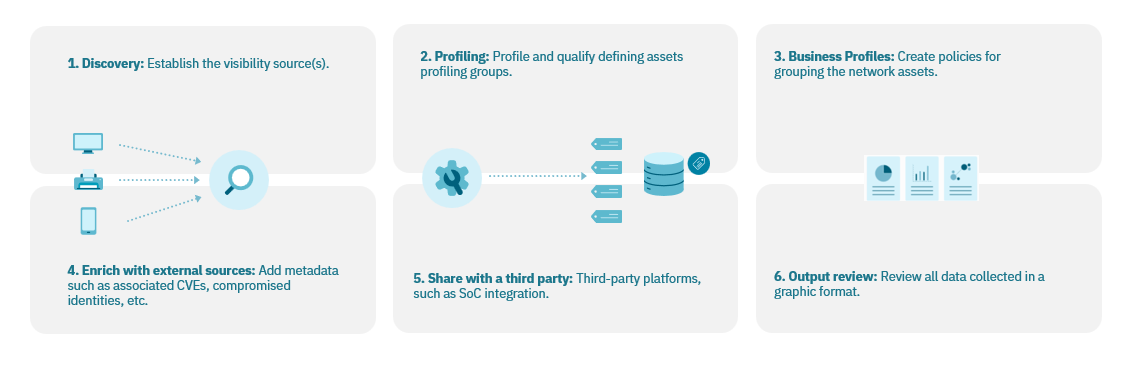
Discovery: we have to discover and quantify the devices.
Profiling: profile and qualify defining assets profiling groups. The main characteristic of the profiling phase is the Tag assignment. You should familiarize with the Tag concept to understand the profiling process.
Business Profiles: create groups of devices from the characteristics that we know of each one, the most common is grouping by typology.
Enrich with external sources: Add metadata such as associated CVEs, compromised identities, etc.
Share with a third party: Third-party platforms, such as SoC integration.
Output Review: to visualize results we have predefined visibility dashboards with very specific and easy-to-read information.
1.4.1.3. Visibility Sources
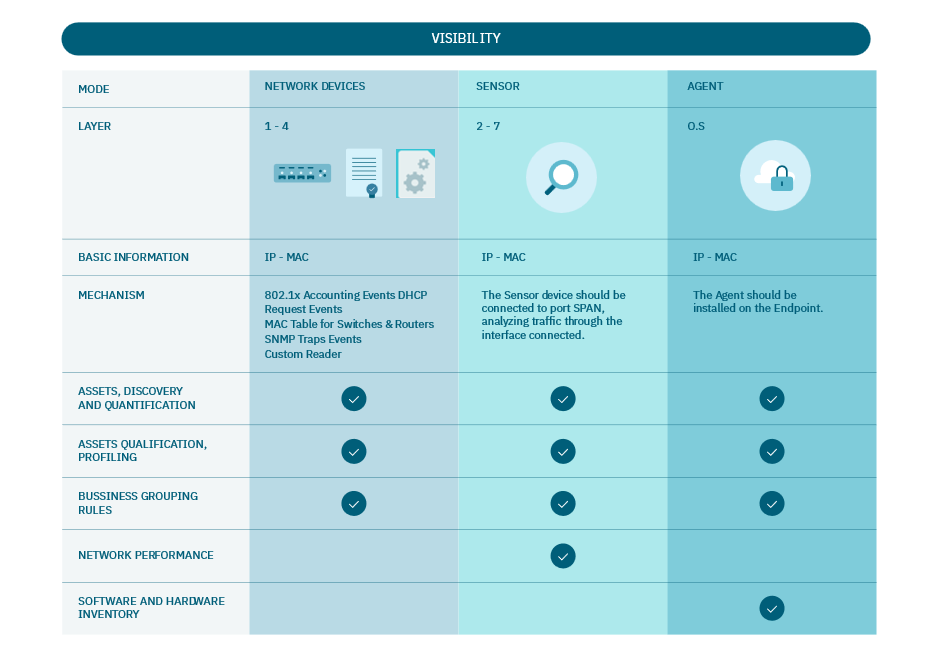
We consider three main methods to generate Visibility:
Network devices mode
Sensor mode
Agent mode
Note
The Visibility Methods are not mutually exclusive; they complement each other. You can utilize all three simultaneously. The more sources you integrate, the richer the context and the more detailed insights you gain about each device connected.
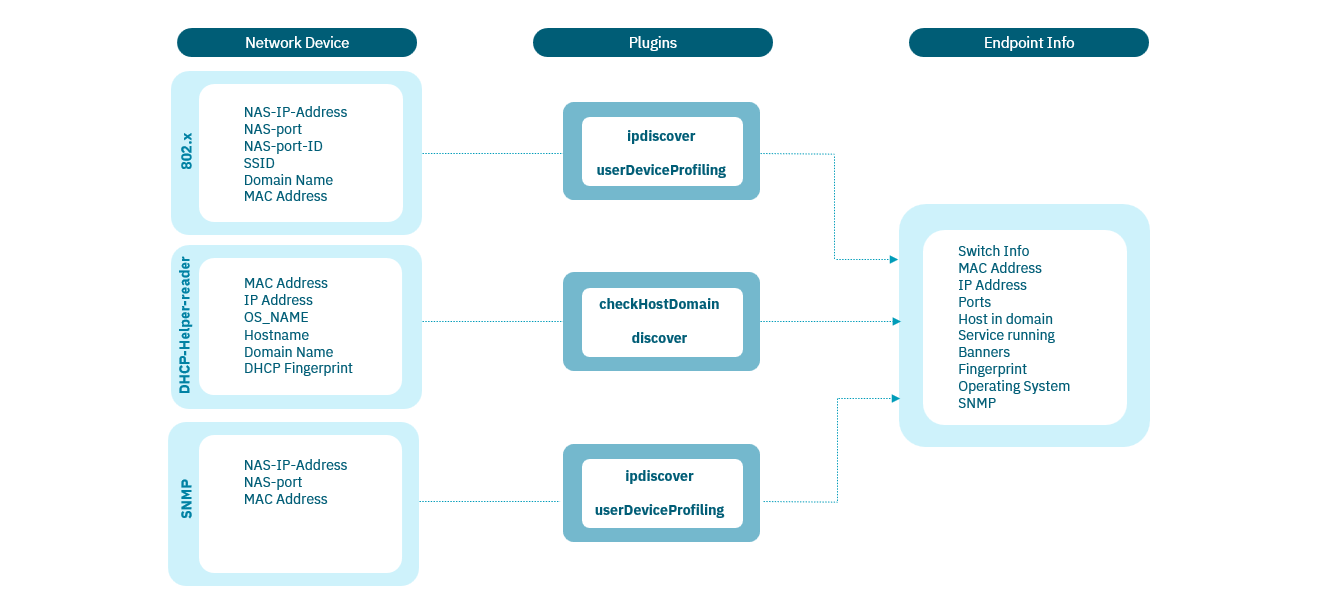
1.4.1.3.1. Network Devices
The Network Devices Mode operates by monitoring the protocols currently transiting the network and enabling additional protocols as necessary.
1.4.1.3.1.1. Requirements
You need to meet the following requirements to use the Network Devices method:
ON Core: Deployed and configured.
ON Analytics: Deployed and configured.
Switch: Configured with the necessary methods (802.1x, Flows and/or SNMP Traps) pointing to the system so that it can collect information.
Routers: In layer 3 routing network devices (normally acting as default GW) the IP Helper or DHCP Relay can be configured.
1.4.1.3.1.2. Information collected
By using the Network Device method to perform network visibility, you will be able to collect the following information:
Time: When was the last time the device was connected/disconnected.
IP Address: IP address assigned to the connected device.
MAC Address: MAC address of the device.
Device Name: The device name can be collected using DHCP Reader information.
IP address of the network device: IP address of the network devices where the device is connected.
MAC address of the network device: MAC address of the network devices where the device is connected.
Physical Ports: Network device interface where the device was connected and discovered.
Device type: Through the profiling rules and its discovery mechanisms, the system can identify the type of device.
MAC Vendor: Vendor assigned to the physical address.
Open Ports and Banners: The open ports and banners of the device.
TAGS: With plugins such as Discovery and profiling rules it is possible to identify open ports in the asset and its type, the system uses TAGS to manage all this information in a flexible way. TAGs can also be added through the Networks configuration. We can also define networks and assign default TAGs to the devices that are part of this network. This can be very useful to add information about the location of these devices.
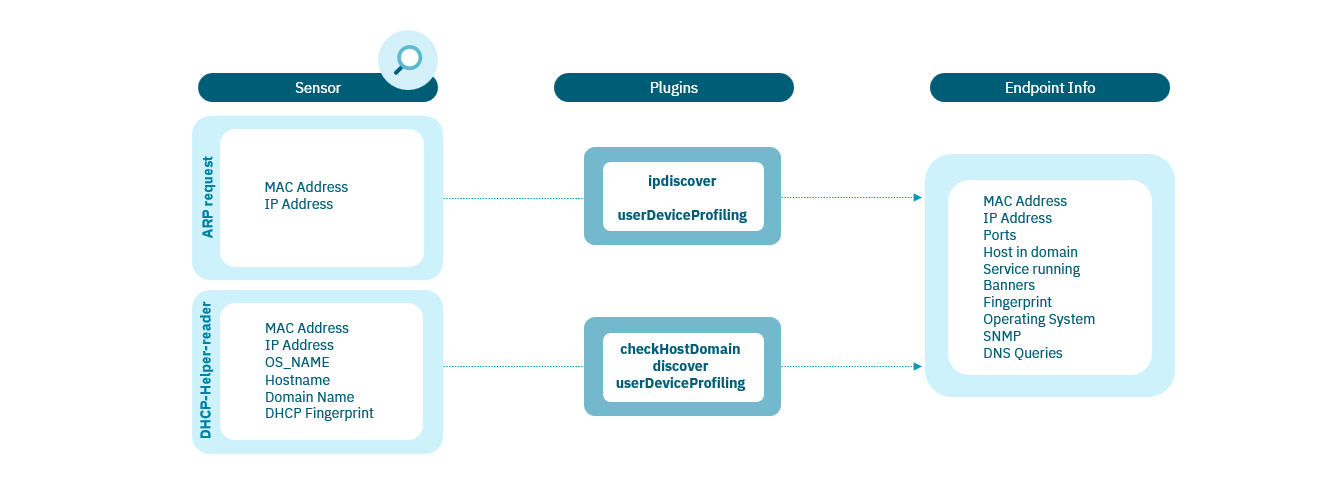
1.4.1.3.2. Sensor
The Sensor Mode performs a deep packet inspection to learn network protocols used in information flows.
1.4.1.3.2.1. Requirements
You need to meet the following requirements to use the the Sensor method:
ON Core: Deployed and configured.
ON Analytics: Deployed and configured.
Switch: Configured with Port Span where ON Sensor can capture and extract information from the network.
ON Sensor: Deployed and configured.
1.4.1.3.2.2. Information collected
By using the Sensor method to perform network visibility, you will be able to collect the following information:
DHCP: IP assignment traffic based on the DHCP protocol.
ARP packets: Detection of the ARP traffic that has been generated in the network.
Tunneled Traffic: Traffic origin/destination of the traffic that is generated in a tunneled way.
SMB: Samba traffic for file sharing.
Kerberos: Traffic generated by the Kerberos authentication protocol.
Radius: Traffic generated by the Radius protocol for the authentication and authorization of network devices.
Ports and services: List of ports and services accessed by the devices
IRC: Traffic based on the Internet Relay Chat communication protocol.
Connection States: Identify the state of a connection between machines.
SSH: ON Sensor extracts information regarding the origin and destination of SSH-type connections.
HTTP/HTTPS: HTTP/HTTPS traffic of the network.
DNS: Through DNS queries we can identify which are the main websites or servers visited.
SSL: The sensor extracts information related to the SSL traffic that is being generated on the network.
SMTP: By listening to this protocol you can view email traffic, analyze spikes and network devices related to those spikes.
FTP: Through this protocol, you can perform actions regarding file transfer policies.
VLANs: The sensor is capable of identifying the traffic categorized by Vlans.
OT: Currently the system is capable of collecting information related to Operational technology-type protocols in industrial environments such as PLC communications.
1.4.1.3.3. Agent
The Agent Mode extracts complete software and hardware information from the device.
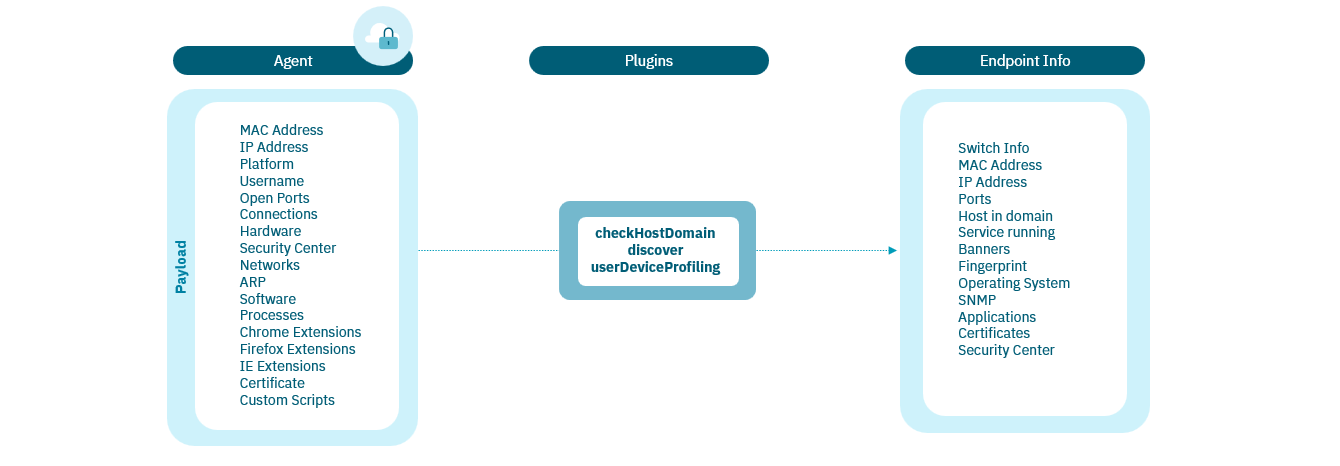
OpenNAC Enterprise discovers the devices and launches plugins to get information about each connection made on the network. The responses of the devices provide the detail of each device associated with the connection.
1.4.1.3.3.1. Requirements
You need to meet the following requirements to use the the Agent method:
ON Core: Deployed and configured.
ON Analytics: Deployed and configured.
ON Agent: Agent (installable) deployed on the end-points.
ON Portal: Optionally it may be necessary to have ON Portal (with Captive-Portal) to receive payloads from agents. This is important in environments where you are exposed to the internet or in DMZ areas where, for security reasons, we do not want the ON Core to be found. In this way we can isolate the ON Core components and continue receiving the payloads from the agents.
1.4.1.3.3.2. Information collected
By using the Agent method to perform network visibility, you will be able to collect the following information:
Software: Display of all the software installed on the device, as well as the current version of said software.
Hardware: Information related to the hardware installed in the computer, peripherals, networks.
Processes: A list of the processes that are running on the network devices is obtained.
Microsoft Security Center: Information about the computer’s security status based on the Microsoft Security Center settings (Antivirus, Firewalls, Updates, etc.). (Windows)
Certificates: List of certificates installed on the device. (Windows and MacOS).
WIFI connections: List of Wi-Fi connections learned by the device. (Mac OS)
Browser extensions: List of extensions installed in the main browsers.
Session events: Information about user sessions of the operating system.
Active users: Users with an open session in the operating system.
1.4.1.4. Policies
A Policy is a set of hierarchical rules based on technical requirements that operates similarly to a firewall.
It begins by declaring the most specific rules, descending to more general ones. Each Policy is composed by the following parameters:
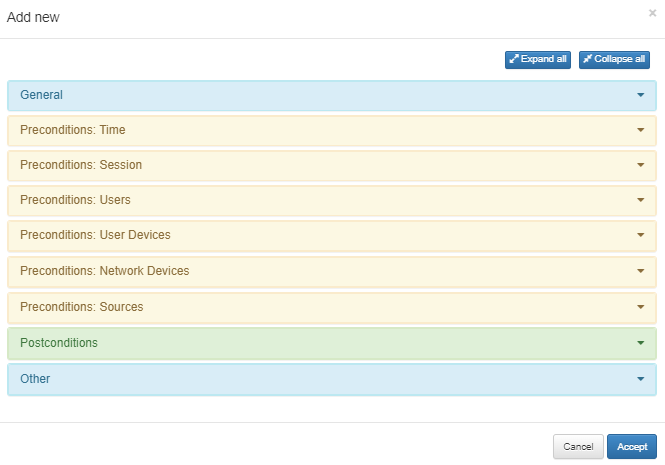
1. General Section: Enable the policy adding a name and a comment to it.
2. Preconditions Section: From this section you can add conditions before the authentication occurs, including Connection Time, Users, User and Network Devices involved, and Authentication Type (Sources).
3. Postconditions Section: Allows adding conditions after authentication has taken place, such as VLAN assignment, Security Profiles or ACL on an ingress port, plugins and their parameters, and notifications.
4. Other Section: Allows defining a message for the network access request, automatically learning the user’s devices, and defining tags for them.
The policy engine has two main principles to consider to avoid mistakes and unexpected behavior:
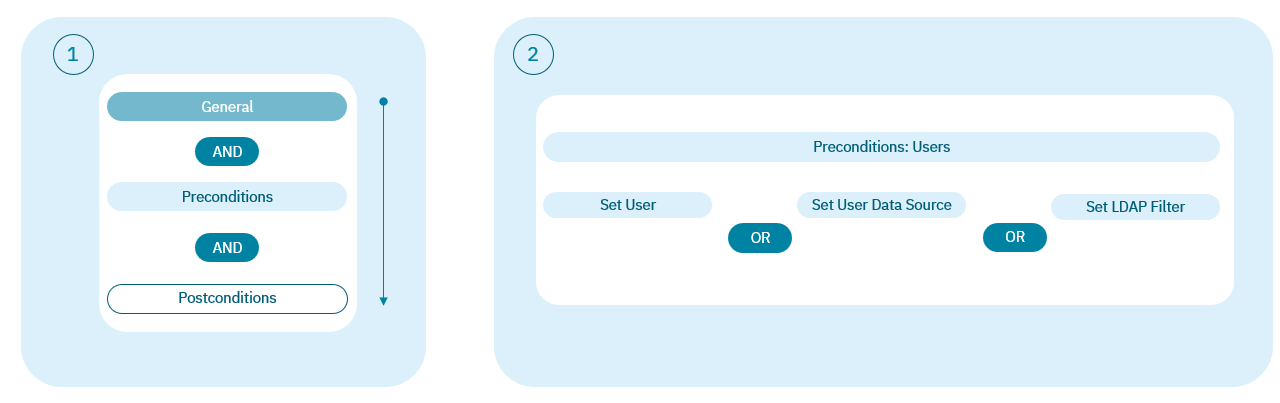
Principle 1: Vertical parameters act as a logic “AND” during policy evaluation. For instance, if you set “Preconditions: Users” and “Preconditions: Sources” both must match with the user device event to match with that policy.
Principle 2: Different source in “Preconditions: Sources” will act as a logic “OR” because each event only has one source. This will allow the user to create an unique policy for more than one source event. “Precondition: Users”, “Precondition: User devices” and “Precondition: Network devices” only allow to set one of the options. For instance, if we try to add an user and after an user group in “Precondition: Users” in the same policy, user group will overwrite the user condition.
1.4.1.5. Plugins
All three Visibility Sources will attempt to establish the IP-MAC pair and, from that, launch queries through plugins such as the discover plugin or the profiling plugin.:
Discover plugin: Launches instructions to get information on each connection on the corporate network, the result depends on the device.
Profiling plugin: Analyzes the information collected from each asset to determine its type.
Once OpenNAC collects all the characteristics of the connections and stores them in the form of Tags in the CMDB. These tags pass through the OpenNAC engine and analyzing the collected data determines their typology, risk value, criticality, etc.
Lastly it quantifies (how many are there) and qualifies (what type are they).
As the main deliverable, after all the data analysis, an updated inventory is generated in real-time with all the connections made in the network. Each connection has its associated details.
Some of the relevant information shown is: MAC, IP, IP Switch, AP, switch port, VLAN, hostname, user, last access, tags, device typology, etc.