3.2.3.2.1. Sessions
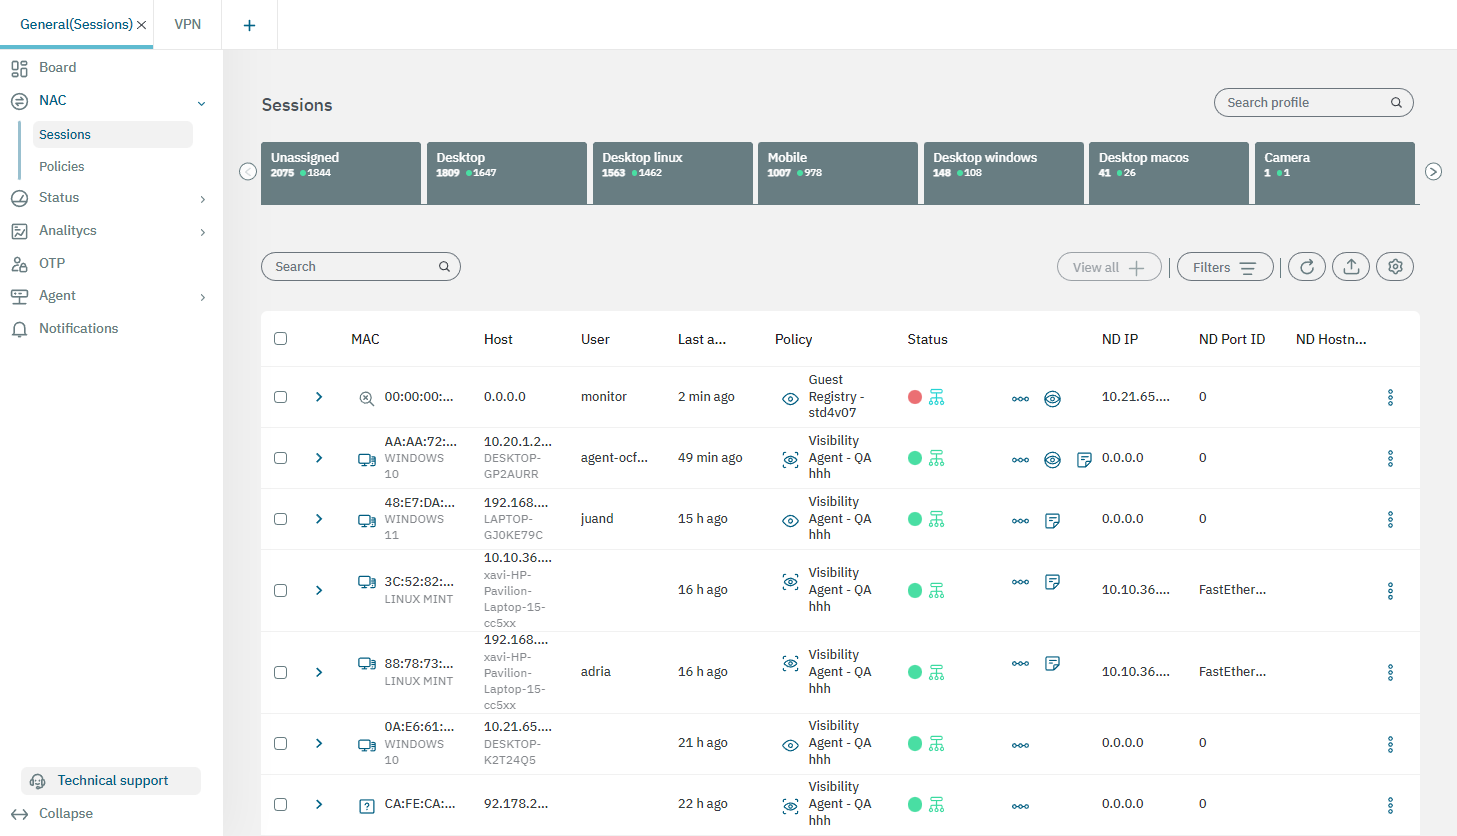
In Sessions, we can see the latest status of the connections made on the network and detected by the system. For each of these connections, we will have information related to the device and the connection itself: status, source, policy, etc.
This section will help to understand how to navigate and operate this view.
Starting with the navigational panel upper portion of this view, we have the business profiles.
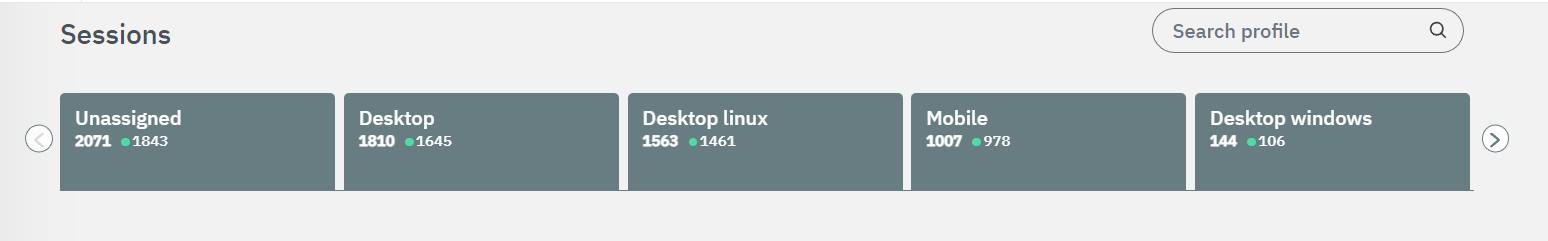
Using the arrows, you can move right or left to see all business profiles configured to be displayed in this view.
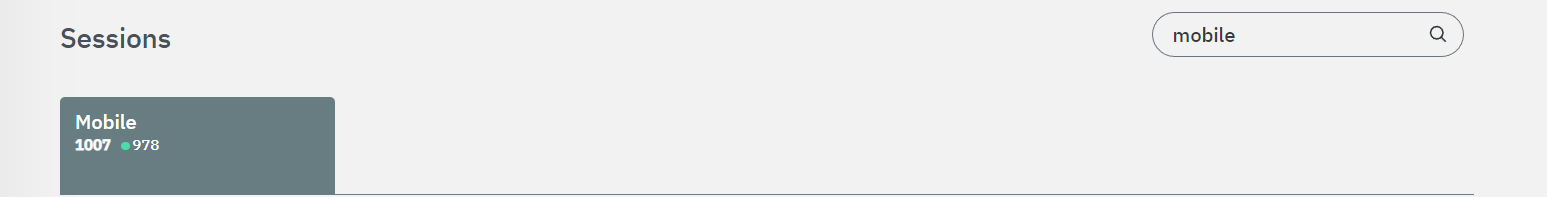
The Search Profile field allows you to search for a specific profile. If you search for “Mobile” for example, it eliminates the remaining business profiles, displaying only the one you want to visualize in the sessions table.
3.2.3.2.1.1. Toolbar
In the following row, fields and buttons help you quickly find specific devices, users, and policies, and configure this view. Let’s explore the toolbar from left to right ->.

Search: This field allows you to search users and devices.
View all: If you have previously filtered o selected one business profile for visualization, clicking on this button wil display all business profiles again.
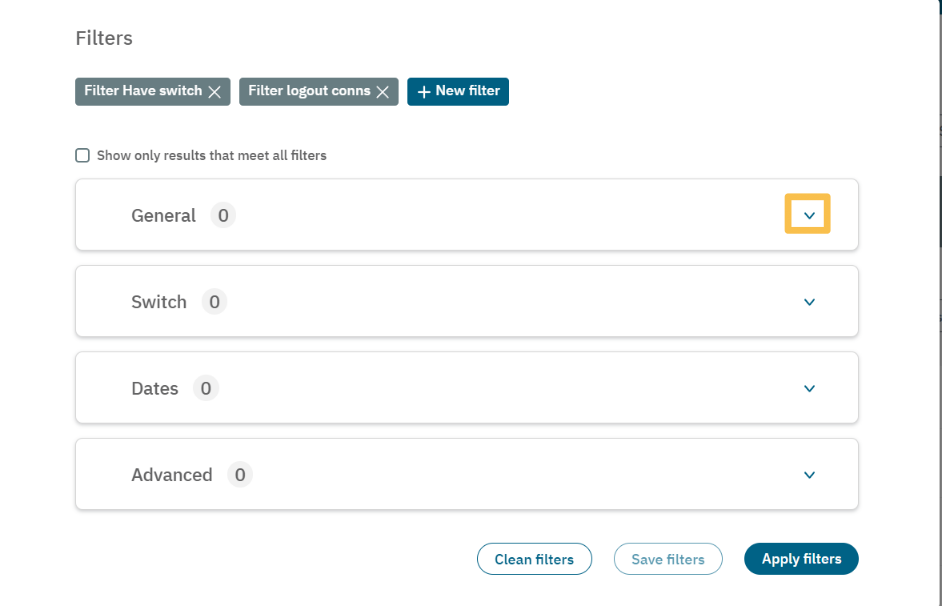
Filters: It opens the following configuration window. By clicking on the arrow, you can expand a filter to apply advanced configurations.
Refresh: Click on this button to refresh the view.
Export: You can export the entire database or a subset by filtering the table by the desired value.
Configuration: The last button allows you to customize the table.
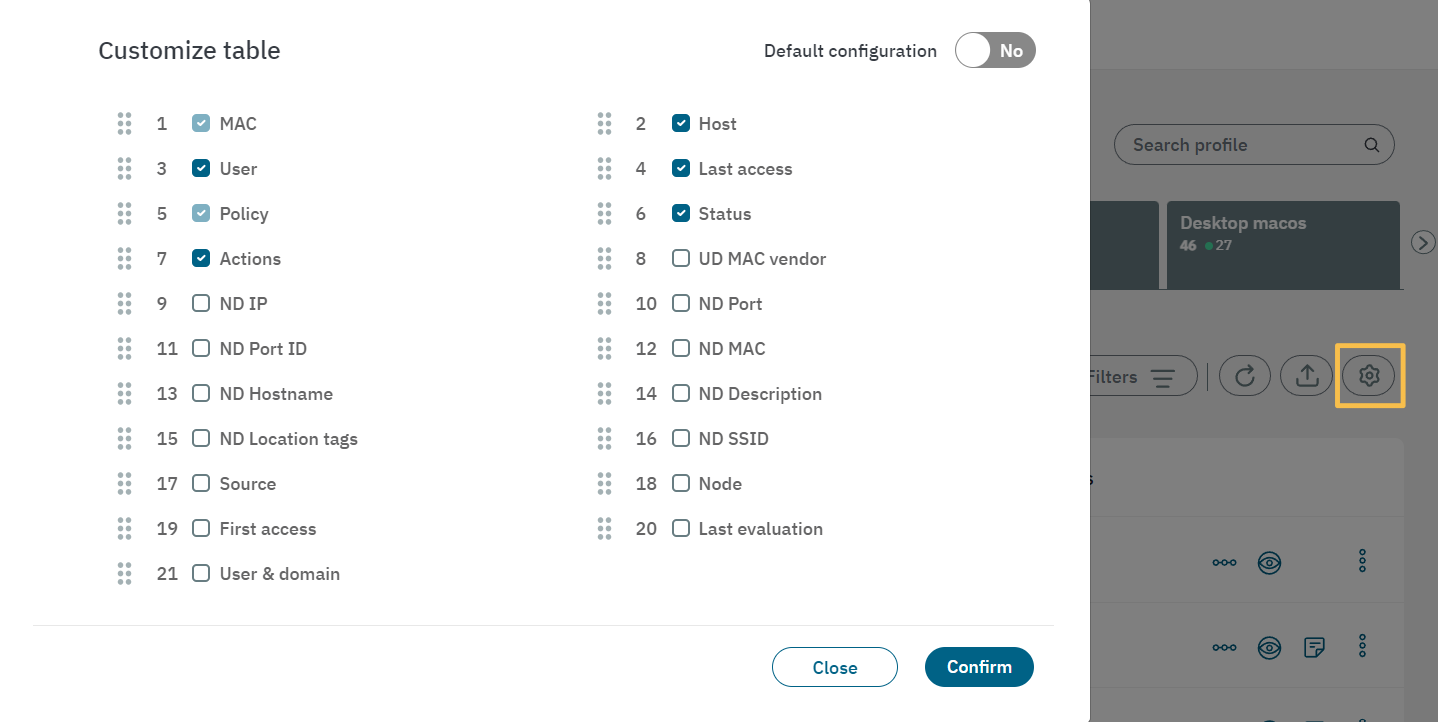
Whatever you choose here, will be displayed in the sessions table. As you can see, the elements selected in this image are the ones that compose the heading of the table. Customize it at your convenience.
3.2.3.2.1.2. Sessions table
The Sessions table displays the following columns. Click on the arrow located at the beginning of each row to expand information about a connection.
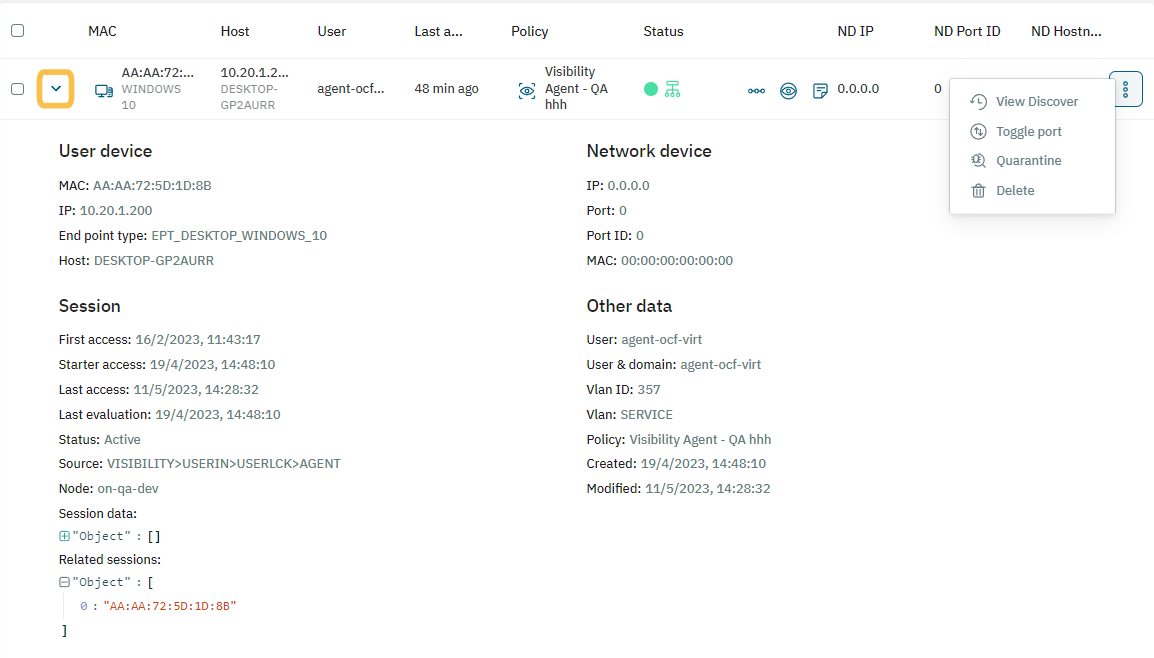
It will display details about User device, Network device, Session, and Other data. It is a quick way to visualize connection data.
At the end of each row, clicking on the three-dot icon provides options to:
View discover: It opens the Analytics discover board.
Toggle port: Toggle port the selected device.
Quarantine: Quarantine the selected device.
Delete: Delete the device from the table.
If you want to visualize further details, right after the status column, there are three three icons called view detail, v**iew policy evaluation**, and view payload (the last one, only when there is an Agent installed).
3.2.3.2.1.2.1. View detail
The first visualization option is an horizontal three-dot icon that expands the session detail.
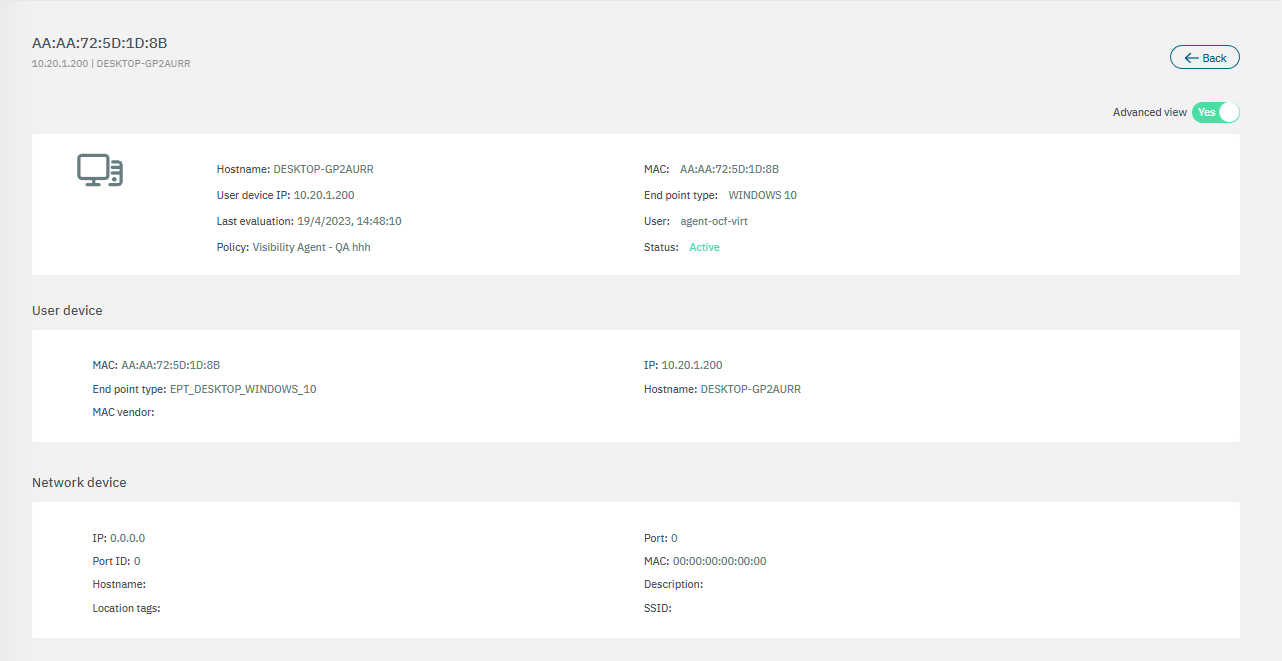
As you can see above, there is a flag called Advanced view. It changes the tags visualization you will see later in this topic. The first information modules of this window display user device and network device details.
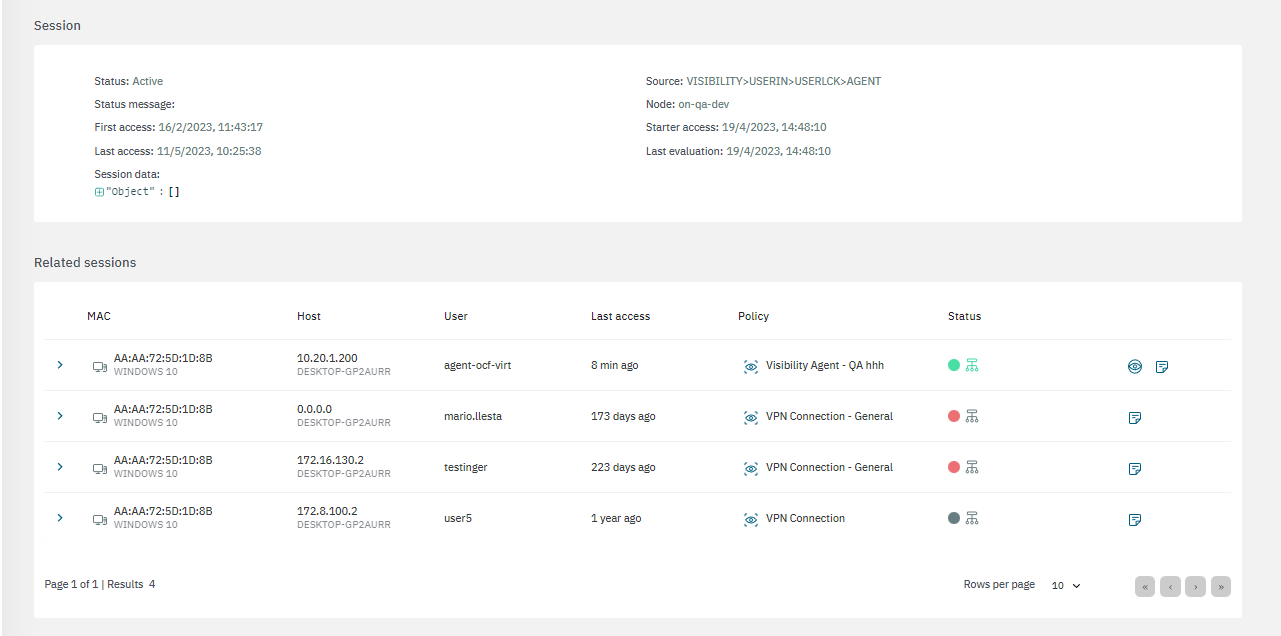
The following information modules display session and related session details.
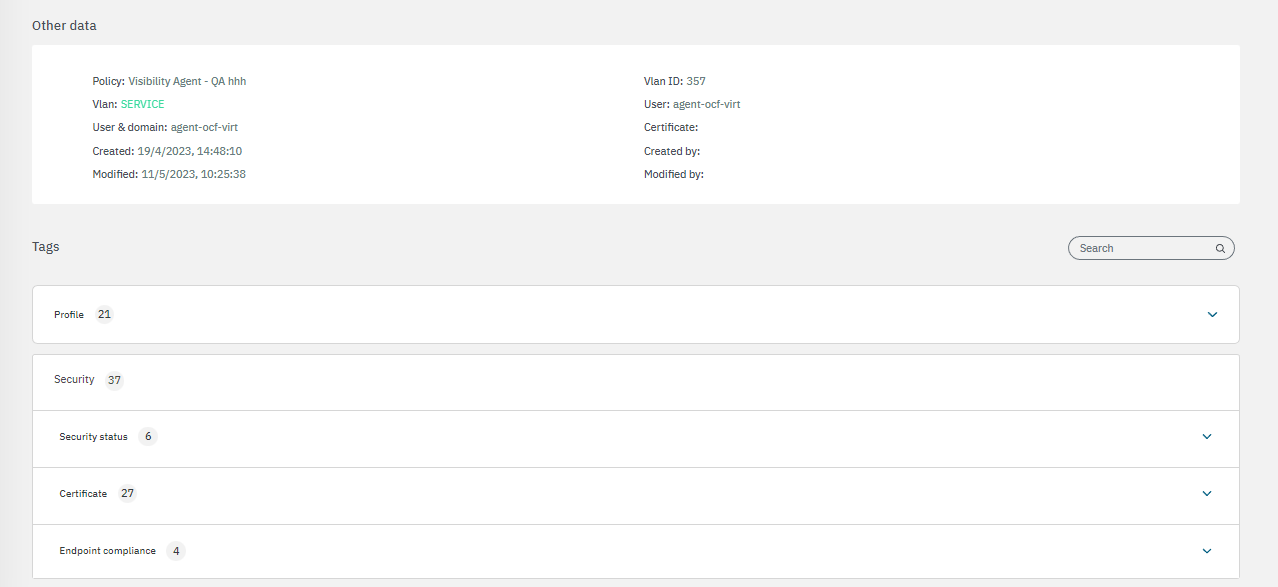
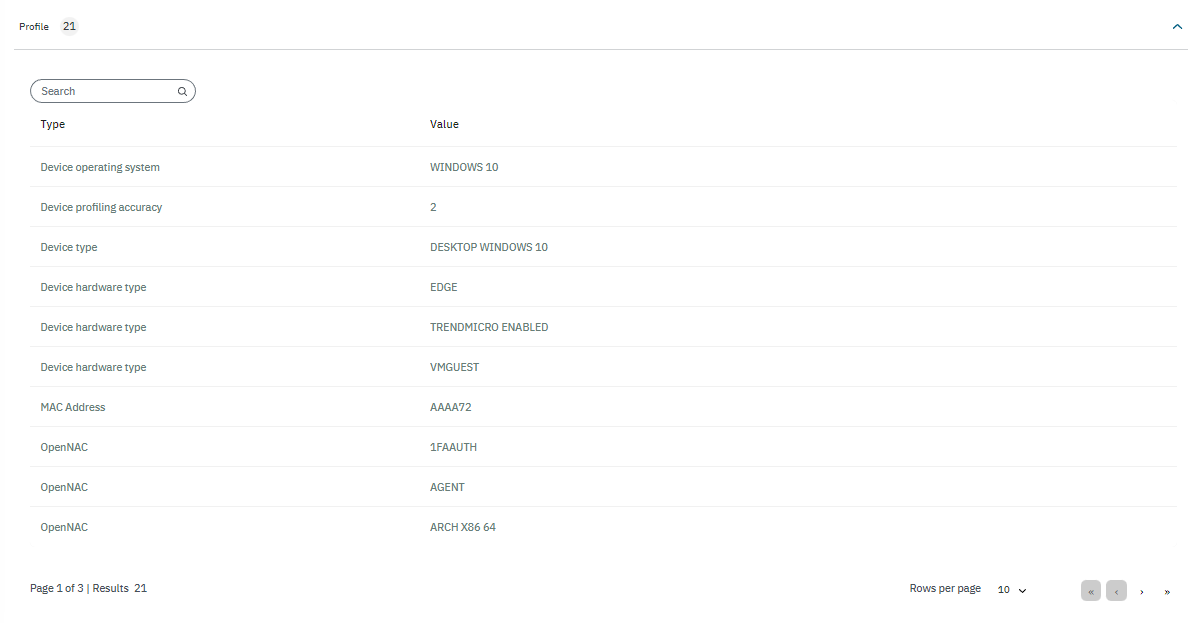
The last two information modules display other data and the session tags. Tags will be displayed depending on the type of view you choose in the Advanced view flag
Advanced view:
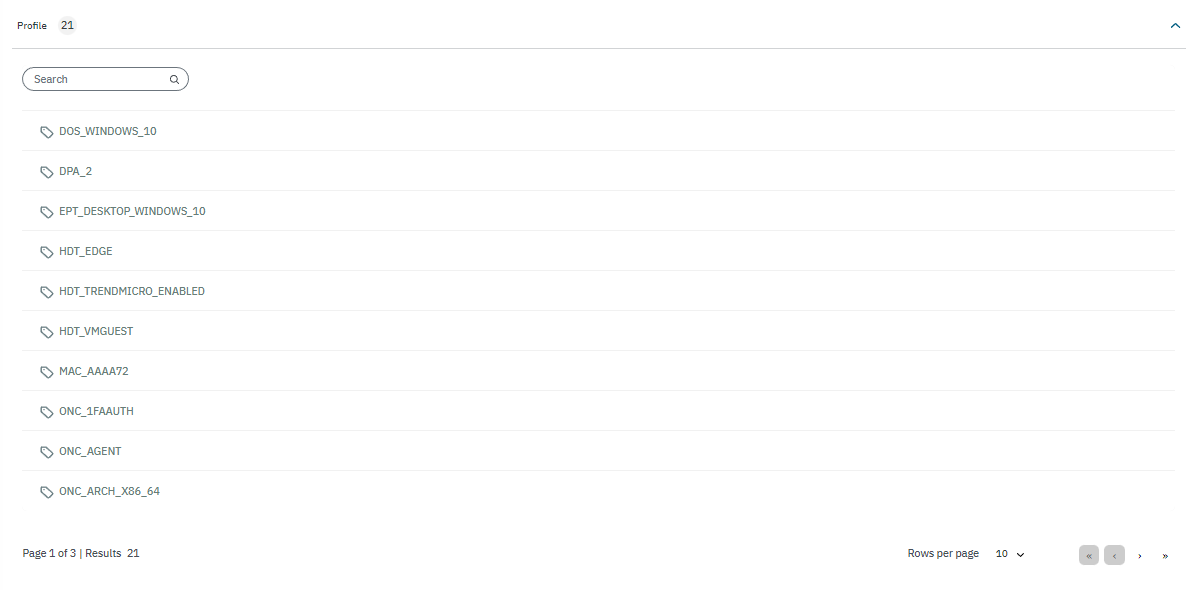
Normal view:
3.2.3.2.1.2.2. View policy evaluation
The second visualization option is an eye icon that displays the policy evaluation.
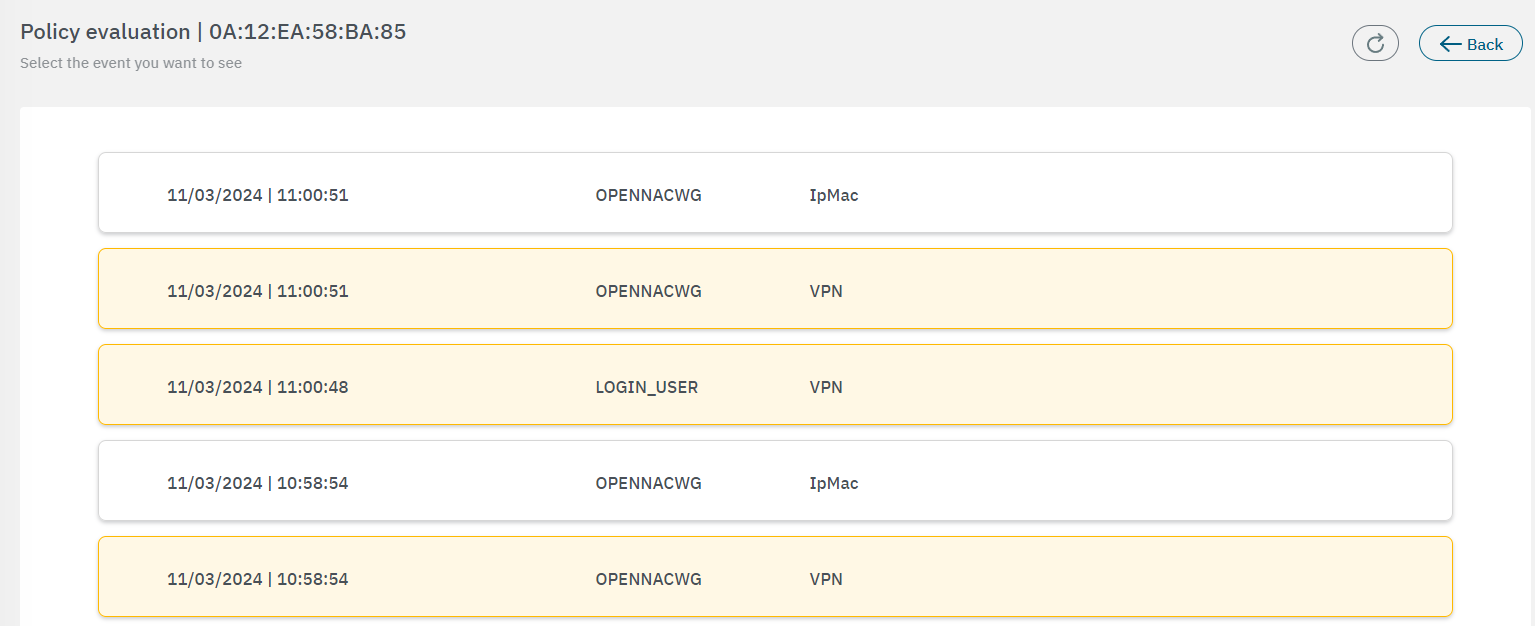
Select the event you want to see and it will open the following window displaying the params received, params processed and the result:
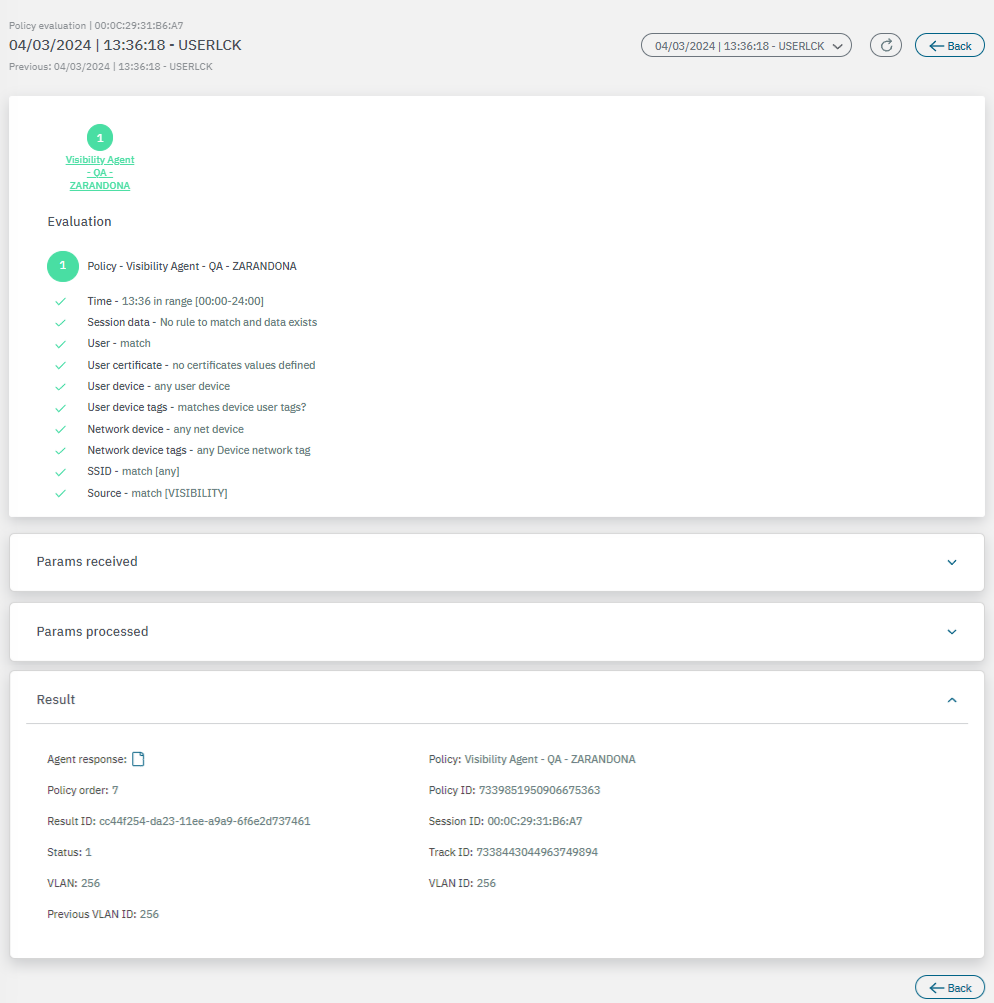
You will see that by default, params received and params processed are collapsed displaying only the result for a quick policy evaluation consultation.
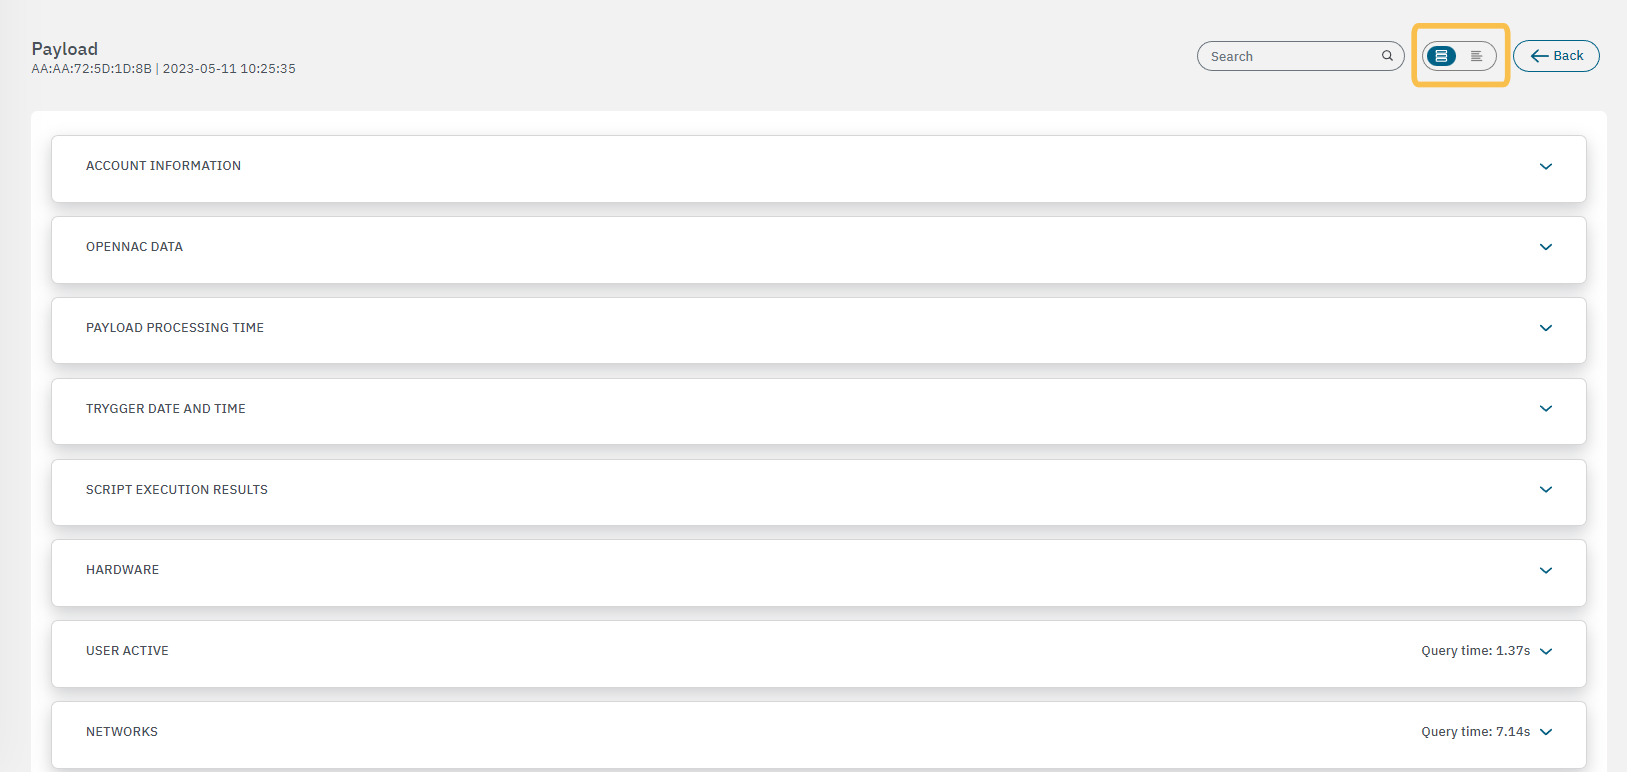
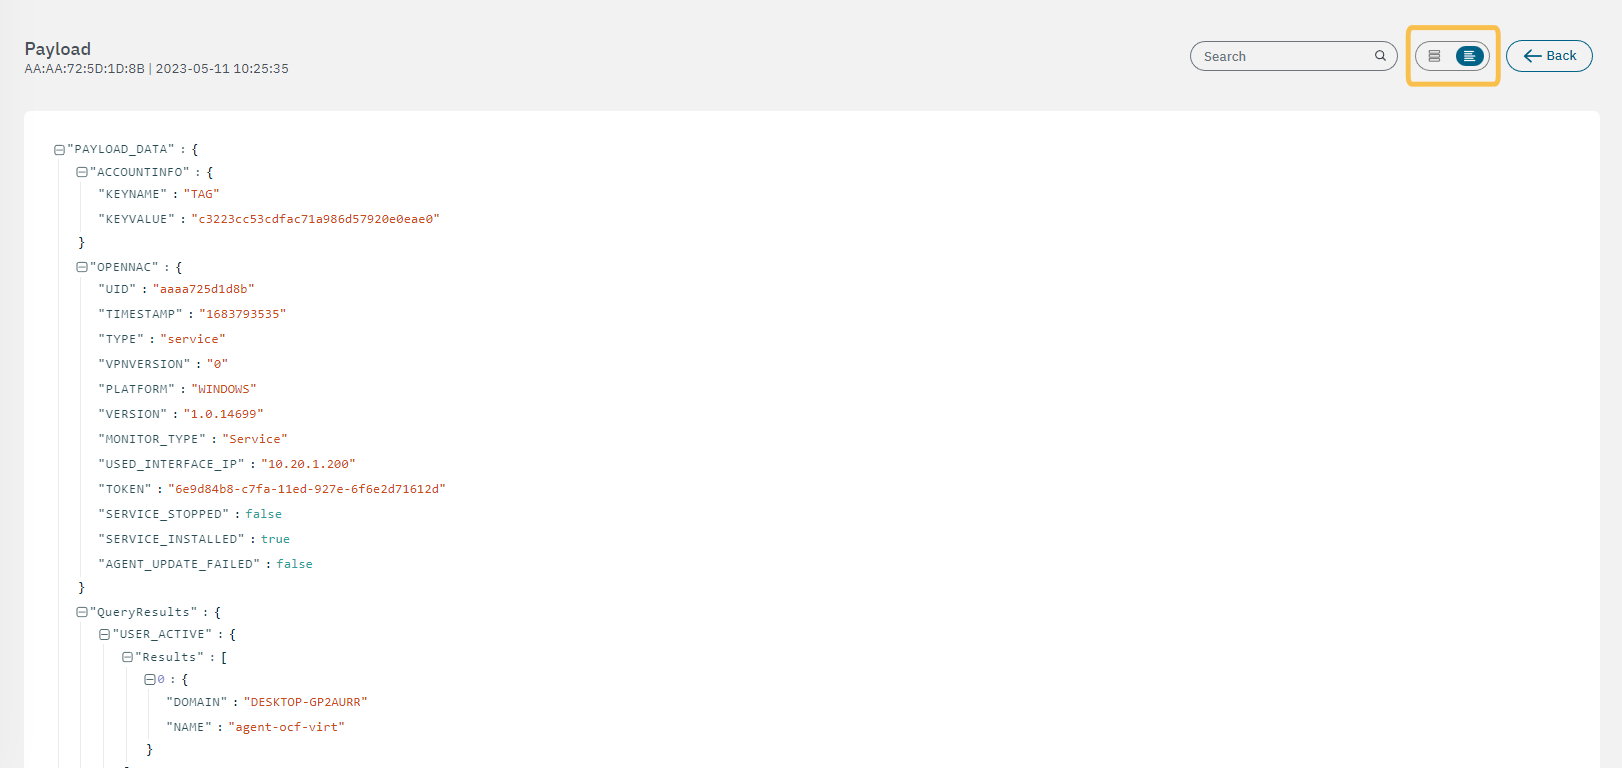
3.2.3.2.1.2.3. View payload
The third visualization option in our example of sessions is the note icon. It displays the session payload. This option will be displayed in case there is an Agent installed.
Note that there are two view modes that can be selected using the flag highlighted on the images below:
To navigate to the main view, click on Back. By selecting a session from the table, it will display the Action row at the bottom of the window.
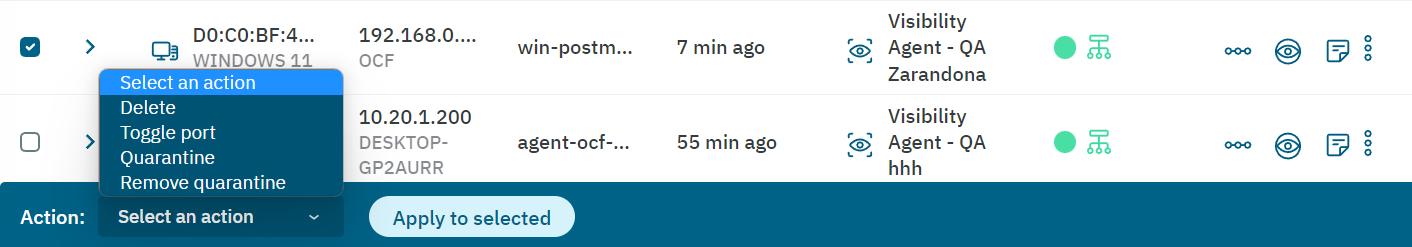
You can Delete, Toggle port, Quarantine, and Remove quarantine the selected object.