3.2.3.1. Board
Within the Board view, you can visualize dashboards that display connection status.
You can filter by date, remove filter and refresh the dashboards with the buttons featured in the first row of this view. Each dashboard displays specific connection data:
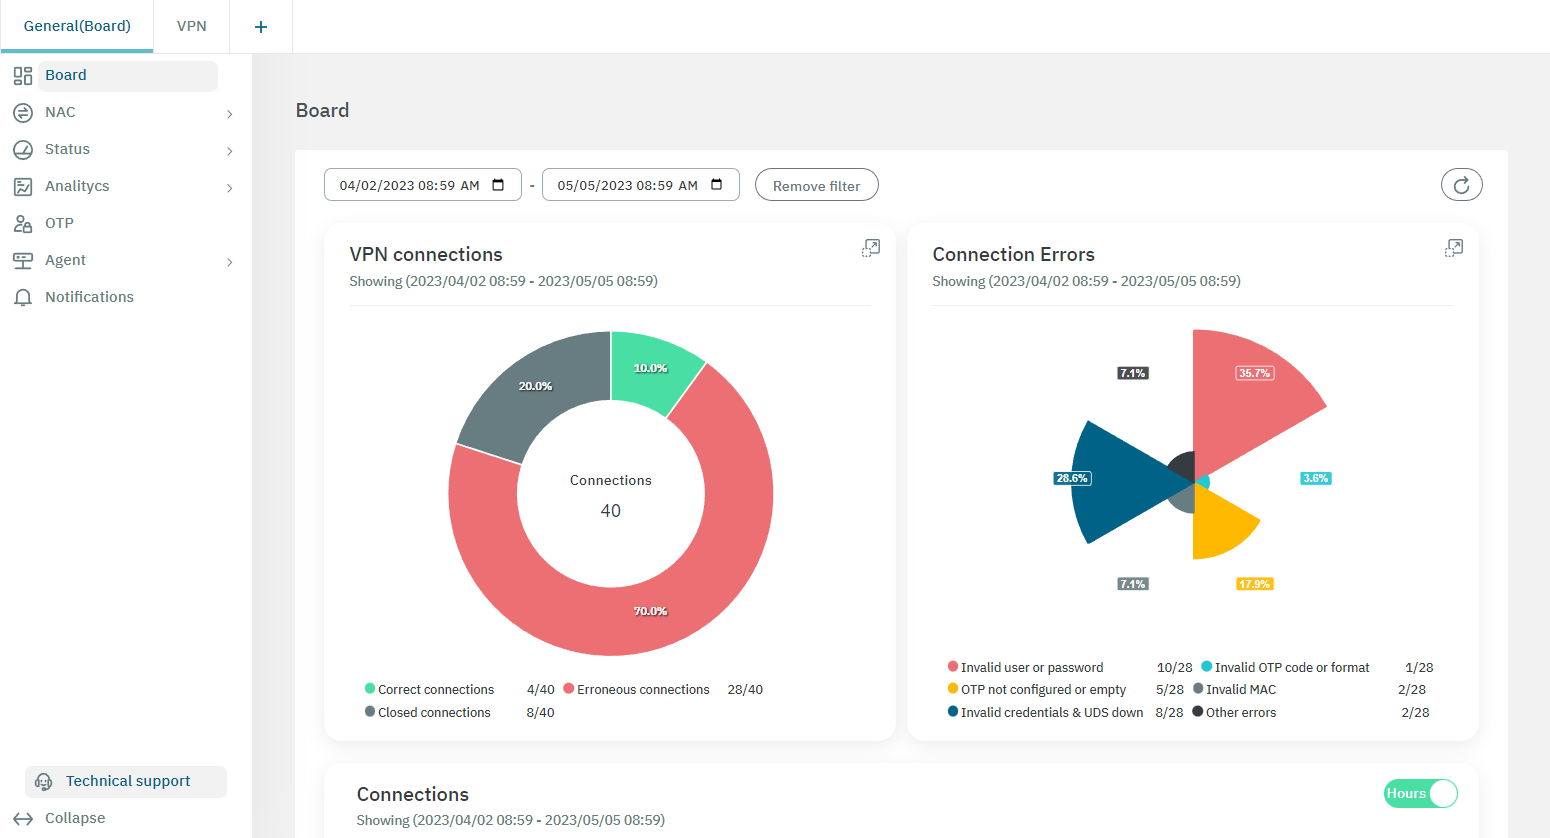
VPN Connections:
Connection Errors:
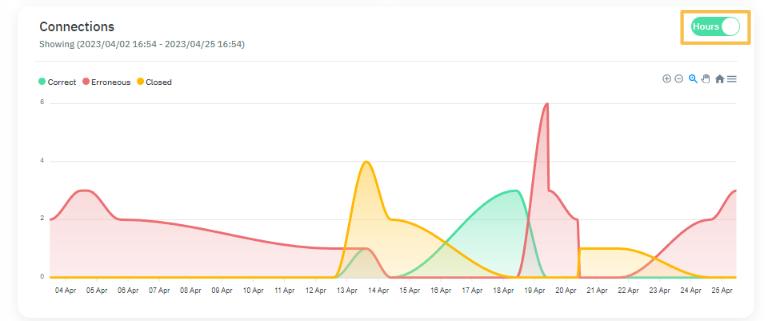
Connections by hours or by days depending on the position of the corresponding flag.
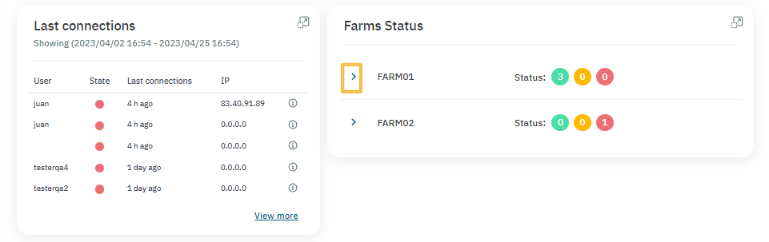
Last connections:
Farm Status:
By clicking on the arrow highlighted in the previous image, it will display the following view:
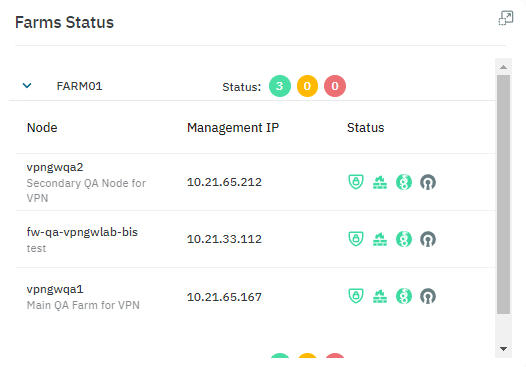
The status field displays the icons of the following services:
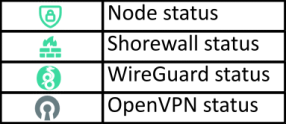
The color of the icons reflect their status:
Green: The node and the services are running, and configuration is up to date.
Yellow: The node and the services are running, but the services configuration is out of date.
Red: The node or its services are stopped or have some error.
Grey: Status unknown.