4.2.7. Monitoring
With all the information related to the UNAC network module that the system collects, it generates dashboards so that this information can be read and interpreted quickly and easily by the user. As a large volume of data of different types and sources is generated, different dashboards have been defined that group this information through graphs and tables.
All Dashboards have filters that allow us to define what parameters to show and what time period of the data will be used to generate said dashboards. Keep in mind that, if in the indicated period of time there has been no update on a specific device, through an event, this device will not appear.
We can find more information about the dashboard information filtering process in section 6.
4.2.7.1. OpenNAC Dashboard
A summary of the most important information collected from the ON Core is displayed in the OpenNAC Dashboard. We can see the following events in this window:
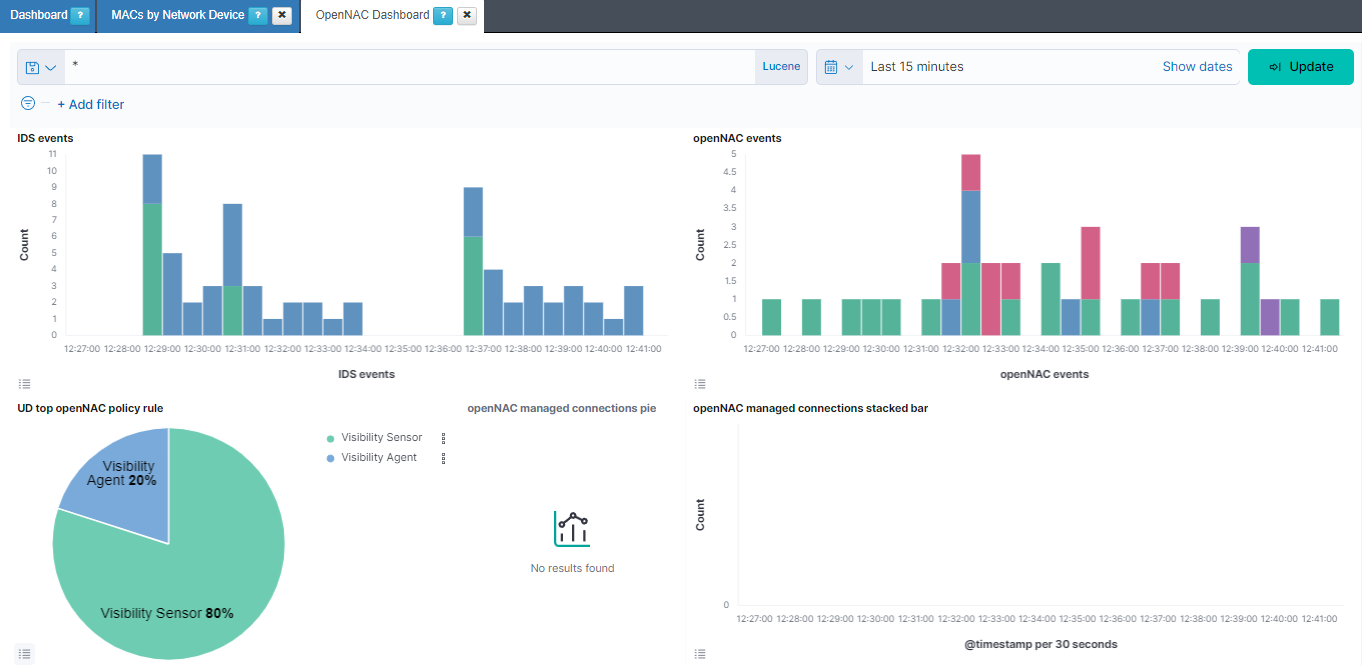
IDS events: Shows over a timeline the total of events of bro separated by the event type. The different types that we can find are: bro-conn_log, bro-dns_log, bro-http_log, bro-files_log, bro-dhcp_log, bro-notice_log, bro-ssl_log, bro-x509_log, bro-kerberos_log, bro-radius_log, bro-ssh_log, bro-snmp_log, bro-sip_log, bro-dpd_log, bro-smtp_log, bro-arp_log, bro-modbus_log, bro-rfb_log, bro-rdp_log, bro-ntlm_log, bro-socks_log, bro-tunnel_log, bro-rpc_log, bro-pe_log, bro-smb_files_log, bro-smb_mapping_log, bro-s7comm_log, bro-profinet_log, bro-bacnet_log, bro-enip_log, bro-dnp3_log and bro-syslog_log.
openNAC events: Shows over a timeline the total of events of opennac separated by the opennac source. Some of the opennac sources we can find are: plugin, ip, user, reeval, agent, mab, 8021xuser, info, and macdiscover.
UD top openNAC policy rule: Represents the percentage of the different policy rules events.
openNAC managed connections pie: Represents the percentage of the bro connections managed, coming from the sensor, and not managed.
openNAC managed connections stacked bar: Shows over a timeline the total of events of bro connections separated by if the connection is managed, from the sensor, or not managed.
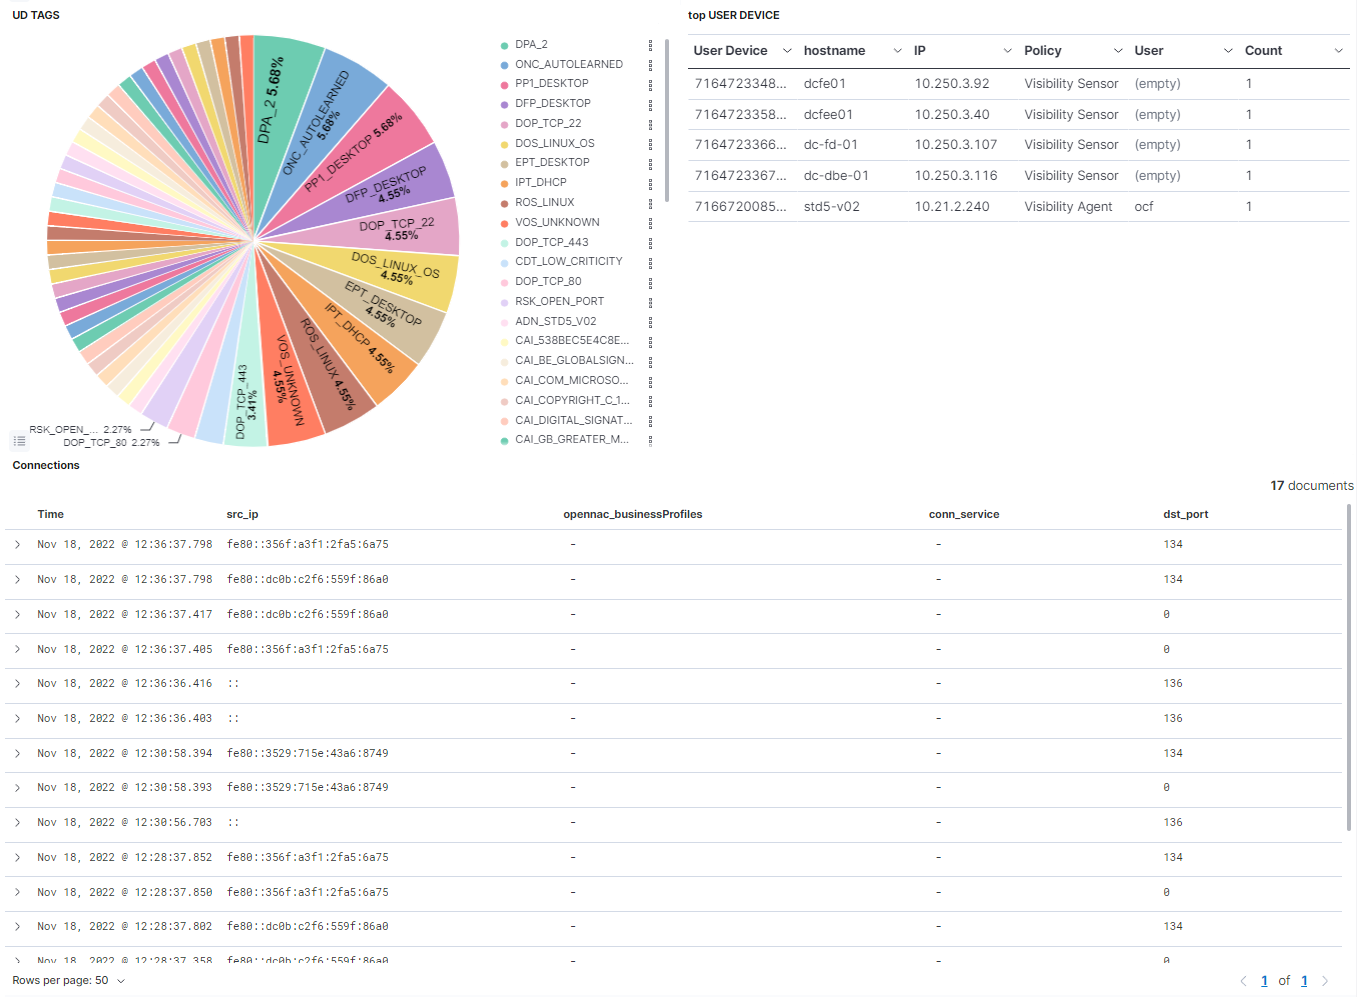
UD TAGS: Represents the percentage of the different UD TAGS.
top USER DEVICE: Shows a table with the top 10 user devices. In this table the User device id is represented, as well as the hostname, the IP, the policy rule, the user and the count this event has been repeated.
Connections: Shows a table with the most recent connections. In this table, the timestamp is represented, as well as the source IP, the opennac business profile, the connection service and the destination port.
4.2.7.2. User Devices
The User Devices dashboard displays information about the user devices, their source, and tags. We can see the following views on this dashboard:
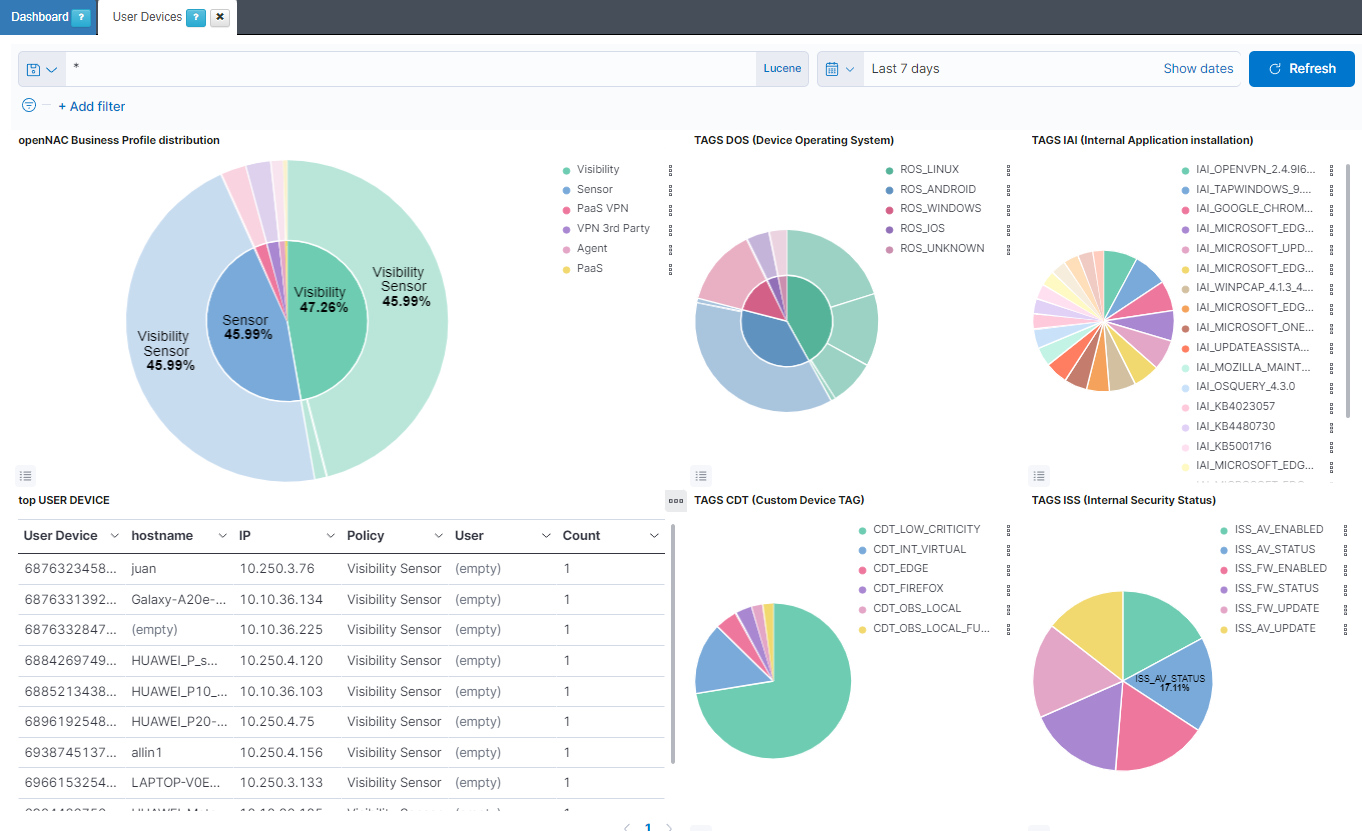
openNAC Business Profile distribution: The internal pie represents the percentage of opennac business profiles. The external pie represents the percentage of opennac policy rules.
TAGS DOS (Device Operating System): The internal pie represents the percentage of ROS (ROOT OPERATING SYSTEM) tags. The external pie represents the percentage of DOS (DEVICE OPERATING SYSTEM) tags.
TAGS IAI (Internal Application installation): Represents the percentage of IAI (INTERNAL APPLICATION INSTALLATION) tags.
top USER DEVICE: Shows a table with the top 10 user devices. In this table, the User device ID is represented, as well as the hostname, the IP, the policy rule, the user and the amount of times this event is repeated.
TAGS CDT (Custom Device TAG): Represents the percentage of CDT (CUSTOM DEVICE TAG) tags.
TAGS ISS (Internal Security Status): Represents the percentage of ISS (INTERNAL SECURITY STATUS) tags.
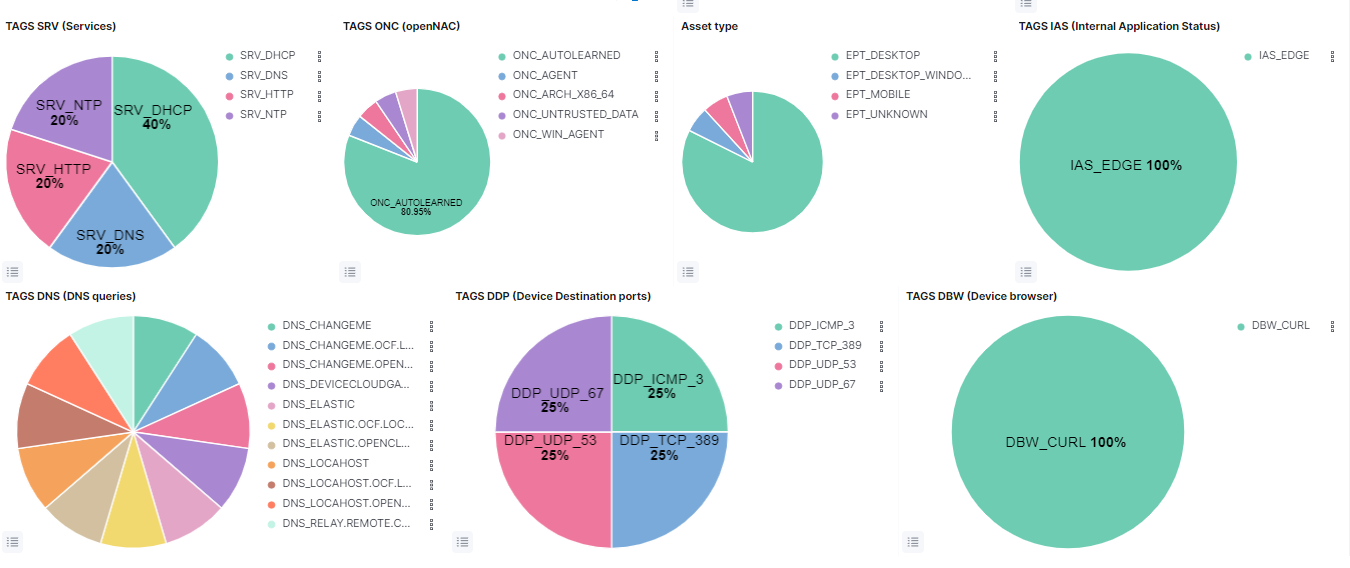
TAGS SRV (Services): Represents the percentage of SRV (SERVICES) tags.
TAGS ONC (openNAC): Represents the percentage of ONC (OPENNAC TAGS) tags.
Asset type: Represents the percentage of EPT (END POINT TYPE) tags.
TAGS IAS (Internal Application Status): Represents the percentage of IAS (INTERNAL SECURITY STATUS) tags.
TAGS DNS (DNS queries): Represents the percentage of DNS (DNS QUERIES) tags.
TAGS DDP (Device Destination ports): Represents the percentage of DDP (DEVICE DESTINATION PORTS) tags.
TAGS DBW (Device browser): Represents the percentage of DBW (DEVICE BROWSER) tags.
4.2.7.3. User Device Overview
The User Devices overview dashboard displays the number of user devices, the operating system tags, and other tags are visualized. We can see the following views on this dashboard:
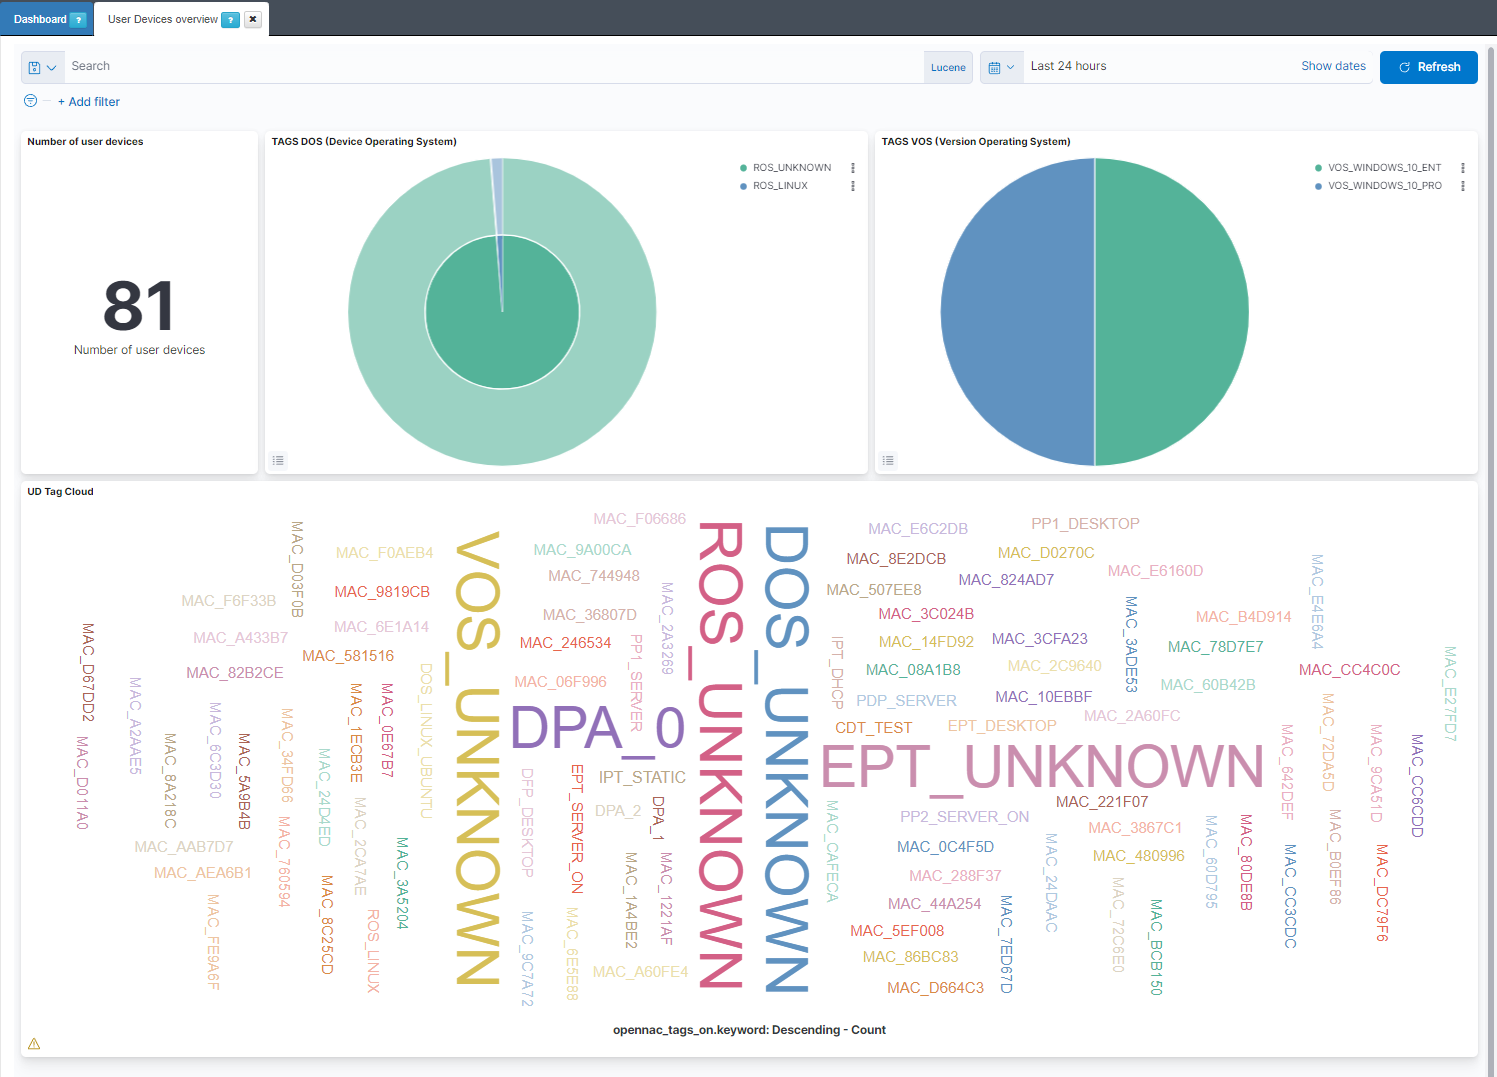
Number of user devices: Shows the number of user devices.
TAGS DOS (Device Operating System): The internal pie represents the percentage of ROS (ROOT OPERATING SYSTEM) tags. the external pie represents the percentage of DOS (DEVICE OPERATING SYSTEM) tags.
TAGS VOS (Version Operating System): Represents the percentage of VOS (VERSION OPERATING SYSTEM) tags.
UD Tag Cloud: Shows the most found tags and allows filtering them by clicks.
4.2.7.4. MACs by Network Device
The MACs by Network Device dashboard displays views with a Network Device IP and port filter. We can see the following views on this dashboard:
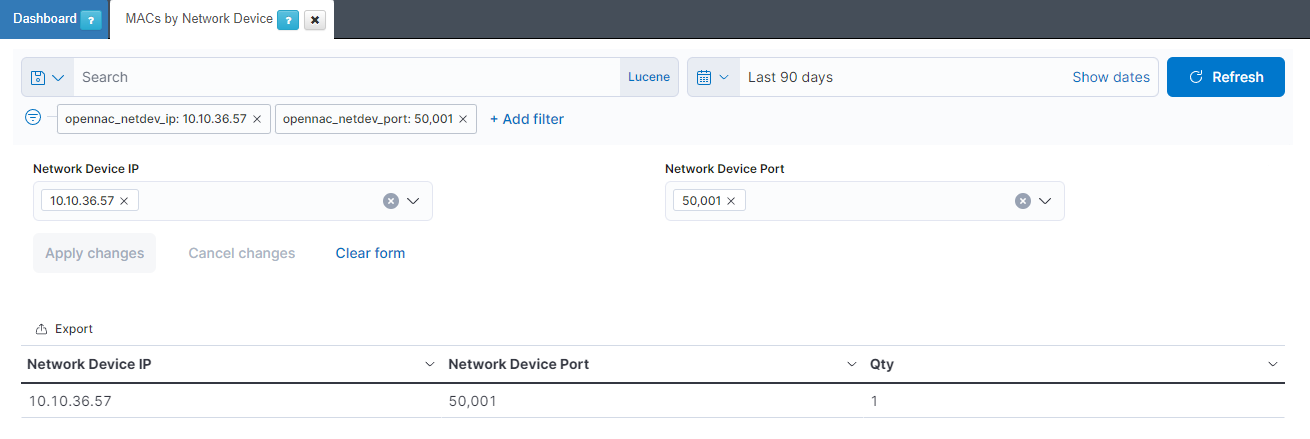
Filter: Allows to filter the Network Device table with the network device IP and the network device port.
Network Device table: Shows a table with the top 10 user devices. In this table the network device IP is represented, as well as the network device ports, the MACs the network device have and the Qty that show the number of MACs.
4.2.7.5. openNAC Poleval
The OpenNAC Poleval dashboard displays a list of polevals. We can see the following views on this dashboard:
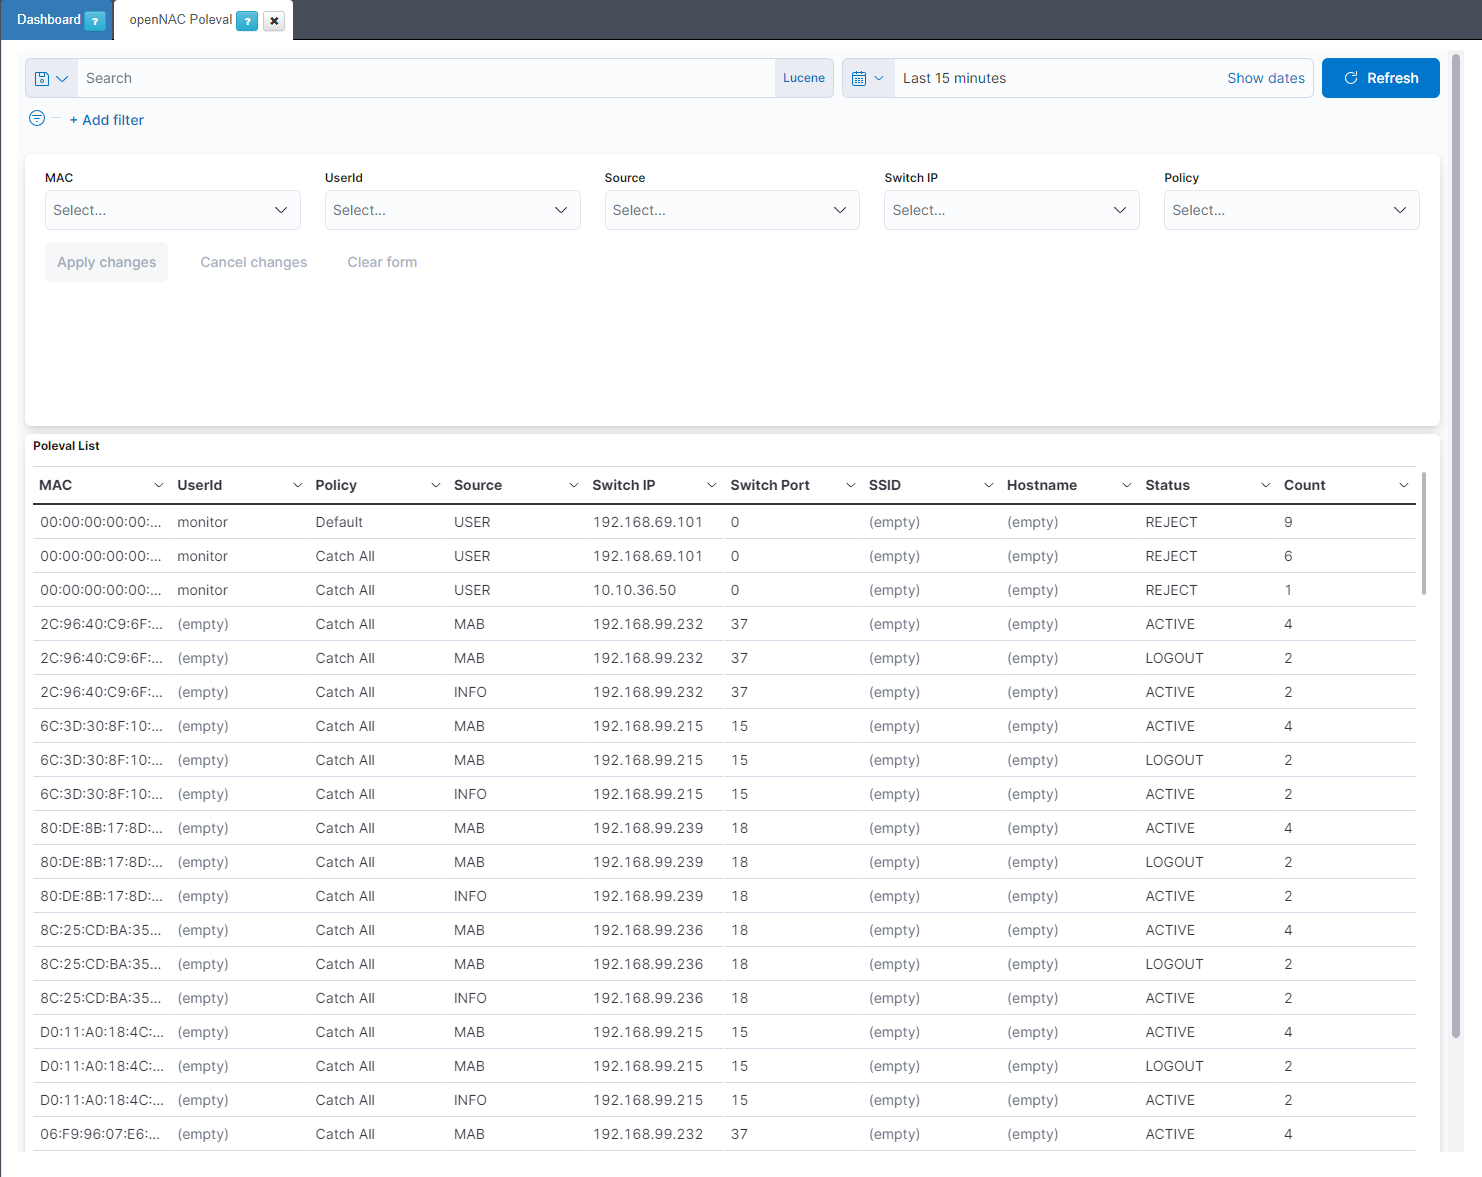
Filters: Allows to filter the Poleval List with the MAC, the user ID, the openNAC source, the switch IP and the policy rule.
Poleval List: Shows a table with the polevals. In this table the MAC is represented, as well as the user ID, the policy rule, the openNAC source, the switch IP, the switch port, the ssid, the hostname, the status and the amount of times this event is repeated.
4.2.7.6. 802.1X Request
The 802.1X Request dashboard displays information about 802.1X requests. We can see the following views on this dashboard:
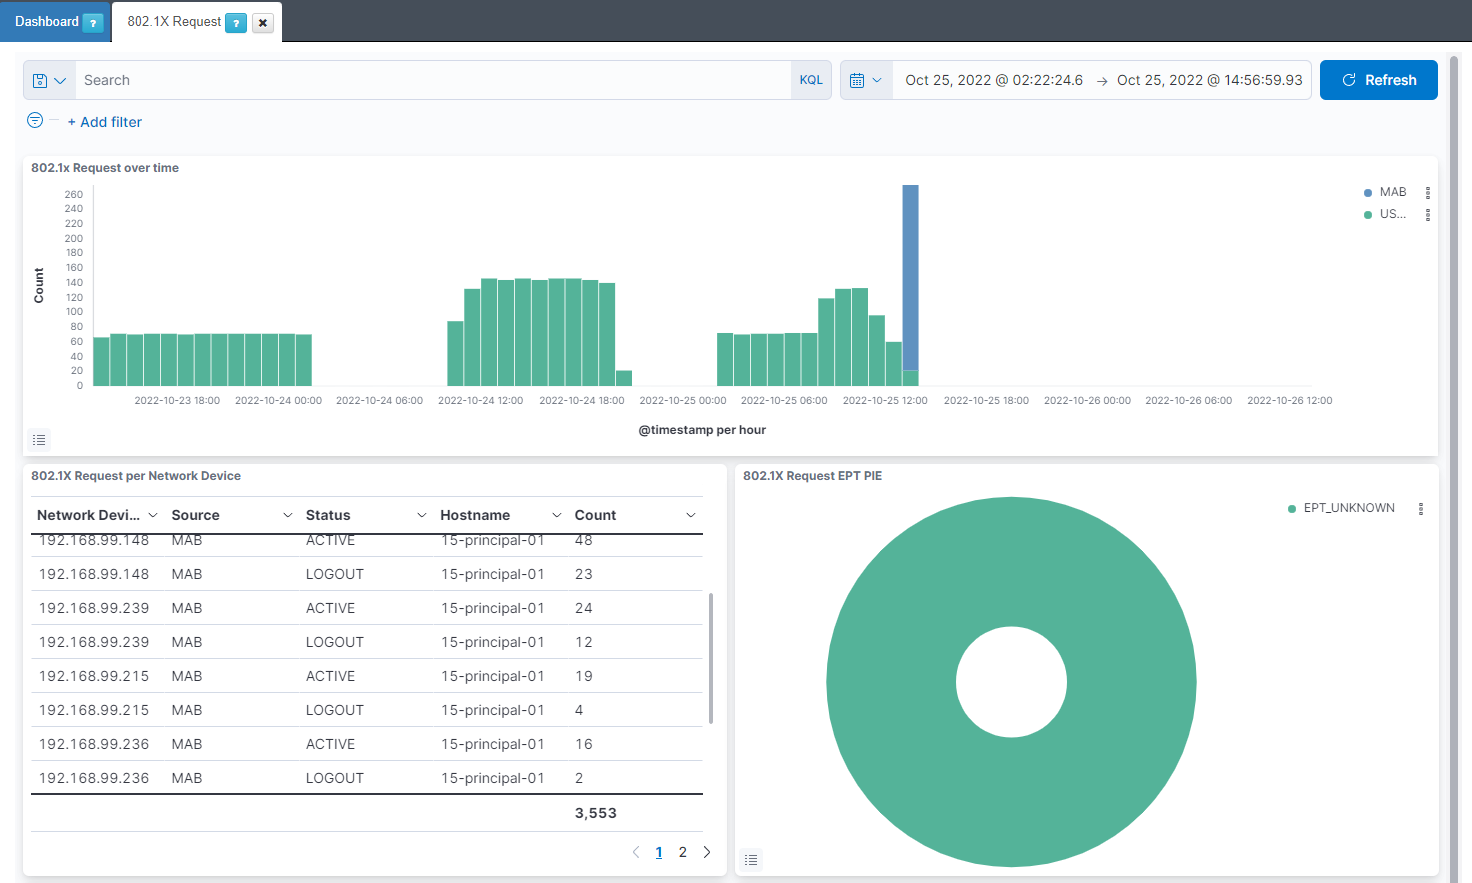
802.1x Request over time: Shows over a timeline the total of events of openNAC separated by the openNAC source. The sources we can find in this view are user, 8021xhost, 8021xuser and MAB.
802.1X Request per Network Device: Shows a table with the 802.1X requests. In this table the network device IP is represented, as well as the openNAC source, the status of the request, the hostname and the count this event has been repeated.
802.1X Request EPT PIE: Represents the percentage of the different EPT (END POINT TYPE) for the events with openNAC source user, 8021xhost, 8021xuser and MAB.
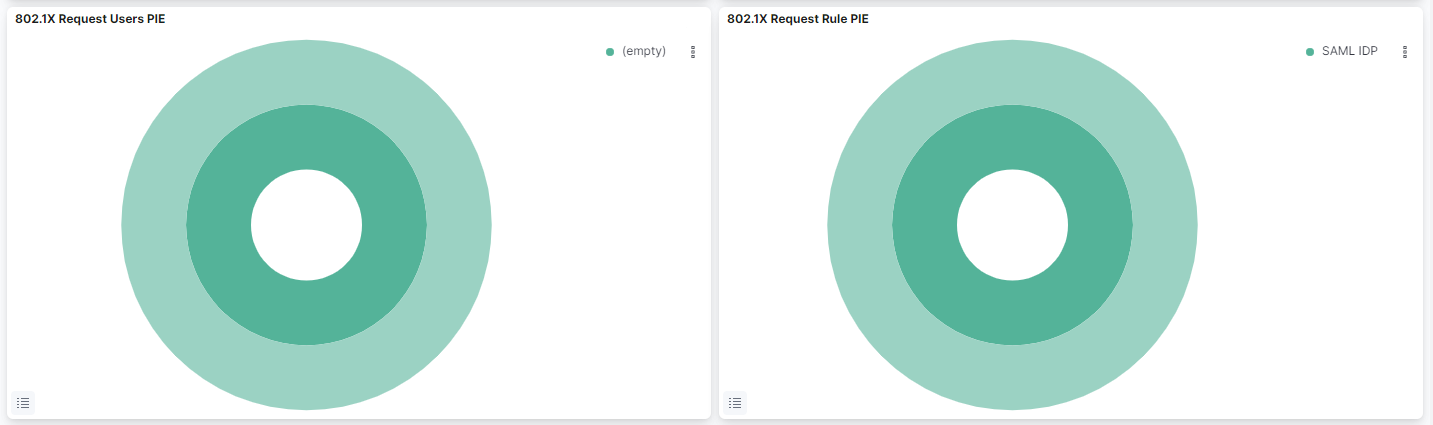
802.1X Request Users PIE: The internal pie represents the percentage of openMAC user ID. The external pie represents the percentage of EPT (END POINT TYPE).
802.1X Request Rule PIE: The internal pie represents the percentage of policy rules. The external pie represents the percentage of openNAC business profiles.
4.2.7.7. Radius
The Radius dashboard displays information about radius requests. We can see the following views on this dashboard:
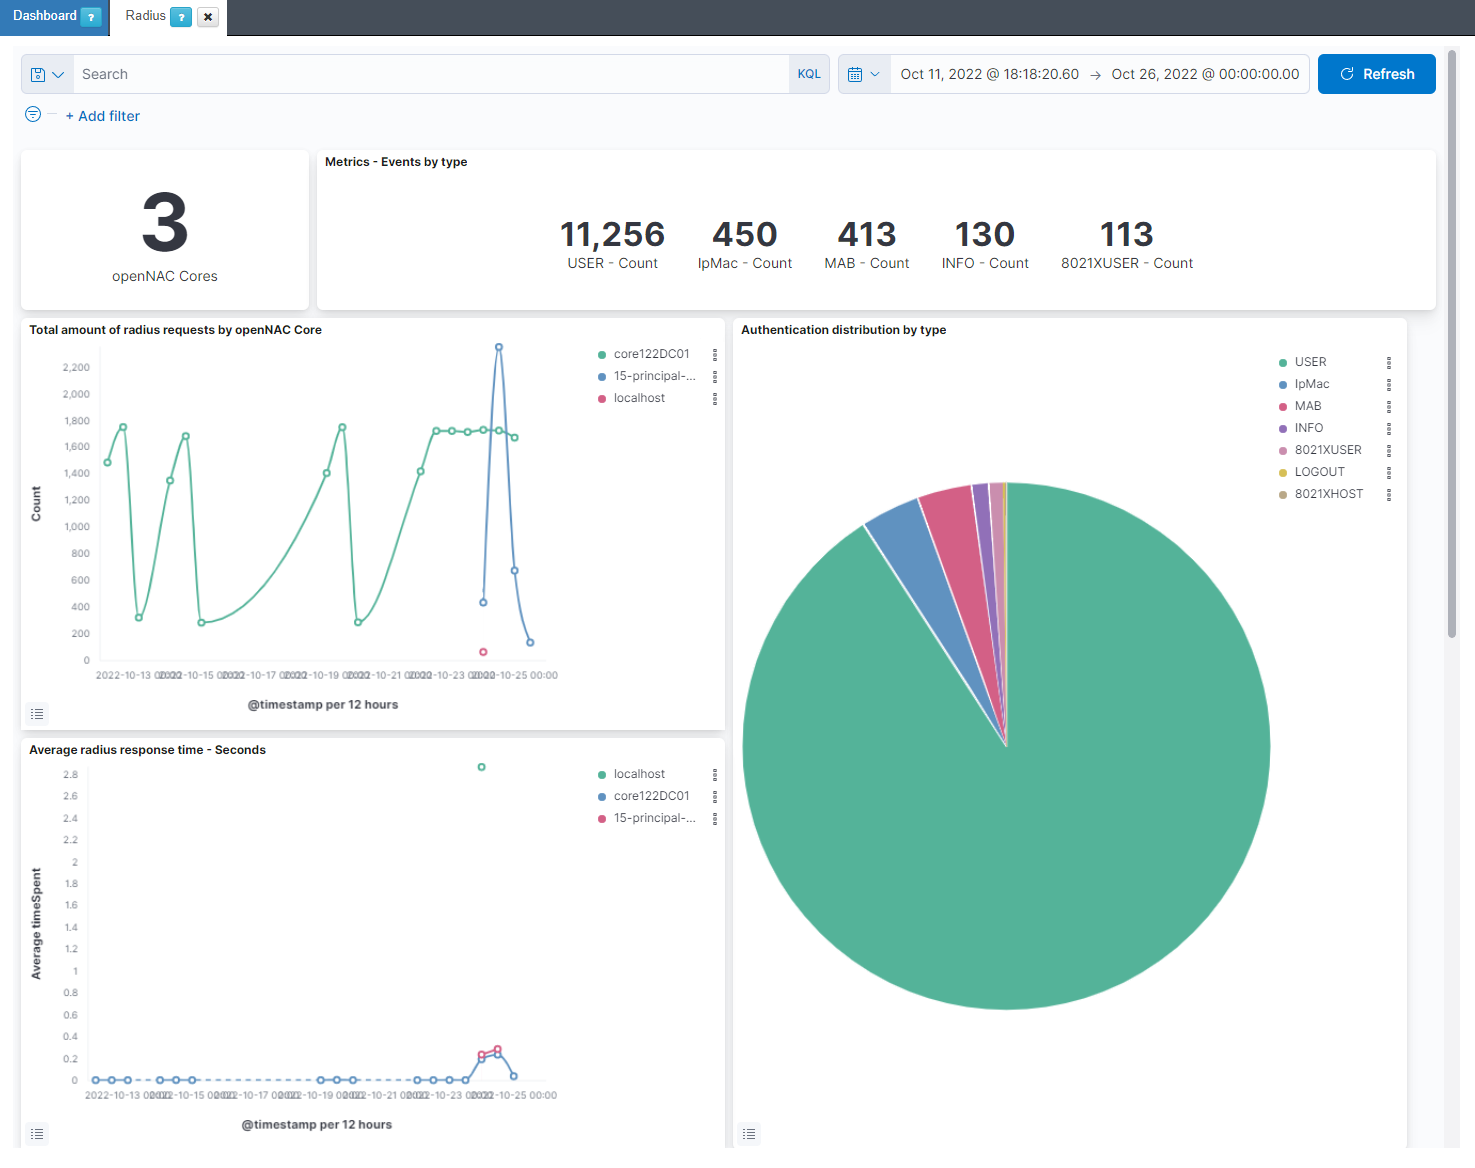
openNAC Cores: Shows the number of openNAC cores.
Metrics - Events by type: Shows the number of each openNAC source.
Total amount of radius requests by openNAC Core: Displays the total radius events for every host on a timeline.
Authentication distribution by type: Represents the percentage of the different radius sources.
Average radius response time - Seconds: Displays the average of execution time for radius events for every host on a timeline.
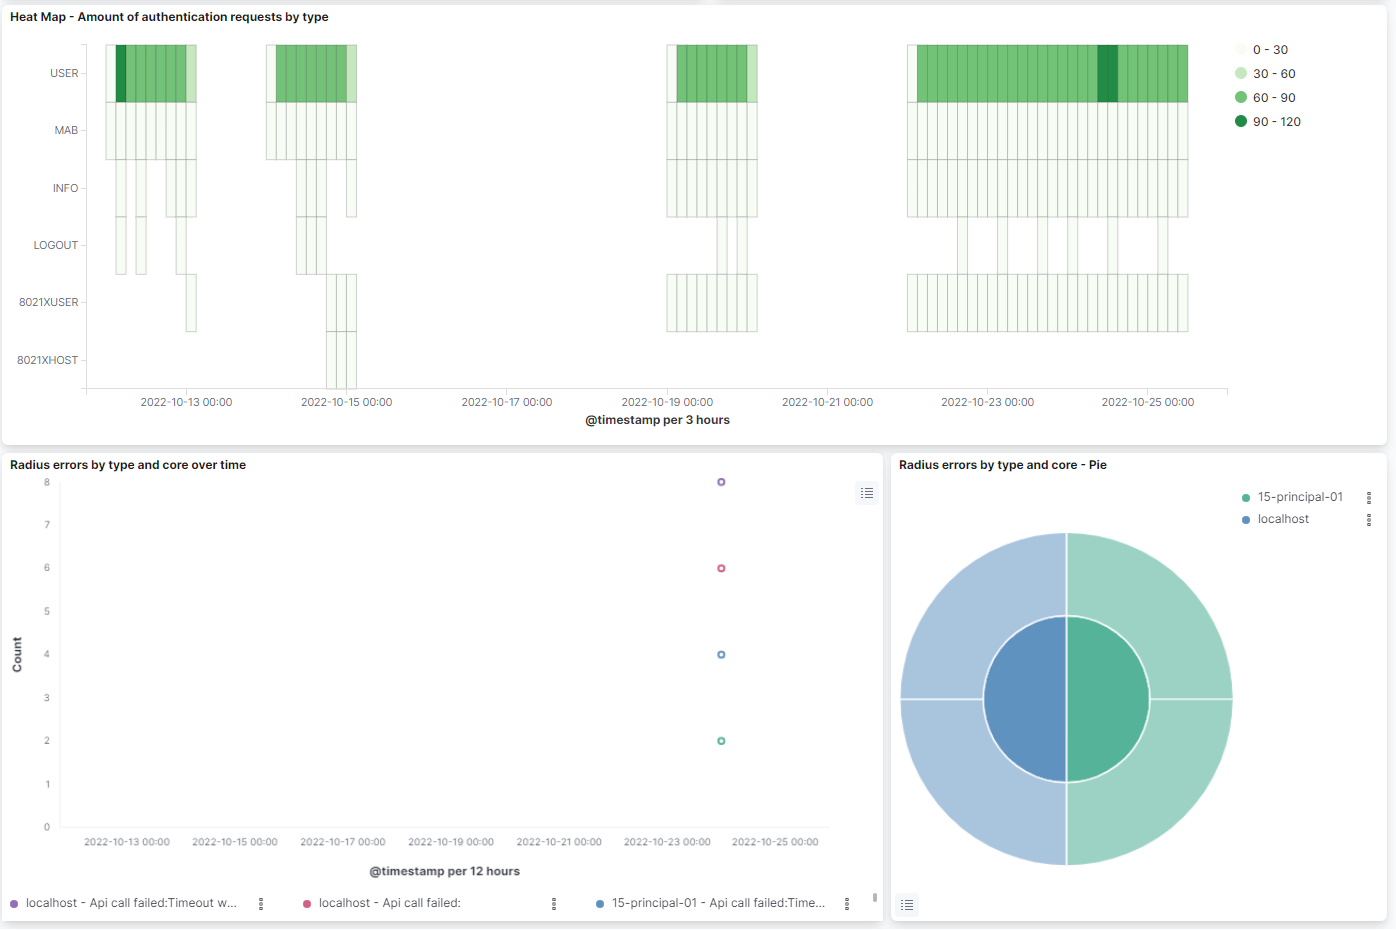
Heat Map - Amount of authentication requests by type: Shows a heatmap relating the radius source with hourly radius events count.
Radius errors by type and core over time: Displays the total radius events with error separated by the host and the error message type on a timeline.
Radius errors by type and core - Pie: the internal pie represents the percentage of hosts. The external pie represents the percentage of the radius error message types.
4.2.7.8. Filtering in dashboards
In all the dashboards of the solution there is an upper bar to temporary filter the information that is shown in the graphs and tables of the dashboard.

4.2.7.8.1. Filter by variables
In this bar we can add new filters by clicking “+ Add filter” on the left
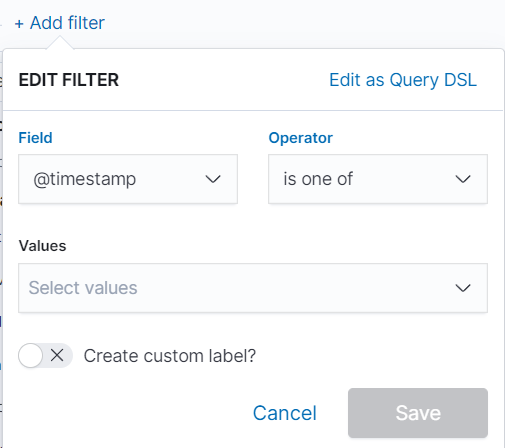
Here we can add the variable we want to filter by, for example, time, id, type and others. Once the variable is selected, we must indicate the operator, is, is not, etc. Depending on whether we want to search for a specific variable, ignore a specific variable in the graph and others. Finally, we indicate the value of the variable and save the filter by pressing “Save”.
If within a dashboard we click any variable that is in a graph, a filter will be generated with the same variable that will affect the overall dashboard.
4.2.7.8.2. Filtered by time period
To quickly filter, we can do it by selecting the icon shown in the figure below. This will open a dropdown where we can configure the time period of the dashboard.
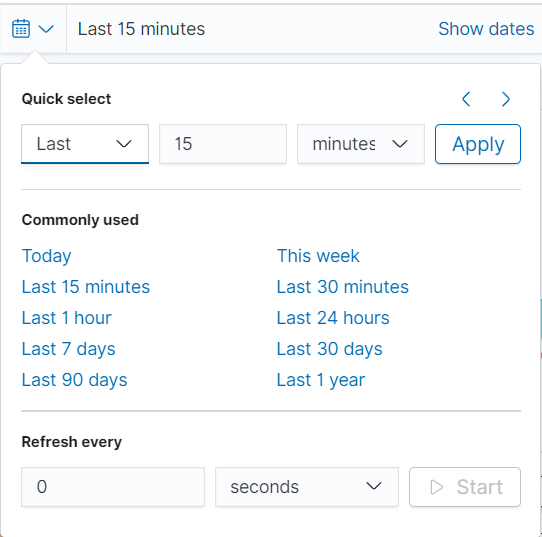
In the (Quick select) section, we can quickly select a time period from the current moment, for example, the last 15 minutes, hours, days, etc. In the (Commonly used) section we can select time periods that are frequently used and that are already preconfigured.
The last section configures the refresh rate of the graph (by default it is disabled). With this, we configure the graph update automatically when pressing “Start”. If we want to further customize the time period of the graph we can select each of the times (start and end) in which we can select the exact point.
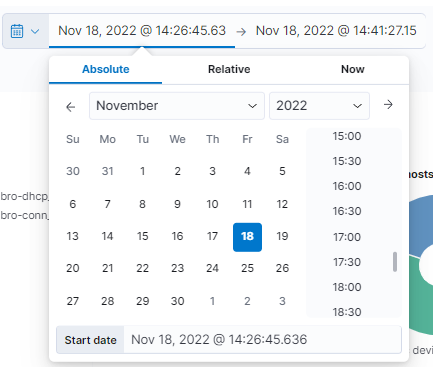
If we select the Absolute type, we will be asked for an exact calendar date. On the other hand, when selecting Relative, we must indicate a time from the current moment. If we select Now means that on every refresh the current time will be set to the time of the refresh.
It is important to take into account the rotability of the data. If the data rotability is defined to one month, we will only be able to obtain information up to one month before the current moment.