5.3.1.3. ON Analytics
This section has the basic troubleshooting for ON Analytics devices -it verifies the internal resources. It is also recommended to follow the trending guide in Opennac Administration Portal.
The main services in ON Analytics devices are:
Logstash service
ElasticSearch service
Kibana service
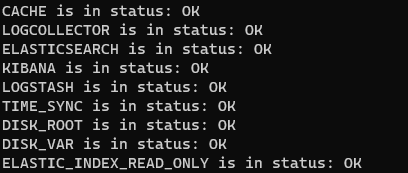
You can execute a complete review in this directory /usr/share/opennac/healthcheck using the command php healthcheck.php
cd /usr/share/opennac/healthcheck
php healthcheck.php
5.3.1.3.1. Logstash Service
Managing service Logstash:
systemctl (start|stop|restart|status) logstash
Check Logstash files:
tail -f /var/log/logstash/logstash.log
tail -f /var/log/logstash/logstash.err
tail -f /var/log/logstash/logstash.stdout
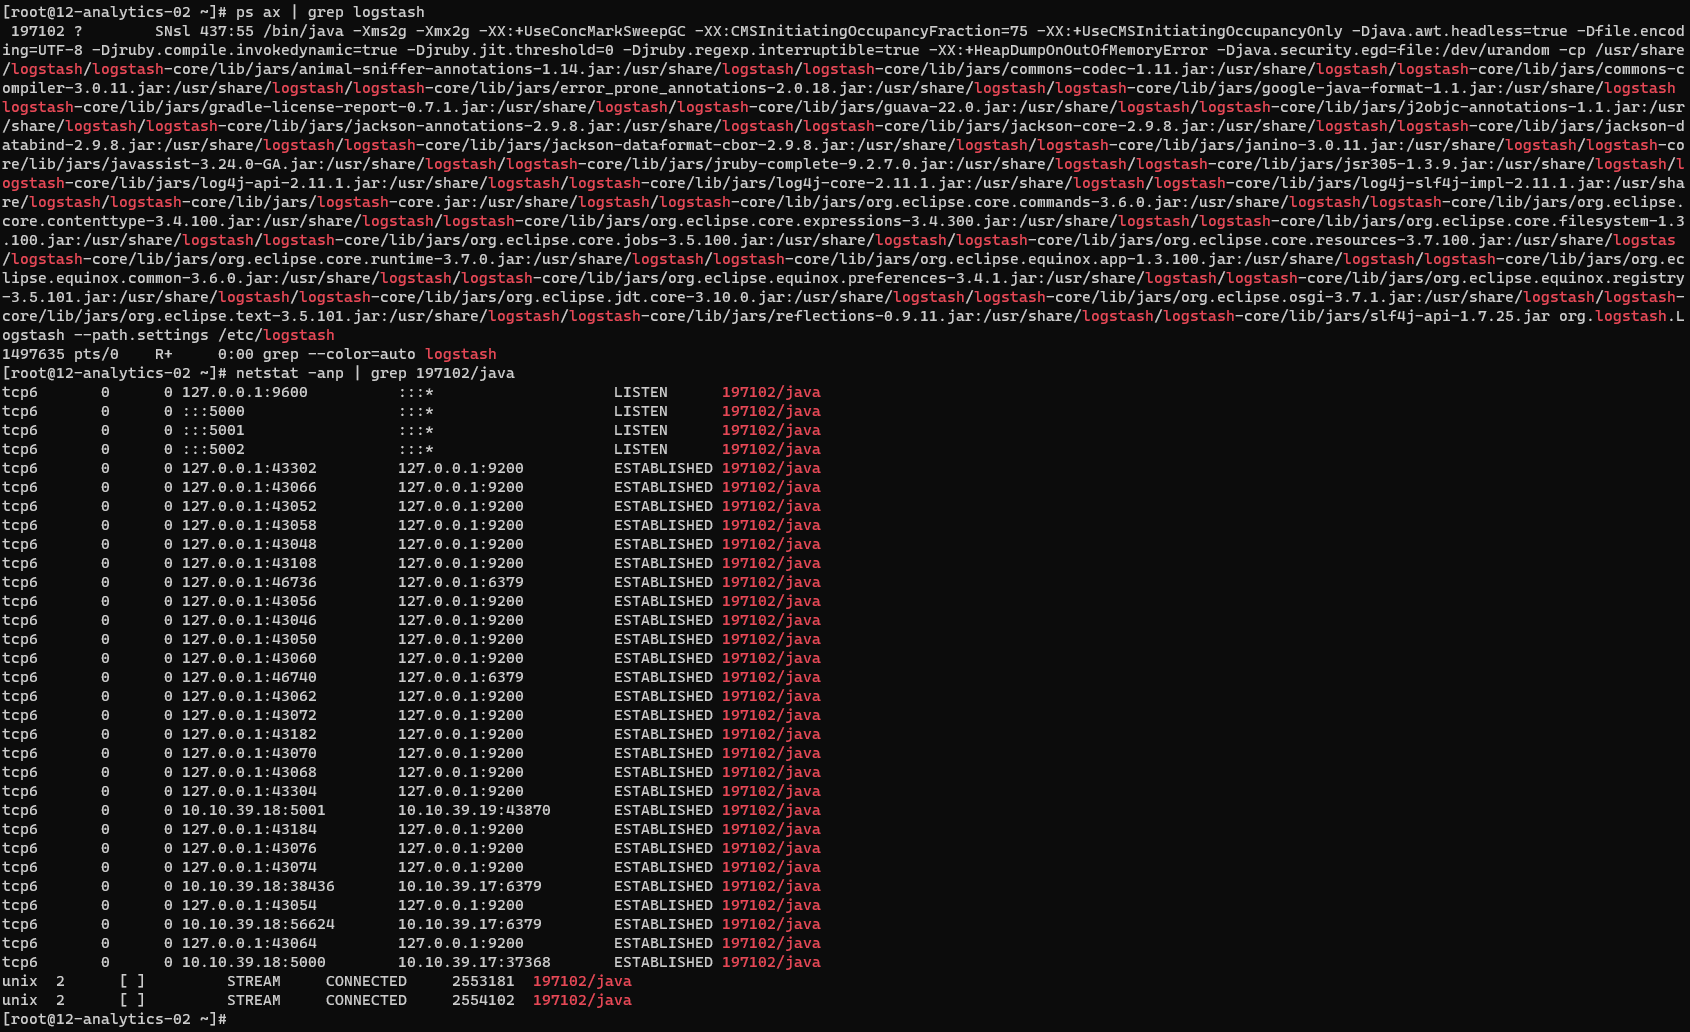
Verify Logstash ports:
First, find the id process then verify the associated port. The first command will let you know which is the process id for logstash, the second one, which is the used port by logstash process (5000/TCP,5001/TCP,5002/TCP).
ps ax | grep logstash
netstat -anp | grep 197102/java
Process running:
ps -ef | grep "logstash"
5.3.1.3.2. ElasticSearch Service
Managing service ElasticSearch:
systemctl (start|stop|restart|status) elasticsearch
Check ElasticSearch log:
tail -f /var/log/elasticsearch/elasticsearch.log
Data location:
ls /var/lib/elasticsearch/elasticsearch/nodes/0/indices/
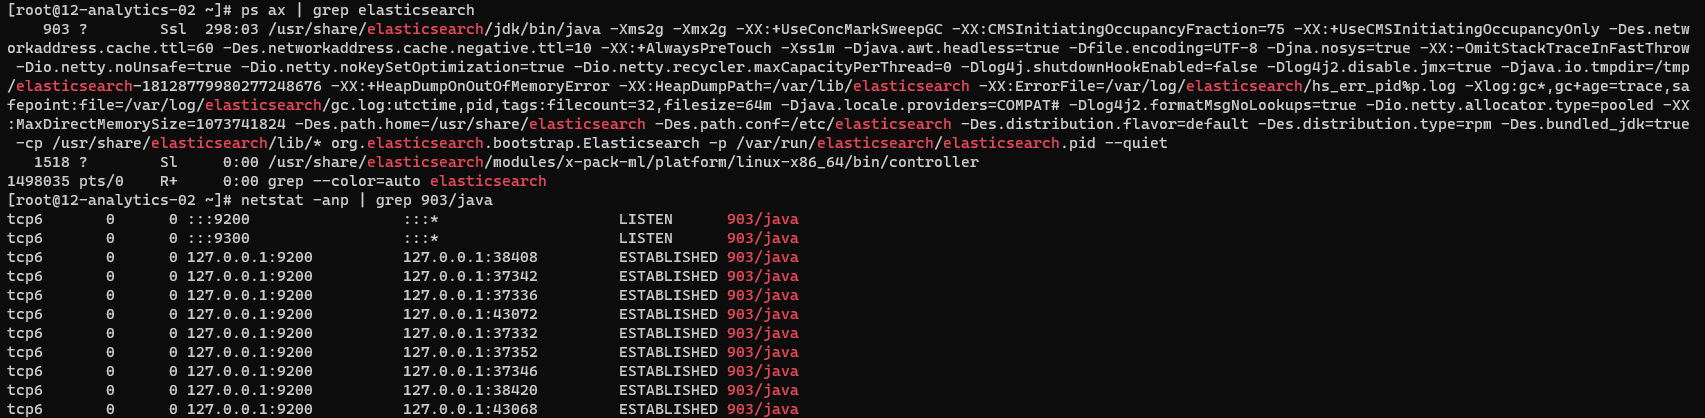
Verify ElasticSearch ports:
First, find the id process, then verify the associated port (9200/TCP,9300/TCP).
ps ax | grep elasticsearch
netstat -anp | grep 903/java
Process running:
ps -ef | grep "elasticsearch"
5.3.1.3.3. Kibana Service
Managing service Kibana:
systemctl (start|stop|restart|status) kibana
Verify Kibana ports:
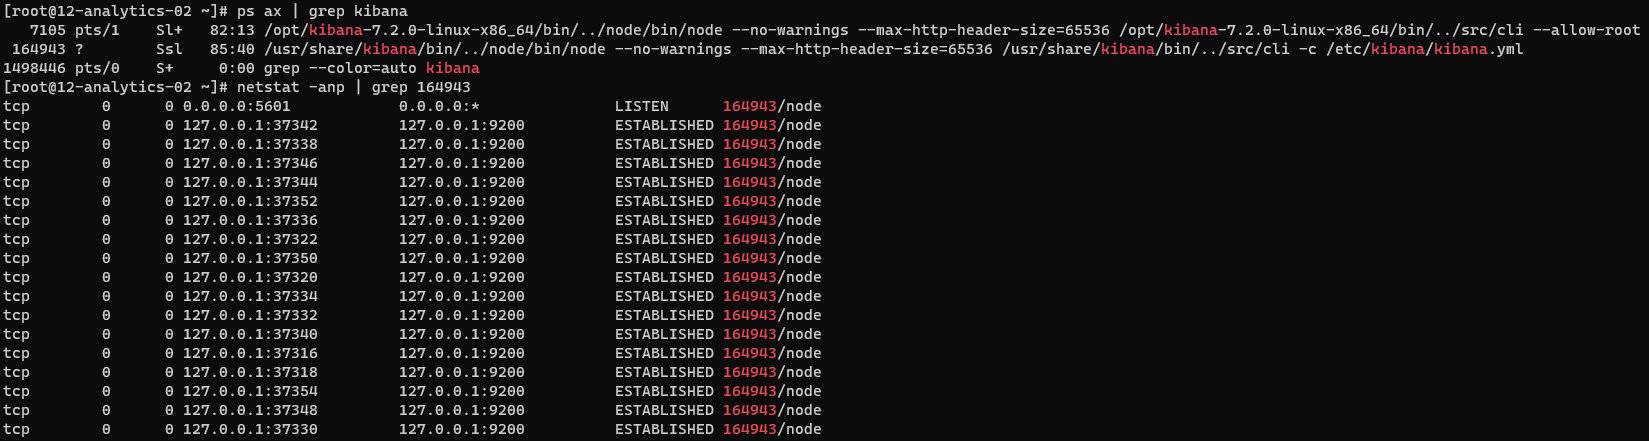
First, find the id process, then verify the associated port (5601/TCP).
ps ax | grep kibana
netstat -anp | grep 164943
Process running:
ps -ef | grep "kibana"
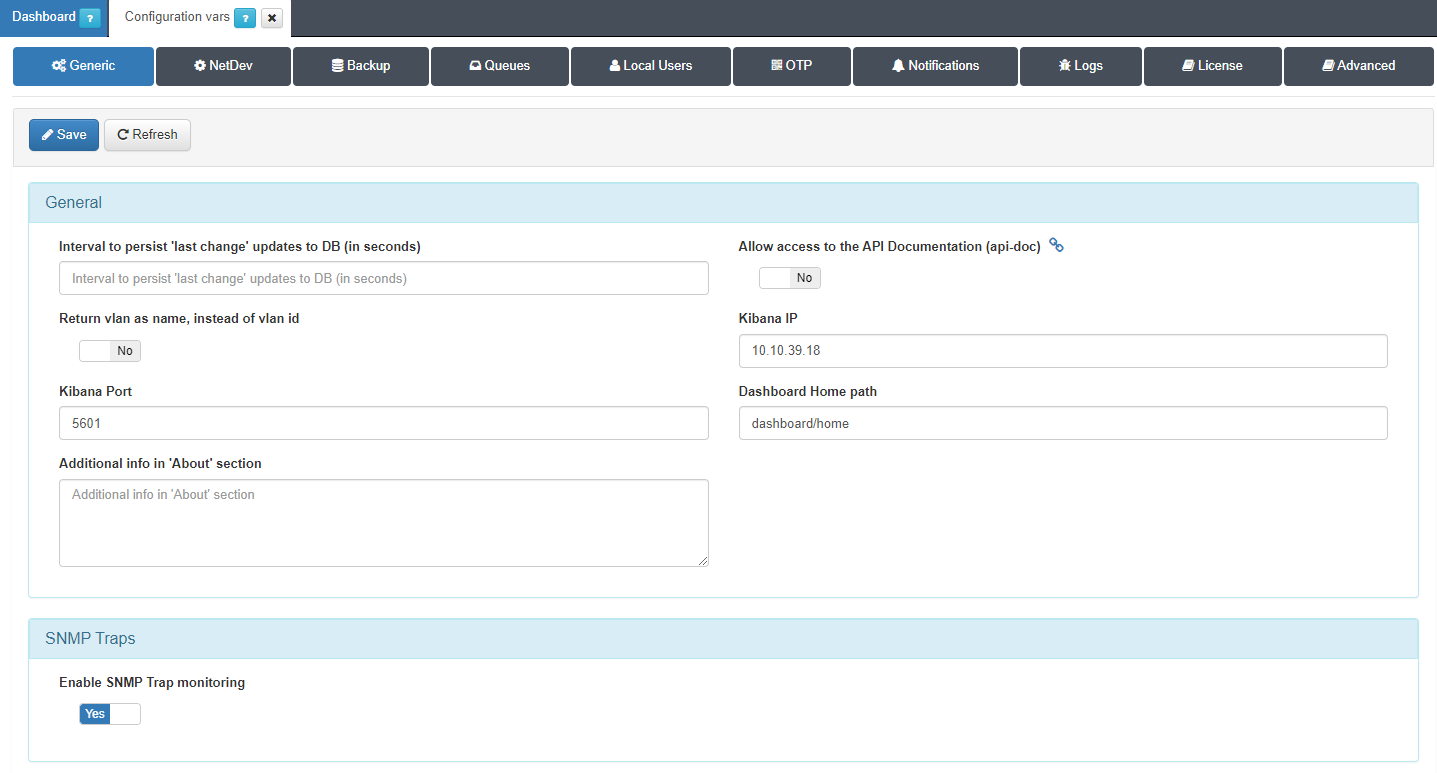
Verify the settings for kibana IP on Configuration -> Configuration vars -> Generic from Core web console.
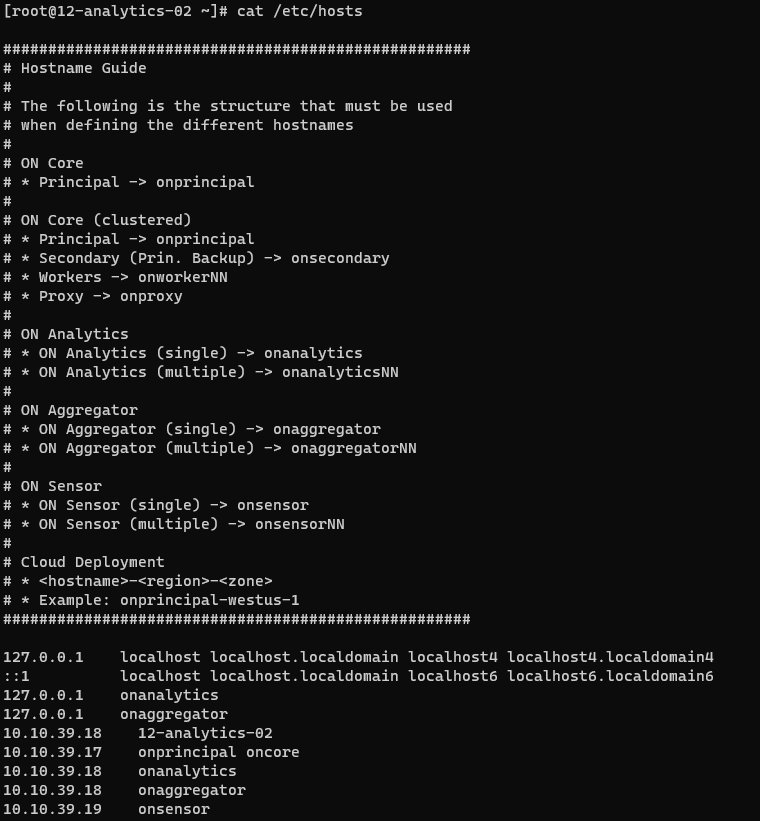
5.3.1.3.4. Hosts File
Make sure the hosts file /etc/hosts has been properly configured.