5.5. Healthcheck
The healthcheck is an OpenNAC Enterprise monitoring module. This module checks that all openNAC needed services are up and running, helping us to verify that the main functions and services are active and work correctly.
Note
In case you have to open a support issue, please include the image with the healthcheck displayed.
5.5.1. Healthcheck Configuration
In an OpenNAC Enterprise installation, the first step is to check if the healthcheck package is already installed:
rpm -qa | grep opennac-healthcheck
If it is not installed, we need to run the following:
dnf install opennac-healthcheck -y
It is necessary to check if the healthcheck of each machine has the correct role.
Note
If we are using a customized healthcheck, we can omit the differences.
5.5.1.1. ON Core Principal
Check the following when the role is ON Core Principal in single deployment or cluster.
cd /usr/share/opennac/healthcheck/
diff healthcheck.ini.principal healthcheck.ini
If there is any difference, we need to configure the healthcheck as we can see in the ON Core Principal deployment.
5.5.1.2. ON Core Worker
Check the following when the role is ON Core Worker in cluster deployment.
cd /usr/share/opennac/healthcheck/
diff healthcheck.ini.worker healthcheck.ini
If there is any difference, we need to configure the healthcheck as we can see in the ON Core Worker deployment.
5.5.1.3. ON Core Proxy
Check the following when the role is ON Core Proxy.
cd /usr/share/opennac/healthcheck/
diff healthcheck.ini.proxy healthcheck.ini
If there is any difference, we need to configure the healthcheck as we can see in the ON Core Proxy deployment.
5.5.1.4. ON Analytics + ON Aggregator
Check the following when the role is ON Analytics with ON Aggregator in single deployment.
cd /usr/share/opennac/healthcheck/
diff healthcheck.ini.analy+agg healthcheck.ini
If there is any difference, we need to configure the healthcheck as we can see in the ON Analytics with ON Aggregator deployment.
5.5.1.5. ON Analytics
Check the following when the role is ON Analytics in cluster deployment.
cd /usr/share/opennac/healthcheck/
diff healthcheck.ini.analytics healthcheck.ini
If there is any difference, we need to configure the healthcheck as we can see in the ON Analytics deployment.
5.5.1.6. ON Aggregator
Check the following when the role is ON Aggregator in cluster deployment.
cd /usr/share/opennac/healthcheck/
diff healthcheck.ini.aggregator healthcheck.ini
If there is any difference, we need to configure the healthcheck as we can see in the ON Aggregator deployment.
5.5.1.7. ON Sensor
Check the following when the role is ON Sensor.
cd /usr/share/opennac/healthcheck/
diff healthcheck.ini.sensor healthcheck.ini
If there is any difference, we need to configure the healthcheck as we can see in the ON Sensor deployment.
5.5.1.8. Captive Portal
Check the following when the role is ON Captive Portal.
cd /usr/share/opennac/healthcheck/
diff healthcheck.ini.portal healthcheck.ini
If there is any difference, we need to configure the healthcheck as we can see in the Captive Portal deployment.
5.5.2. Healthcheck Execution
To be able to execute this verification script, go to the desired component (ON Core, ON Analytics, ON Sensor) and execute it through the script healthcheck.php
php /usr/share/opennac/healthcheck/healthcheck.php
When executing the script, we will be shown the result of this check in the same command line where we have carried out the execution.
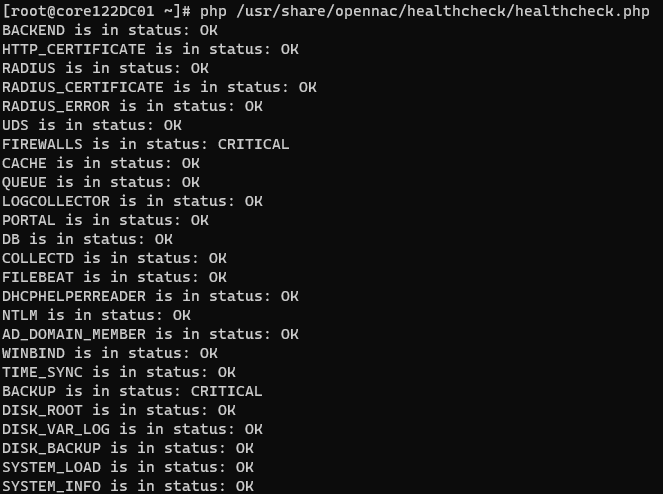
We will be able to see, as mentioned above, the different states of the main services.
An “OK” result indicates that said service works correctly.
A “WARNING” result notifies us that the service fails but the affectation is not critical.
A CRITICAL result indicates that this service does not work correctly and can compromise the correct operation of the system.
The tests that are carried out to run this check can be found in the following directory:
cd /usr/share/opennac/healthcheck/libexec
In this directory, we will have the possibility of individually executing each of these tests to see its result. In case of obtaining a result that we do not expect, we can carry out the troubleshooting process by executing said test in “shell debug” mode with the following command:
sh -x /usr/share/opennac/healthcheck/libexec/<test>.sh
There is the possibility of activating or deactivating the tests that we want in the execution of the health check. For this, we have to access the file /usr/share/opennac/healthcheck/healthcheck.ini. We can deactivate/activate the test in question by adding/eliminating the symbol “;” at the beginning of the line respectively.
List of services that can be checked
AD_DOMAIN_MEMBER: Checks the host’s connection with the Active Directory (AD) to ensure it is maintained correctly.
ADM_USERS_PASSWD_EXPIRATION: Checks the expiration dates of user passwords.
BACKEND: Checks the status of the API.
BACKUP: Checks the number of days since the last backup.
CACHE: Checks the status of the Redis service.
CAPTIVE_PORTAL: Checks if the captive portal is updated.
CAPTIVE_PORTAL_THEMES: Checks if the captive portal themes of a Worker machine are synchronized with the ON Principal.
COLLECTD: Checks the status of the COLLECTD process.
DB: Checks the status of the system’s MySQL database.
DBREPLICATION: Checks the replication of the system’s MySQL database.
DHCP: Checks the correct functioning of the DHCP Logger service, the DHCP process, and the DHCP-Helper-Reader process.
DHCPHELPERREADER: Checks the status of the DHCP-Helper-Reader process.
DISK_BACKUP: Checks the percentage of disk usage for the /backup directory.
DISK_ROOT: Checks the percentage of disk usage for the root directory (/).
DISK_TMP: Checks the percentage of disk usage for the /tmp directory.
DISK_VAR: Checks the percentage of disk usage for the /var directory.
DISK_VAR_LOG: Checks the percentage of disk usage for the /var/log directory.
DNS: Checks the status of the DNS server.
ELASTIC_INDEX_READ_ONLY: Checks if any of the Elasticsearch indices are in read-only mode.
ELASTICSEARCH: Checks the status of the Elasticsearch service.
FILEBEAT: Checks the status of the FILEBEAT process.
FIREWALLS: In the 2SRA use case, checks if all VPN Gateways are up and if their WireGuard and Redis services are functioning correctly.
HTTP_CERTIFICATE: Checks if the HTTP certificate has expired.
KIBANA: Checks the status of the KIBANA service.
LDAP: Checks the status of the SLAPD process.
LOGCOLLECTOR: Checks that the Rsyslog service is up and running.
LOGSTASH: Checks the status of the LOGSTASH service.
MEMCACHED: Checks the percentage of occupied memory in the CACHE.
NTLM: Checks the authentication by performing NTLM authentication against the AD server.
NXLOG: Checks the status of the Nxlog process.
PORTAL: Checks HTTP access to the administration portal.
QUEUES: Checks the status of the QUEUES service.
RADIUS: Checks the status of the RADIUS server.
RADIUS_CERTIFICATE: Checks if the RADIUS certificate has expired.
RAM: Checks the percentage of occupied RAM memory.
REMOTEQUEUE: Checks that the REMOTE QUEUES service is up and running.
SWAP: Checks the percentage of occupied SWAP memory.
SYSTEM_INFO: Checks the system role, shows the Core version, and checks that workers have the same version.
SYSTEM_LOAD: Checks the system load occupancy using the load average.
TIME_SYNC: Checks if the time is synchronized with the main node and the “TIME_SYNC” service is active and running.
UDS: Checks that the User Data Sources are active and working.
WINDBIND: Checks the status of the Windbind service.
ZEEK: Checks the status of the ZEEKCTL service.
Warning
The main services that can affect the authentication process in case of being in CRITICAL state are those of RADIUS, CERTIFICATE, UDS, BACKEND and NTLM.
If we don’t know what script is executing a specific healthcheck, we can check it in the following file:
cat /usr/share/opennac/healthcheck/healthcheck.ini | grep -A2 {{ healthcheck }}
For example, the script for ELASTICSEARCH healthcheck is in /usr/share/opennac/healthcheck/libexec/check_elasticsearch.sh:

In the following table we can find the different checks that are r performed in each of the different nodes.
Roles |
||||||||
|---|---|---|---|---|---|---|---|---|
TESTS |
PRINCIPAL |
WORKER |
PROXY |
ANALYTICS |
AGGREGATOR |
ANALY+AGG |
PORTAL |
SENSOR |
AD_DOMAIN_MEMBER |
X |
X |
||||||
ADM_USERS_PASSWD_EXPIRATION |
X |
|||||||
BACKEND |
X |
X |
||||||
BACKUP |
X |
X |
X |
X |
X |
X |
X |
X |
CACHE |
X |
X |
X |
X |
X |
X |
||
CAPTIVE_PORTAL |
X |
X |
||||||
CAPTIVE_PORTAL_THEMES |
X |
X |
||||||
COLLECTD |
X |
X |
X |
X |
X |
X |
X |
X |
DB |
X |
X |
||||||
DBREPLICATION |
X |
|||||||
DHCP |
X |
X |
||||||
DHCPHELPERREADER |
X |
X |
||||||
DISK_BACKUP |
X |
X |
X |
X |
X |
X |
X |
X |
DISK_ROOT |
X |
X |
X |
X |
X |
X |
X |
X |
DISK_TMP |
X |
X |
X |
X |
X |
X |
X |
X |
DISK_VAR |
X |
X |
X |
X |
X |
X |
X |
X |
DISK_VAR_LOG |
X |
X |
X |
X |
X |
X |
X |
X |
DNS |
X |
X |
X |
X |
X |
X |
X |
X |
ELASTICSEARCH |
X |
X |
||||||
ELASTIC_INDEX_READ_ONLY |
X |
X |
X |
X |
X |
X |
X |
X |
FILEBEAT |
X |
X |
X |
|||||
FIREWALLS |
X |
X |
||||||
HTTP_CERTIFICATE |
X |
X |
X |
|||||
KIBANA |
X |
X |
||||||
LDAP |
X |
|||||||
LOGCOLLECTOR |
X |
X |
X |
X |
X |
X |
X |
X |
LOGSTASH |
X |
X |
||||||
MEMCACHED |
X |
X |
||||||
NTLM |
X |
X |
||||||
NXLOG |
X |
X |
||||||
PORTAL |
X |
X |
X |
|||||
QUEUES |
X |
X |
||||||
RADIUS |
X |
X |
X |
|||||
RADIUS_CERTIFICATE |
X |
X |
X |
|||||
RAM |
X |
X |
X |
X |
X |
X |
X |
X |
REMOTEQUEUE |
X |
|||||||
SWAP |
X |
X |
X |
X |
X |
X |
X |
X |
SYSTEM_INFO |
X |
X |
X |
X |
X |
X |
X |
X |
SYSTEM_LOAD |
X |
X |
X |
X |
X |
X |
X |
X |
TIME_SYNC |
X |
X |
X |
X |
X |
X |
X |
X |
UDS |
X |
X |
||||||
WINDBIND |
X |
X |
||||||
ZEEK |
X |
5.5.3. Administration Portal
We can also find this result in the Administration Portal, at the interface upper right corner by clicking on the Status of onNAC infrastructure icon.

A drop-down will open and will display the status of our components. If we want to see the general result, we click on See full status of onNAC infrastructure.
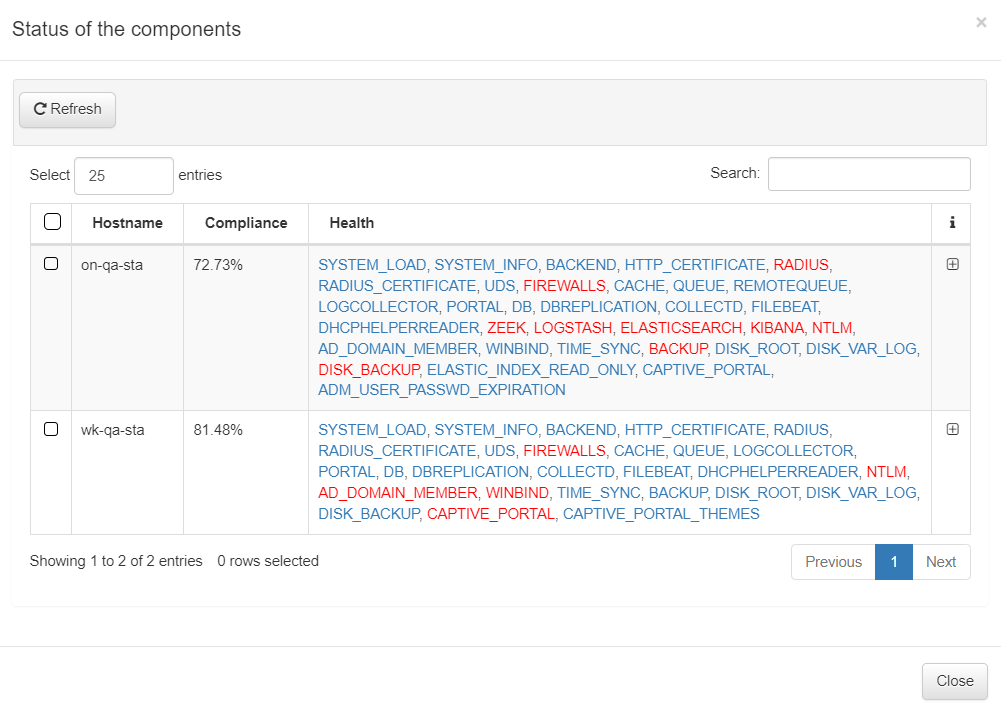
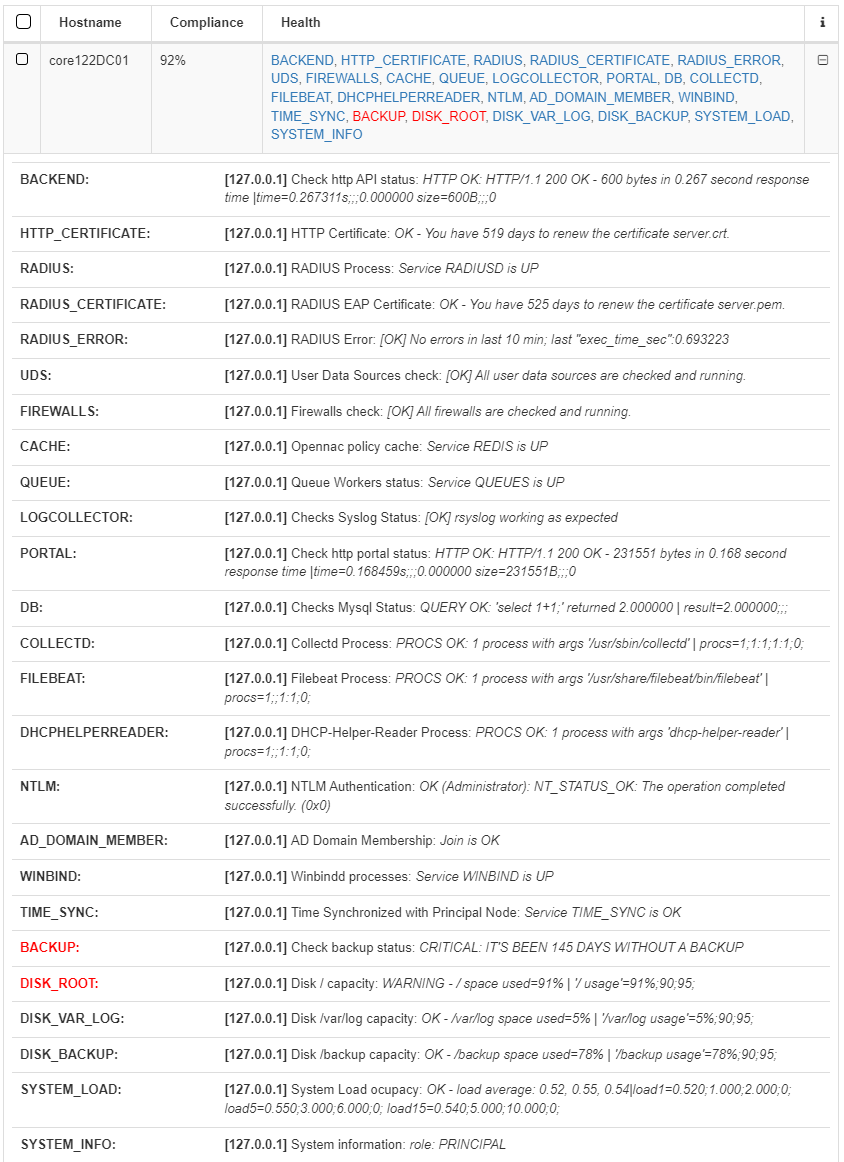
In the pop-up window, we can see the status of the last health check executed. Health checks are automatically executed every minute.
In this window, we can see the status of all the services:
Services with an “OK” result are shown in blue
Services with a “WARNING” result are shown in yellow
Services with a “CRITICAL” result are shown in red.
If we click on the “+” button we can see the conditions necessary for the services to work correctly. Note that these checks on the services are the same for both the CLI and the Administration portal.