9.3.3. ON Sensor Logs
Within the ON Sensor node we can find a large number of logs that can help us understand or detect errors that may arise during system operation.
9.3.3.1. Zeek Logs
As the principal service of the ON Sensor component, Zeek has several log files that can give us useful information. Inside /opt/zeek/logs/current/ there are a few directories that shows us the date of the logs.
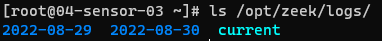
We will be looking at the “current” ones, as they would be the most useful in a troubleshooting moment.
Path:
/opt/zeek/logs/current/
As these logs are in JSON format, we can see them as usual:
tail -f </path/to/file.log>
Or we can use the “jq” tool to see them more clearly. If it is not installed, you should do dnf -y install jq.
jq . </path/to/file.log>
For further information you can visit the official Zeek documentation: https://docs.zeek.org/en/master/logs/index.html .
9.3.3.1.1. arp.log
This log shows information about network devices using ARP protocol.
Path:
/opt/zeek/logs/current/arp.log
Example:
{"ts":1661854998.461851,"src_mac":"aa:b5:66:21:47:49","src_addr":"10.10.39.254","dst_mac":"86:ae:de:90:a7:6f","dst_addr":"10.10.39.19","unsolicited":false,"no_resp":false,"who_has":"10.10.39.19","is_at":"86:ae:de:90:a7:6f"}
{"ts":1661855013.309851,"src_mac":"e2:ea:02:96:dd:1e","src_addr":"10.10.39.18","dst_mac":"aa:b5:66:21:47:49","dst_addr":"10.10.39.254","unsolicited":false,"no_resp":false,"who_has":"10.10.39.254","is_at":"aa:b5:66:21:47:49"}
{"ts":1661855022.525803,"src_mac":"f2:c5:40:37:02:2a","src_addr":"10.10.39.99","dst_mac":"aa:b5:66:21:47:49","dst_addr":"10.10.39.254","unsolicited":false,"no_resp":false,"who_has":"10.10.39.254","is_at":"aa:b5:66:21:47:49"}
{"ts":1661855049.665932,"src_mac":"86:ae:de:90:a7:6f","src_addr":"10.10.39.19","dst_mac":"aa:b5:66:21:47:49","dst_addr":"10.10.39.254","unsolicited":false,"no_resp":false,"who_has":"10.10.39.254","is_at":"aa:b5:66:21:47:49"}
9.3.3.1.2. capture_loss.log
Zeek produces several logs that tell administrators how well Zeek is managing its analysis and reporting on network traffic.
This capture_loss.log reports analysis of missing traffic. Zeek bases its conclusions on analysis of TCP sequence numbers. When it detects a “gap”, it assumes that the missing traffic corresponds to traffic loss. It reports the packet loss rate.
Path:
/opt/zeek/logs/current/capture_loss.log
Example:
{"ts":1661854190.040995,"ts_delta":900.0006427764893,"peer":"zeek","gaps":0,"acks":0,"percent_lost":0.0}
{"ts":1661855090.062711,"ts_delta":900.0217161178589,"peer":"zeek","gaps":0,"acks":0,"percent_lost":0.0}
9.3.3.1.3. conn.log
The connection log, or conn.log, is one of the most important logs Zeek creates. It shows IP, TCP, UDP and ICMP connection details. We can see information such as the state for each connection.
Path:
/opt/zeek/logs/current/conn.log
Example:
{"ts":1661855462.334055,"uid":"CnK0oC3hAYG3TjTON3","id.orig_h":"10.10.39.99","id.orig_p":58532,"id.resp_h":"8.8.8.8","id.resp_p":53,"proto":"udp","service":"dns","duration":0.0000030994415283203127,"orig_bytes":0,"resp_bytes":126,"conn_state":"SHR","local_orig":true,"local_resp":false,"missed_bytes":0,"history":"Cd","orig_pkts":0,"orig_ip_bytes":0,"resp_pkts":1,"resp_ip_bytes":154,"vlan":10,"orig_l2_addr":"f2:c5:40:37:02:2a","resp_l2_addr":"aa:b5:66:21:47:49"}
{"ts":1661855462.334067,"uid":"CnmXOe2gboPcTculk7","id.orig_h":"10.10.39.99","id.orig_p":47068,"id.resp_h":"8.8.8.8","id.resp_p":53,"proto":"udp","service":"dns","duration":0.000008821487426757813,"orig_bytes":0,"resp_bytes":122,"conn_state":"SHR","local_orig":true,"local_resp":false,"missed_bytes":0,"history":"Cd","orig_pkts":0,"orig_ip_bytes":0,"resp_pkts":1,"resp_ip_bytes":150,"vlan":10,"orig_l2_addr":"f2:c5:40:37:02:2a","resp_l2_addr":"aa:b5:66:21:47:49"}
{"ts":1661855462.334073,"uid":"CqwiBP2s6GTfZwZv7a","id.orig_h":"10.10.39.99","id.orig_p":33901,"id.resp_h":"8.8.8.8","id.resp_p":53,"proto":"udp","service":"dns","duration":0.0000059604644775390629,"orig_bytes":0,"resp_bytes":122,"conn_state":"SHR","local_orig":true,"local_resp":false,"missed_bytes":0,"history":"Cd","orig_pkts":0,"orig_ip_bytes":0,"resp_pkts":1,"resp_ip_bytes":150,"vlan":10,"orig_l2_addr":"f2:c5:40:37:02:2a","resp_l2_addr":"aa:b5:66:21:47:49"}
{"ts":1661855462.334085,"uid":"C8dMn6108D3UfVEsB5","id.orig_h":"10.10.39.99","id.orig_p":55415,"id.resp_h":"8.8.8.8","id.resp_p":53,"proto":"udp","service":"dns","duration":0.0000059604644775390629,"orig_bytes":0,"resp_bytes":112,"conn_state":"SHR","local_orig":true,"local_resp":false,"missed_bytes":0,"history":"Cd","orig_pkts":0,"orig_ip_bytes":0,"resp_pkts":1,"resp_ip_bytes":140,"vlan":10,"orig_l2_addr":"f2:c5:40:37:02:2a","resp_l2_addr":"aa:b5:66:21:47:49"}
{"ts":1661855462.334088,"uid":"CjIajU37qZE1iIgOtd","id.orig_h":"10.10.39.99","id.orig_p":38908,"id.resp_h":"8.8.8.8","id.resp_p":53,"proto":"udp","service":"dns","duration":0.000007867813110351563,"orig_bytes":0,"resp_bytes":112,"conn_state":"SHR","local_orig":true,"local_resp":false,"missed_bytes":0,"history":"Cd","orig_pkts":0,"orig_ip_bytes":0,"resp_pkts":1,"resp_ip_bytes":140,"vlan":10,"orig_l2_addr":"f2:c5:40:37:02:2a","resp_l2_addr":"aa:b5:66:21:47:49"}
9.3.3.1.4. dns.log
The Domain Name System (DNS) log, or dns.log, shows the DNS query/response details. Although recent developments in domain name resolution have challenged traditional methods for collecting DNS data, dns.log remains a powerful tool for security and network administrators.
Path:
/opt/zeek/logs/current/dns.log
Example:
{"ts":1661855641.885962,"uid":"CDYKRB3mJ8N9juNutj","id.orig_h":"10.10.39.99","id.orig_p":49249,"id.resp_h":"8.8.8.8","id.resp_p":53,"proto":"udp","trans_id":8690,"rcode":3,"rcode_name":"NXDOMAIN","AA":false,"TC":false,"RD":false,"RA":false,"Z":0,"rejected":false}
{"ts":1661855641.885979,"uid":"CLJ52O1AKjzgcdso8c","id.orig_h":"10.10.39.99","id.orig_p":41961,"id.resp_h":"8.8.8.8","id.resp_p":53,"proto":"udp","trans_id":50917,"rcode":3,"rcode_name":"NXDOMAIN","AA":false,"TC":false,"RD":false,"RA":false,"Z":0,"rejected":false}
{"ts":1661855641.885976,"uid":"CsXqLXC8seiQoGTY4","id.orig_h":"10.10.39.99","id.orig_p":36013,"id.resp_h":"8.8.8.8","id.resp_p":53,"proto":"udp","trans_id":10153,"rcode":3,"rcode_name":"NXDOMAIN","AA":false,"TC":false,"RD":false,"RA":false,"Z":0,"rejected":false}
{"ts":1661855641.885991,"uid":"CgrZ5a24H0CZvrfAq9","id.orig_h":"10.10.39.99","id.orig_p":41363,"id.resp_h":"8.8.8.8","id.resp_p":53,"proto":"udp","trans_id":63775,"rcode":3,"rcode_name":"NXDOMAIN","AA":false,"TC":false,"RD":false,"RA":false,"Z":0,"rejected":false}
{"ts":1661855641.885988,"uid":"CqcqMe3eGR5yyakeyc","id.orig_h":"10.10.39.99","id.orig_p":50049,"id.resp_h":"8.8.8.8","id.resp_p":53,"proto":"udp","trans_id":57167,"rcode":3,"rcode_name":"NXDOMAIN","AA":false,"TC":false,"RD":false,"RA":false,"Z":0,"rejected":false}
9.3.3.1.5. ntp.log
Network Time Protocol (NTP) is another core protocol found in IP networks. We can use Zeek logs to identify NTP clients and servers, and determine if they are operating as expected.
Path:
/opt/zeek/logs/current/ntp.log
Example:
{"ts":1661855601.437758,"uid":"CAeV7t4qrwJeaXToM","id.orig_h":"10.10.39.18","id.orig_p":45190,"id.resp_h":"162.159.200.123","id.resp_p":123,"version":4,"mode":4,"stratum":3,"poll":1024.0,"precision":2.9802322387695315e-8,"root_delay":0.018463134765625,"root_disp":0.000579833984375,"ref_id":"10.15.13.87","ref_time":1661855573.662673,"org_time":1395413264.771431,"rec_time":1661855600.910355,"xmt_time":1661855600.9103976,"num_exts":0}
{"ts":1661855602.461791,"uid":"CdnoWq2djGk3TLKzVe","id.orig_h":"10.10.39.18","id.orig_p":39035,"id.resp_h":"162.159.200.1","id.resp_p":123,"version":4,"mode":4,"stratum":3,"poll":1024.0,"precision":2.9802322387695315e-8,"root_delay":0.0184783935546875,"root_disp":0.000518798828125,"ref_id":"10.15.13.87","ref_time":1661855598.9264096,"org_time":151038811.6112045,"rec_time":1661855602.104326,"xmt_time":1661855602.1043704,"num_exts":0}
{"ts":1661855603.485867,"uid":"CkryK11ZIH6qcVqtYk","id.orig_h":"10.10.39.18","id.orig_p":50282,"id.resp_h":"51.195.26.119","id.resp_p":123,"version":4,"mode":4,"stratum":2,"poll":1024.0,"precision":2.9802322387695315e-8,"root_delay":0.0111541748046875,"root_disp":0.00146484375,"ref_id":"93.238.129.164","ref_time":1661855576.3693777,"org_time":1068719732.4303062,"rec_time":1661855603.2450586,"xmt_time":1661855603.245702,"num_exts":0}
{"ts":1661855608.093936,"uid":"Cw7nMa3bOMAQfvPkK7","id.orig_h":"10.10.39.99","id.orig_p":123,"id.resp_h":"51.38.162.10","id.resp_p":123,"version":4,"mode":4,"stratum":2,"poll":256.0,"precision":2.9802322387695315e-8,"root_delay":0.0189361572265625,"root_disp":0.0015411376953125,"ref_id":"192.168.100.15","ref_time":1661854762.0278586,"org_time":1661855608.0512329,"rec_time":1661855608.0665103,"xmt_time":1661855608.066558,"num_exts":0}
{"ts":1661855613.213868,"uid":"CwcgJF4EDX2Zcv2qs9","id.orig_h":"10.10.39.99","id.orig_p":123,"id.resp_h":"162.159.200.123","id.resp_p":123,"version":4,"mode":4,"stratum":3,"poll":256.0,"precision":2.9802322387695315e-8,"root_delay":0.018463134765625,"root_disp":0.0008544921875,"ref_id":"10.15.13.87","ref_time":1661855523.4531093,"org_time":1661855613.0512503,"rec_time":1661855613.122458,"xmt_time":1661855613.1224914,"num_exts":0}
9.3.3.1.6. stats.log
Shows the Zeek status regarding Memory/event/packet/lag statistics.
Path:
/opt/zeek/logs/current/stats.log
Example:
{"ts":1661855092.935922,"peer":"zeek","mem":72,"pkts_proc":1008,"bytes_recv":80218,"pkts_dropped":0,"pkts_link":1008,"pkt_lag":0.0014801025390625,"events_proc":860,"events_queued":860,"active_tcp_conns":1,"active_udp_conns":5,"active_icmp_conns":1,"tcp_conns":0,"udp_conns":71,"icmp_conns":1,"timers":1839,"active_timers":70,"files":0,"active_files":0,"dns_requests":0,"active_dns_requests":0,"reassem_tcp_size":24940,"reassem_file_size":0,"reassem_frag_size":0,"reassem_unknown_size":0}
{"ts":1661855392.937399,"peer":"zeek","mem":72,"pkts_proc":1474,"bytes_recv":186737,"pkts_dropped":0,"pkts_link":1474,"pkt_lag":0.013460159301757813,"events_proc":954,"events_queued":957,"active_tcp_conns":1,"active_udp_conns":3,"active_icmp_conns":0,"tcp_conns":4,"udp_conns":71,"icmp_conns":6,"timers":1870,"active_timers":66,"files":0,"active_files":0,"dns_requests":0,"active_dns_requests":0,"reassem_tcp_size":0,"reassem_file_size":0,"reassem_frag_size":0,"reassem_unknown_size":0}
{"ts":1661855692.937795,"peer":"zeek","mem":72,"pkts_proc":1650,"bytes_recv":179357,"pkts_dropped":0,"pkts_link":1650,"pkt_lag":0.002432107925415039,"events_proc":864,"events_queued":862,"active_tcp_conns":1,"active_udp_conns":1,"active_icmp_conns":5,"tcp_conns":0,"udp_conns":71,"icmp_conns":8,"timers":1851,"active_timers":71,"files":0,"active_files":0,"dns_requests":0,"active_dns_requests":0,"reassem_tcp_size":0,"reassem_file_size":0,"reassem_frag_size":0,"reassem_unknown_size":0}
9.3.3.1.7. stderr.log
Captures standard error when Zeek is started from ZeekControl.
Path:
/opt/zeek/logs/current/stderr.log
Example:
listening on enp6s20
9.3.3.1.8. stdout.log
Captures standard output when Zeek is started from ZeekControl.
Path:
/opt/zeek/logs/current/stdout.log
Example:
max memory size         (kbytes, -m) unlimited
data seg size           (kbytes, -d) unlimited
virtual memory          (kbytes, -v) unlimited
core file size          (blocks, -c) unlimited
9.3.3.2. healthcheck.log
This log contains information related to the errors that might occur when healthcheck is being executed.
Path:
/var/log/opennac/healthcheck.log
Example:
DHCPHELPERREADER [30/08/2022 11:51:03]: PROCS CRITICAL: 0 processes with args 'dhcp-helper-reader' | procs=0;;1:1;0;
9.3.3.3. Filebeat Logs
As we can see in the filebeat configuration file /etc/filebeat/filebeat.yml, this service gets the logs from the previously described zeek logs.
Command:
journalctl -xe -u filebeat
Example:
Aug 30 12:48:59 09-sensor-03 filebeat[31527]: 2022-08-30T12:48:59.470+0200        INFO        [monitoring]        log/log.go:145        Non-zero metrics in the last 30s        {"monitoring": {"metrics": {"beat":{"cpu":{"system":{"ticks":8970,"time":{"ms":22}},"tota>
Aug 30 12:49:29 09-sensor-03 filebeat[31527]: 2022-08-30T12:49:29.470+0200        INFO        [monitoring]        log/log.go:145        Non-zero metrics in the last 30s        {"monitoring": {"metrics": {"beat":{"cpu":{"system":{"ticks":9010,"time":{"ms":38}},"tota>
Aug 30 12:49:32 09-sensor-03 filebeat[31527]: 2022-08-30T12:49:32.891+0200        INFO        log/harvester.go:278        File is inactive: /opt/zeek/logs/current/dhcp.log. Closing because close_inactive of 5m0s reached.
Aug 30 12:49:43 09-sensor-03 filebeat[31527]: 2022-08-30T12:49:43.053+0200        INFO        log/harvester.go:253        Harvester started for file: /opt/zeek/logs/current/dhcp.log