5.1.2.1. SNMP
The SNMP protocol (Simple Network Management Protocol) allows us to exchange management data between network devices.
From OpenNAC Enterprise, we support both SNMP v1, SNMP v2 and SNMP v3 so that external agents can monitor the behavior of the different components. To carry out this monitoring, we will filter the IP from the firewall so that only certain authorized devices can obtain information about OpenNAC Enterprise. This way, we can have more limited visibility to external devices.
The SNMP service is configured so that the status of each of the services included in the health check can be queried. We can carry out this check for ON Core Principal/Worker, ON Analytics, ON Sensor and ON Core Proxy.
Here we have a list of the available services for consultation:

The above table can be viewed in more detail at OpenNAC SNMP OIDs
5.1.2.1.1. Configuration
In order to consult the statuses of the services, the first step to take is to allow the SNMP flow in the iptables of the component that we are going to monitor.
>/etc/sysconfig/iptables
# SNMP enabled
-A INPUT -p udp -m state --state NEW -m udp --dport 161 -j ACCEPT
-A INPUT -s <Source-IP> -p udp -m state --state NEW -m udp --dport 161 -j ACCEPT
The value of <Source-IP> will be the IP address of the component that performs the monitoring. It will be necessary to restart the lasiptables service after this modification using the following command:
service iptables restart
5.1.2.1.2. Consultation
Once we have configured this first step, we have several methods to consult the status of the services.
The first method is to check the specific status of one of the services. To do this, we will have to use the following OIDs and access with the configured community value (by default it has a public value).
To know the status of the BACKEND service, for example, we use the following command:
snmpget -v2c -c public <IP_node> 'NET-SNMP-EXTEND-MIB::nsExtendResult."BACKEND"'
We can use the following command if we want to obtain more detailed information:
snmpget -v2c -c public <IP_node> 'NET-SNMP-EXTEND-MIB::nsExtendOutLine."BACKEND".1'
The name of the services corresponds to those shown in the previous table. We can also obtain a list of the services and the different options with the following command:
snmpwalk -v2c -c public <IP_node>.1.3.6.1.4.1.8072.1.3.2
Important, it is recommended to customize the value of the “snmp community”, which we can find in the file /etc/snmp/snmpd.conf.
5.1.2.1.3. Nagios
The second method that we can use, is by using the script monitor_client.sh.
This plugin can be found in /usr/share/opennac/healthcheck/integration/monitor_client.sh.
It is a flexible plugin that can be used with monitoring software such as Icingao PRTG Monitor.
If we execute this script we will be able to see the different parameters that we can customize to carry out our monitoring process.
-H| --host OPENNAC SERVER
openNAC server to connect by SNMP to retrieve service status
Default: localhost

-g| --service SERVICE NAME
service name to check (ex: BACKEND, DBREPLICATION or UDS)
Required

-o| --output-style OUTPUT STYLE
output format to send information.
Options available: PRTG NAGIOS
Default: NAGIOS

-c| --community COMMUNITY
community string to connect by SNMP
Default: public

-p| --snmpget-path SNMPGET PATH
snmpget path
Default: /usr/bin/snmpget

-h| --help
display this help and exit
H: IP value of the node to which we are going to monitor (localhost by default)
s: Name of the service from which we want to obtain the status (following the format of the previous table)
o: Format in which we want to obtain the response; PRTG or NAGIOS
c: Value of the community string to connect to via SNMP (by default public)
p: Address of the snmpget process(by default /usr/bin/snmpget)
h: Help menu
Once we execute the script, for example about the BACKEND service, we will obtain a response message that will indicate the status of said service. Remember that this result can be OK, WARNING or CRITICAL.
[root@on-ci-sta integration]# sh monitor_client.sh
1- 5 BACKEND
HTTP OK: HTTP/1.1 200 OK
493 bytes in 0.147 second response time /time=0.147211s;;;0.000000 size=493B;;;0
The following sections will show a configuration example for the PRTG Monitor and Icinga tools
5.1.2.1.4. PRTG Monitor
There is a script called monitor_client.sh that can be used to query the status of system services via SNMP. This can be integrated into tools such as PRTG Monitor. In case you want to use it, the first step will be to copy the script monitor_client.sh into the /var/prtg/scripts.
mkdir -p /var/prtg/script
cp -p /usr/share/opennac/healthcheck/integration/monitor_client.sh /var/prtg/scripts/
Before adding a new sensor, we have to create a new device group and then a device. As an example we will create the group “openNAC” and the device “Core 1.2.1”.
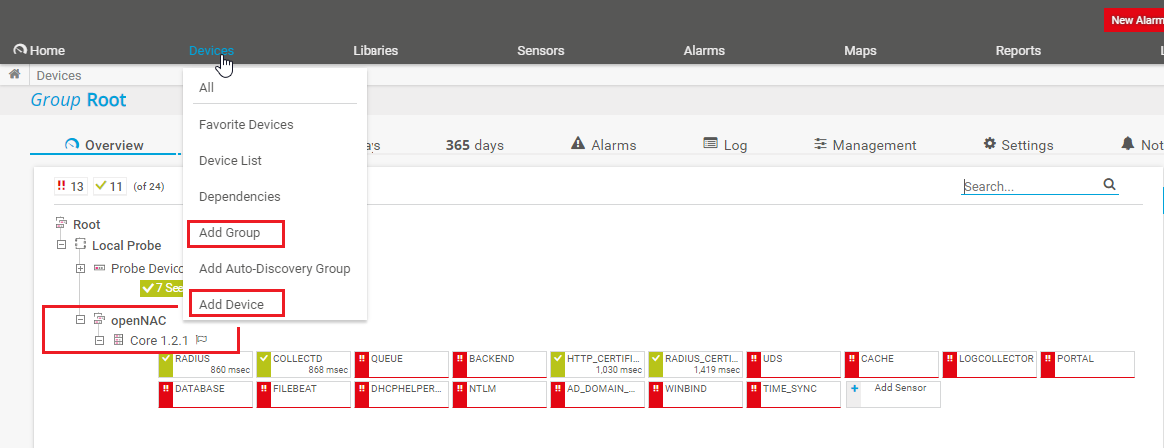
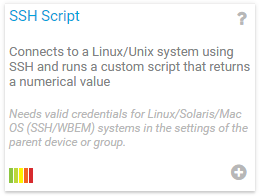
The next step will be to add the new sensor. We click on our device and then add sensor. We look for the SSH script.
The next step will be to configure this new sensor. We have to configure at least the following parameters:
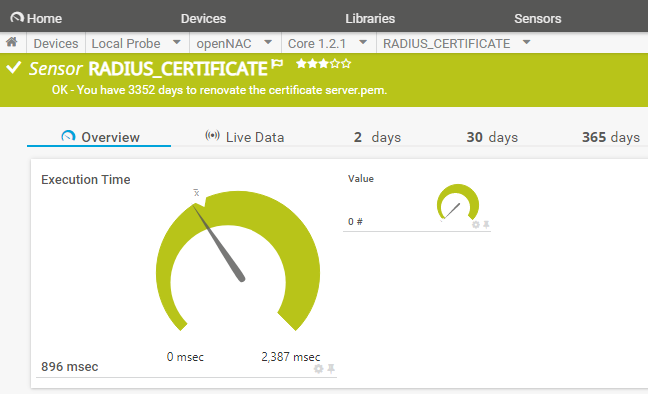
Sensor name = <service name> (we use the RADIUS_CERTIFICATE service as an example)
Script = monitor_client.sh (Remember that the PRTG tool will look for it in the /var/prtg/scripts directory)
Parameters = -H localhost -s RADIUS_CERTIFICATE -o PRTG
Once we run the sensor, scan we can see the result and status of said service.