5.1.2.2. Icinga
There is also the possibility of using an Icinga system to check the status of our services.
The first step to take is to check in our Icinga monitoring node, the different plugins that we have installed, in our case we are interested in having the nagios-plugins-snmp plugin. x86_64.
We can check if we already have it installed with the following command:
rpm -qa | grep nagios-plugins-snmp
If we do not have it installed, we can install it by using the following command:
dnf install nagios-plugins-snmp.x86_64
Once we have installed the plugin, we can check our system services by executing the following command on our monitoring node:
/usr/lib64/nagios/plugins/check_snmp -H <monitored_node_IP> -c public -o 'NET-SNMP-EXTEND-MIB::nsExtendOutLine."<service_name>".1'
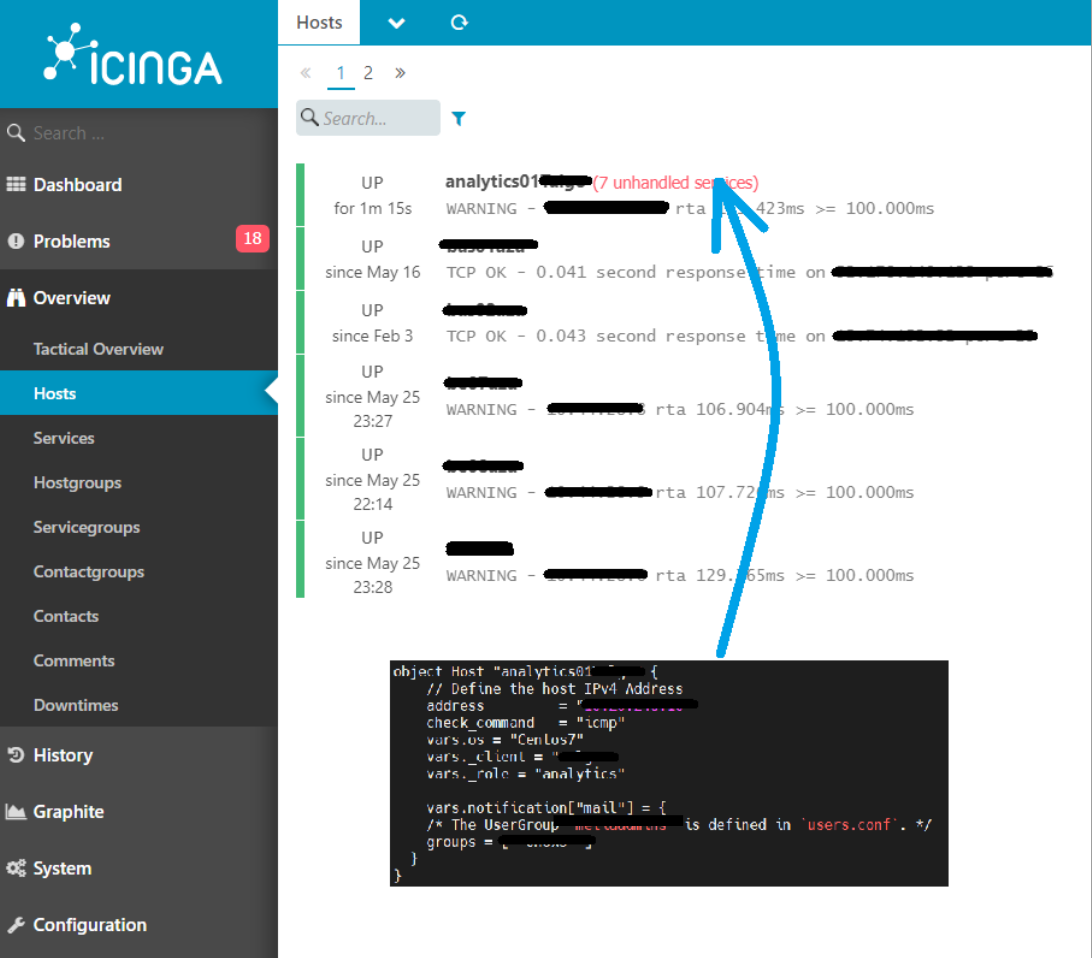
With this monitoring system, Icinga also has the ability to view the status of our monitored nodes on the frontend. For this, we will have to create a new configuration file for each infrastructure within the /etc/icinga2/conf.d/ directory of the monitoring system.
In this file, the hosts to be monitored will be specified through the SNMP commands explained above. In the following image, we can see the details of an ON Analytics host (analytics01) defined in our configuration file: