8.2. Network Devices Integration
This integration is used to gain insight into network events by sending network device logs to our ON Analytics. The ON Analytics will store the logs in the Elasticsearch external_syslog-* index.
8.2.1. Configure Network devices to send logs
To configure the Network devices to send logs to our ON Analytics it is necessary to configure the specific network device to send logs to ON Analytics IP on port 5003 via udp.
To find out how to do this, visit your network device brand’s website and follow the instructions.
Cisco example:
enable
configure terminal
logging enable
logging host <ip> transport udp port 5003
8.2.2. Open port 5003 for receiving UDP events on ON Analytics
It is necessary to allow network device events at ON Analytics. To do that, we need add a new iptables rule:
vi /etc/sysconfig/iptables
We need to allow the port 5003 for UDP by adding the following line:
-A INPUT -p udp -m state --state NEW -m udp --dport 5003 -j ACCEPT
Finally, it is necessary to restart the iptables service:
systemctl restart iptables
8.2.3. Configure Logstash pipeline to process logs
It is necessary to activate the external-syslog Logstash pipeline. To do that, go to:
vi /etc/logstash/pipelines.yml
Then uncomment the following lines that will activate the logstash pipeline:
- pipeline.id: external-syslog
path.config: "/etc/logstash/external-syslog/conf.d/*.conf"
Finally, it is necessary to restart Logstash service:
systemctl restart logstash
8.2.4. Network Devices syslog dashboard
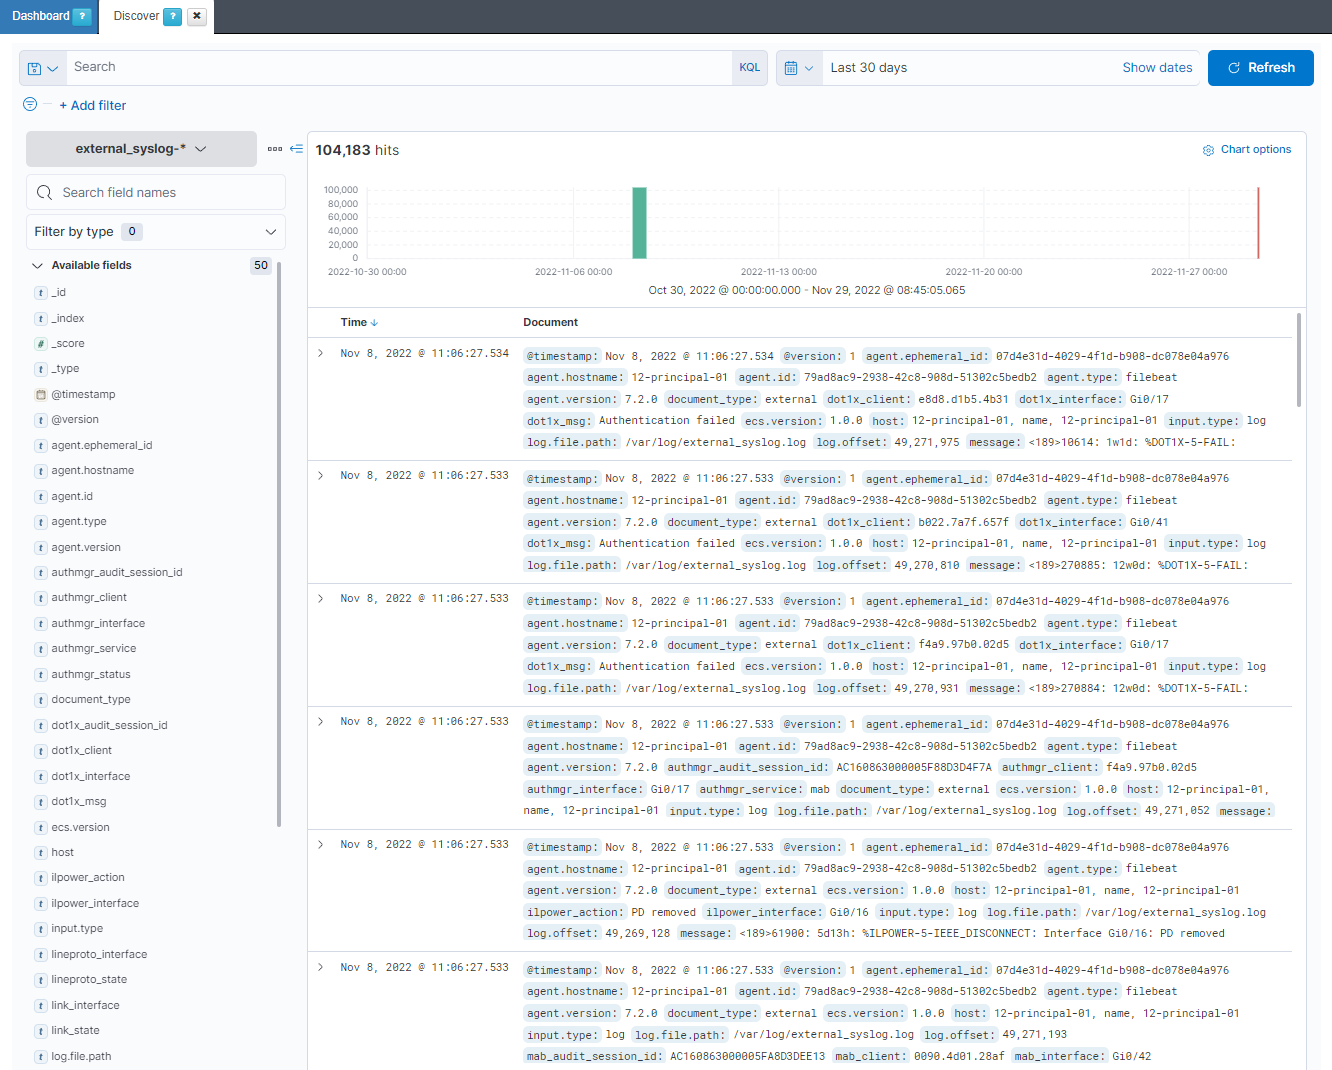
First of all, we need to check that the information is saved in the Elasticsearch. To do that, we need to go to Analytics -> Discover and select the external_syslog-* index:
If we are receiving information, we need to activate the dashboard by going to Configuration -> Dashboards -> Dashboard list:
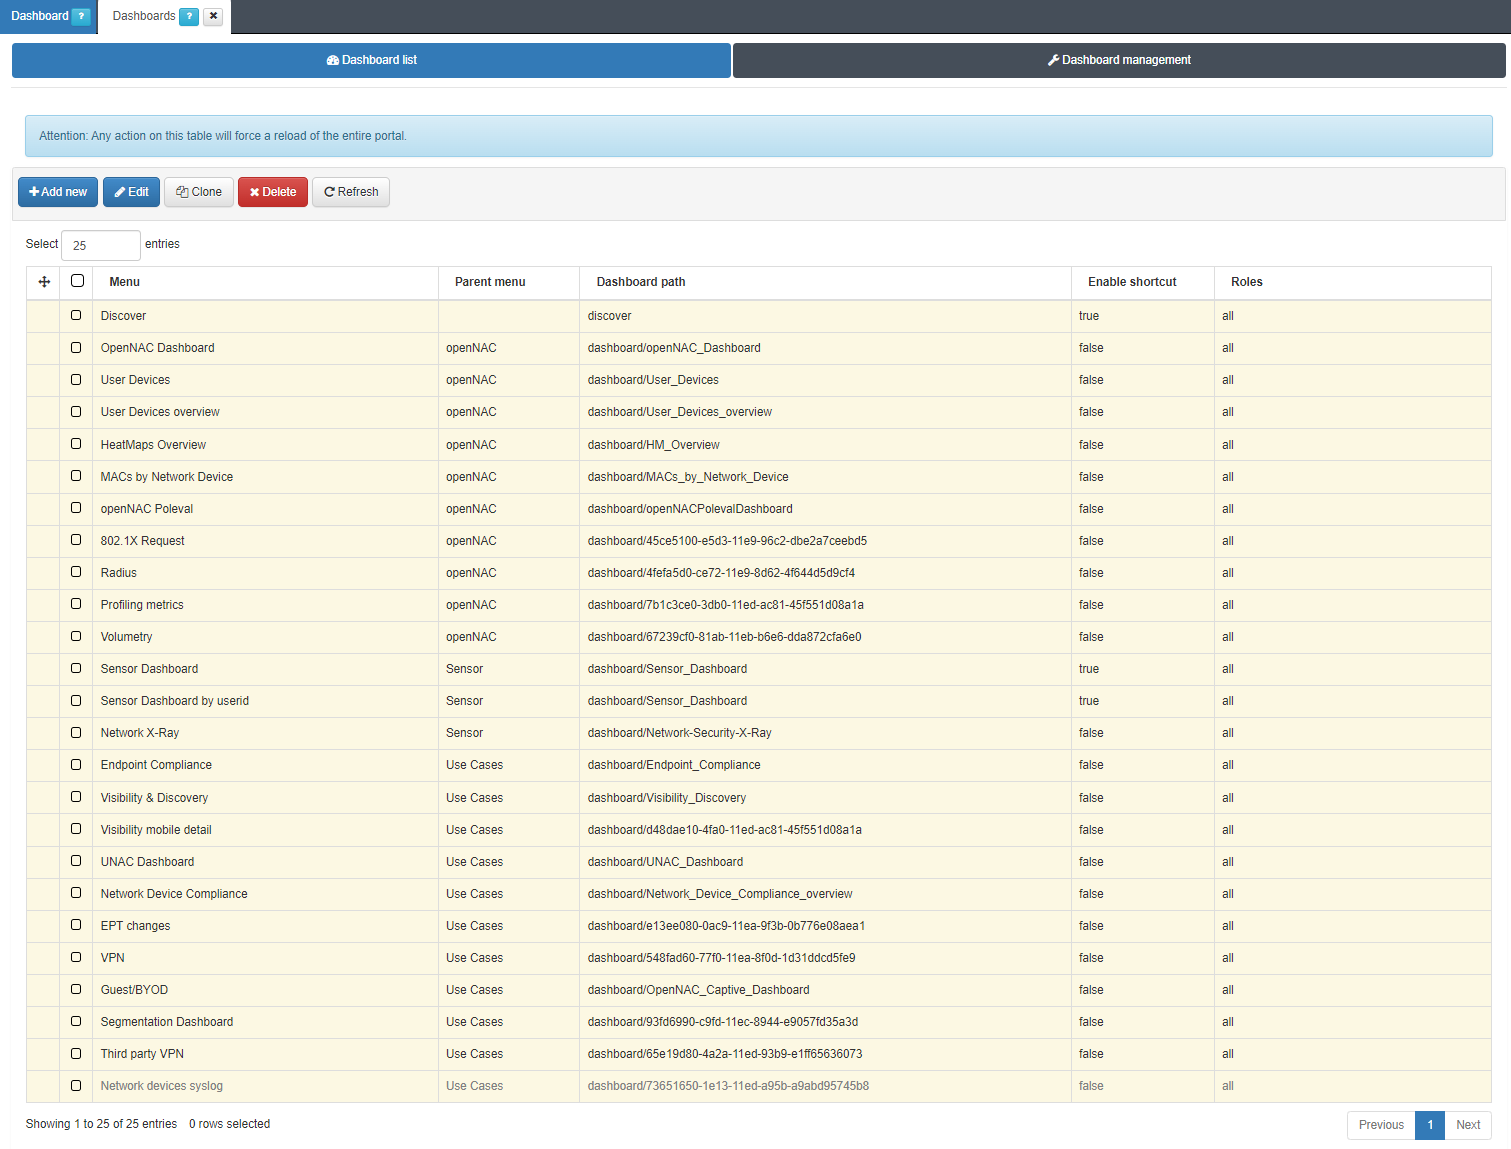
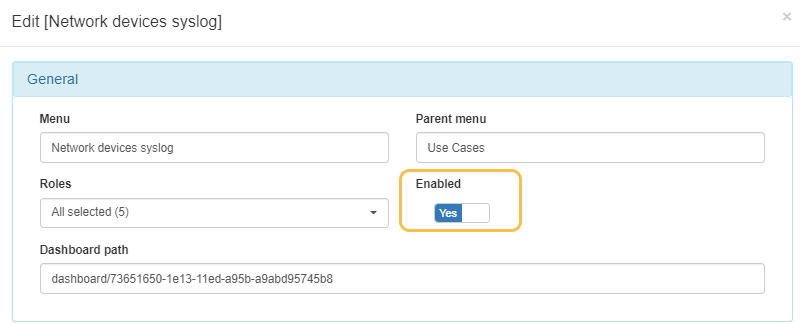
We need to activate the Network device syslog dashboard. Click on Edit and enable it by switching the flag to Yes.
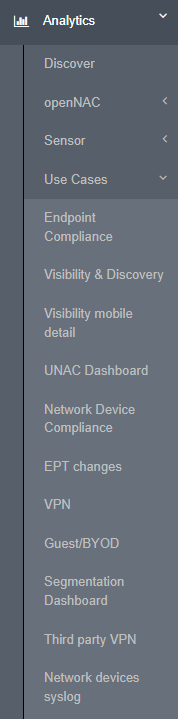
We will see the dashboard will be displayed in the menu:
And if we click on it, we will be able to see the dashboard.
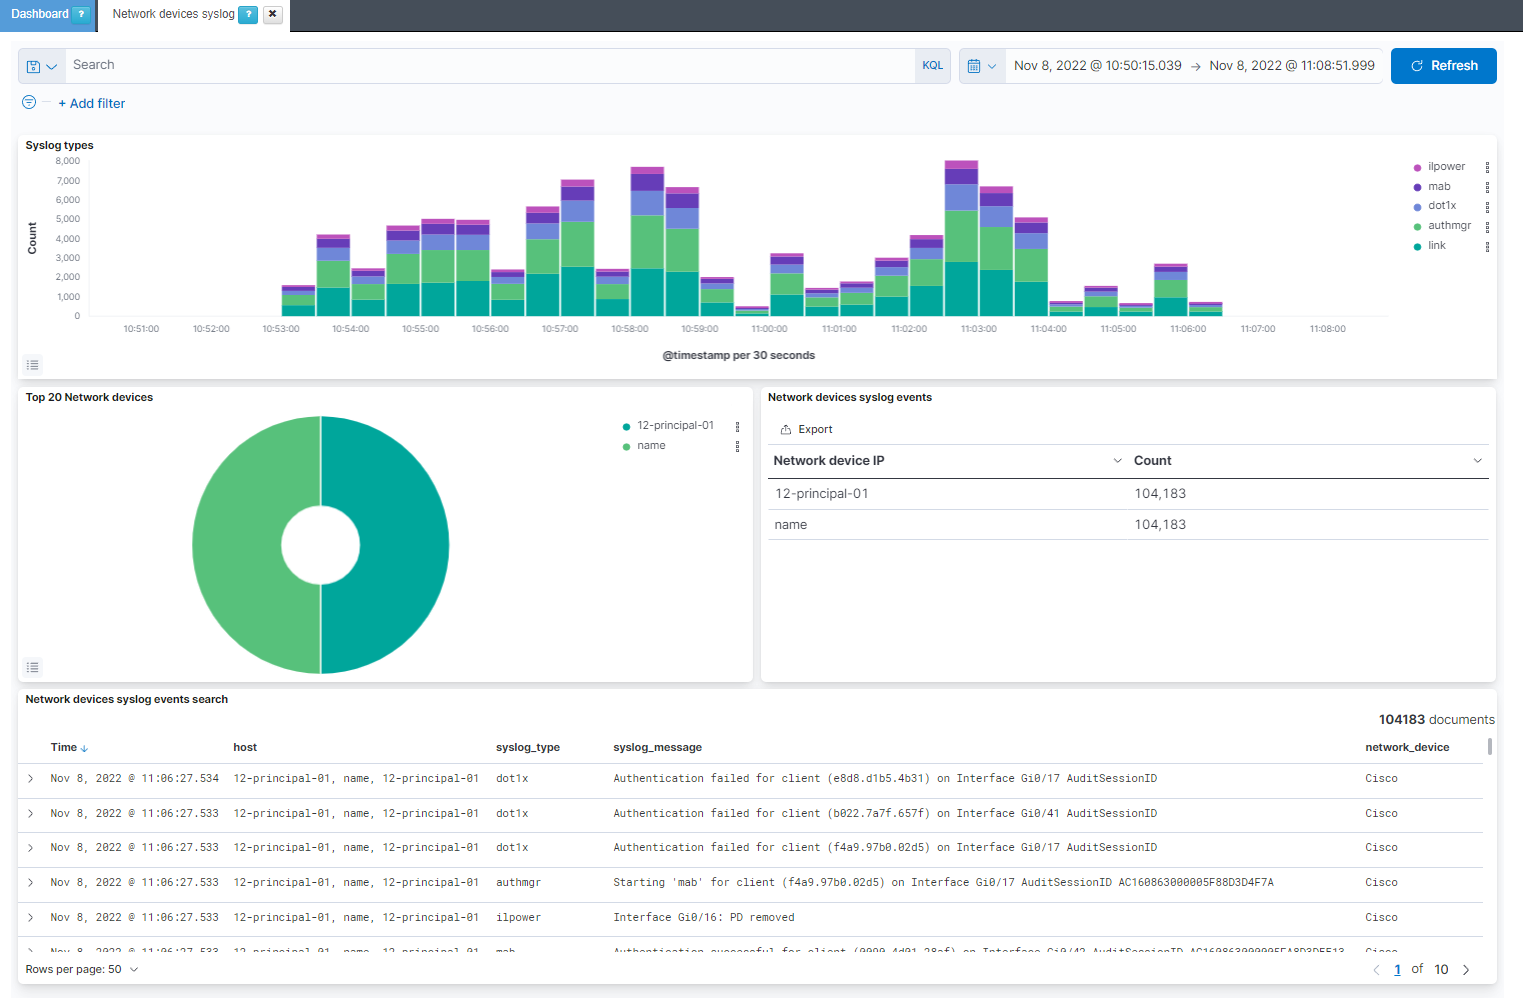
Syslog types: Shows over the time the network devices events separated by the syslog event type.
Top 20 Network devices: Shows the percentage of events per top 20 network devices.
Network devices syslog events: Shows the network devices IP with the event count for each one.
Network devices syslog events search: Shows the events in external_syslog-* index with the host, the syslog_type, the syslog_message and the type of network_device. At the moment there are only parsed the events for Cisco and Huawei network devices.