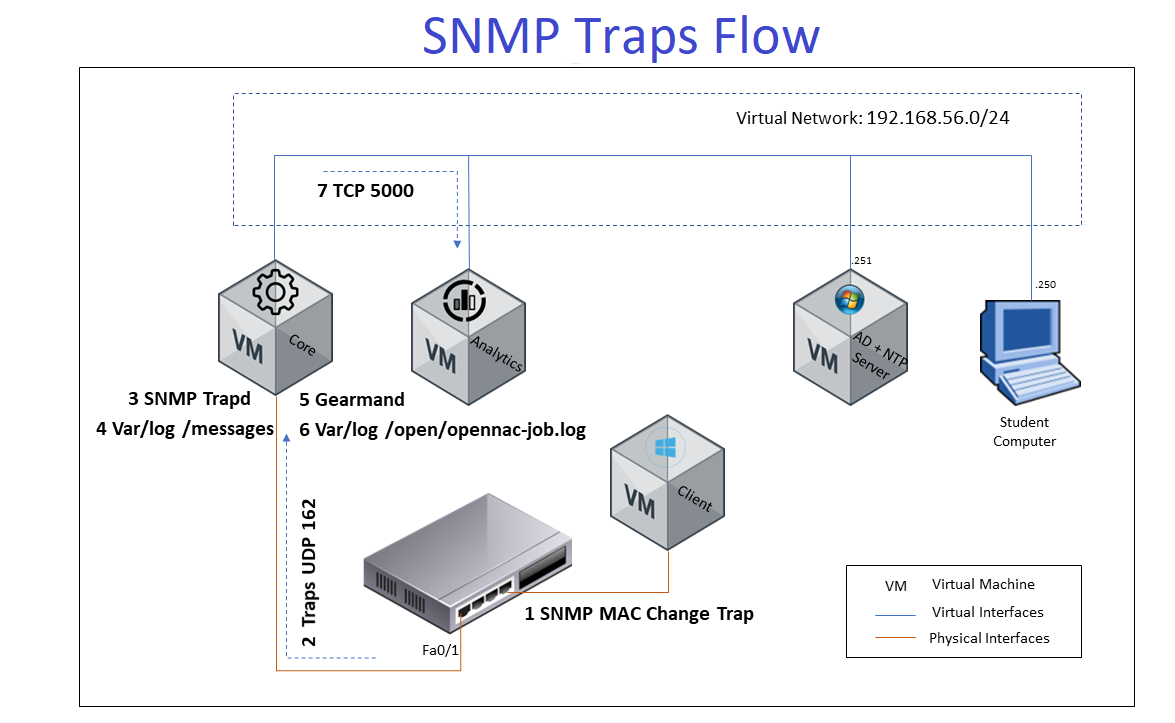
SNMP Traps
The follow image shows the flow for traps, it can be use to understand how it works, and it is a valid item for approach the troubleshooting.
On Switch
Verify that the snmp packets has been generated by switch
debug snmp packets
show debbuging
terminal monitor
Connect and disconnect a device to switch port Check the switch console
On Core
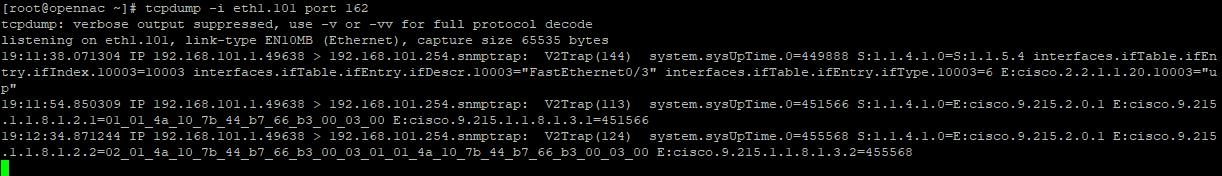
Using tcpdump command, verify that the snmp traps has been received by Core.
tcpdump -i eth0 port 162
Verify the snmp trap service is up and running
service snmptrapd status
If is not running start it.
service snmptrapd start
Go to /var/log/messages, verify the log file has been writed, check the timestamp of smnp trap log
tail -f /var/log/messages | grep snmptrapd
Verify the gearman queues service is up and running
service gearmand status
If is not running start it.
service gearmand start
Go to /var/log/opennac, verify the opennac-job.log file has been writed.
tail -f /var/log/opennac/opennac-job.log | grep -i snmp
Go to /var/log/opennac-poleval.log and verify that openNAC poleval events file has been writed with a SnmpMacUp or SnmpMacDown.
tail -f /var/log/opennac/opennac-poleval.log
Go to /var/log/httpd/opennac-*_log and verify that openNAC http/https events file has been writed.
<MAC ADDRESS> identify the physical address, verify the response http code, you can verify some API error like database issue or similar.
tail -f /var/log/httpd/opennac-*_log | grep -i <MAC ADDRESS>
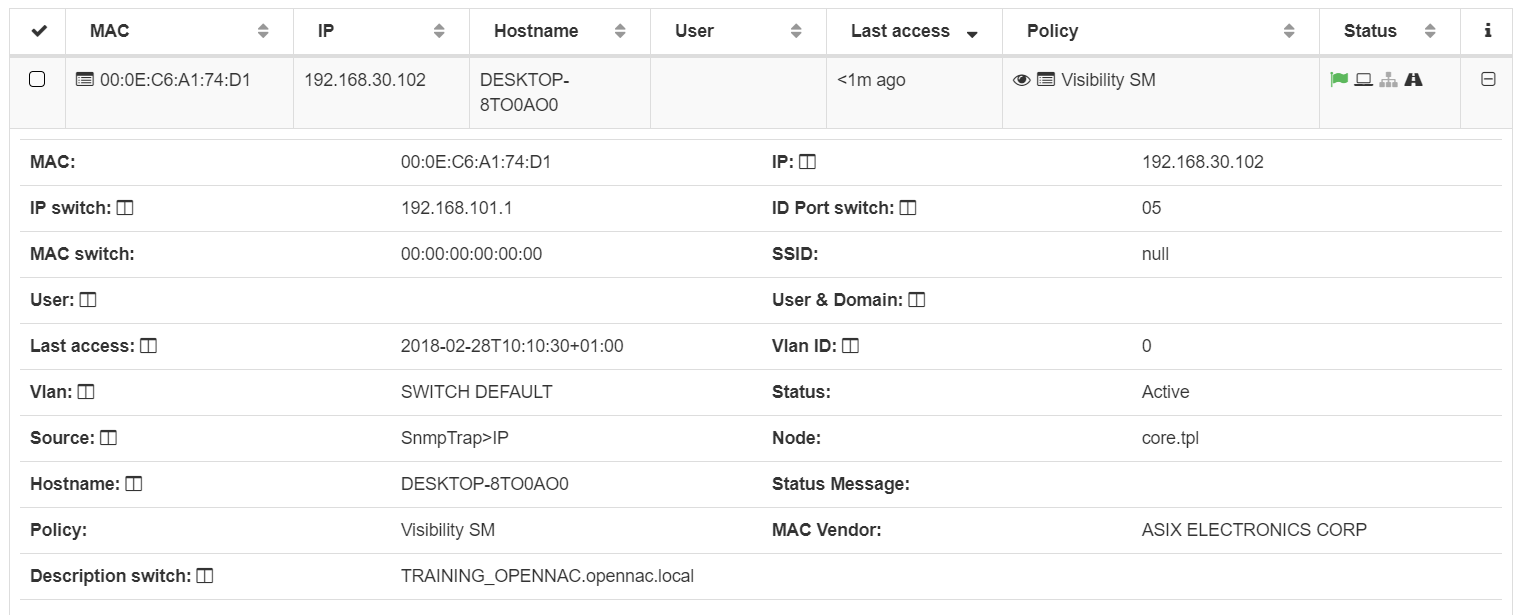
On web administration console go to ON NAC -> Business Profiles and check the list, verify the mac address
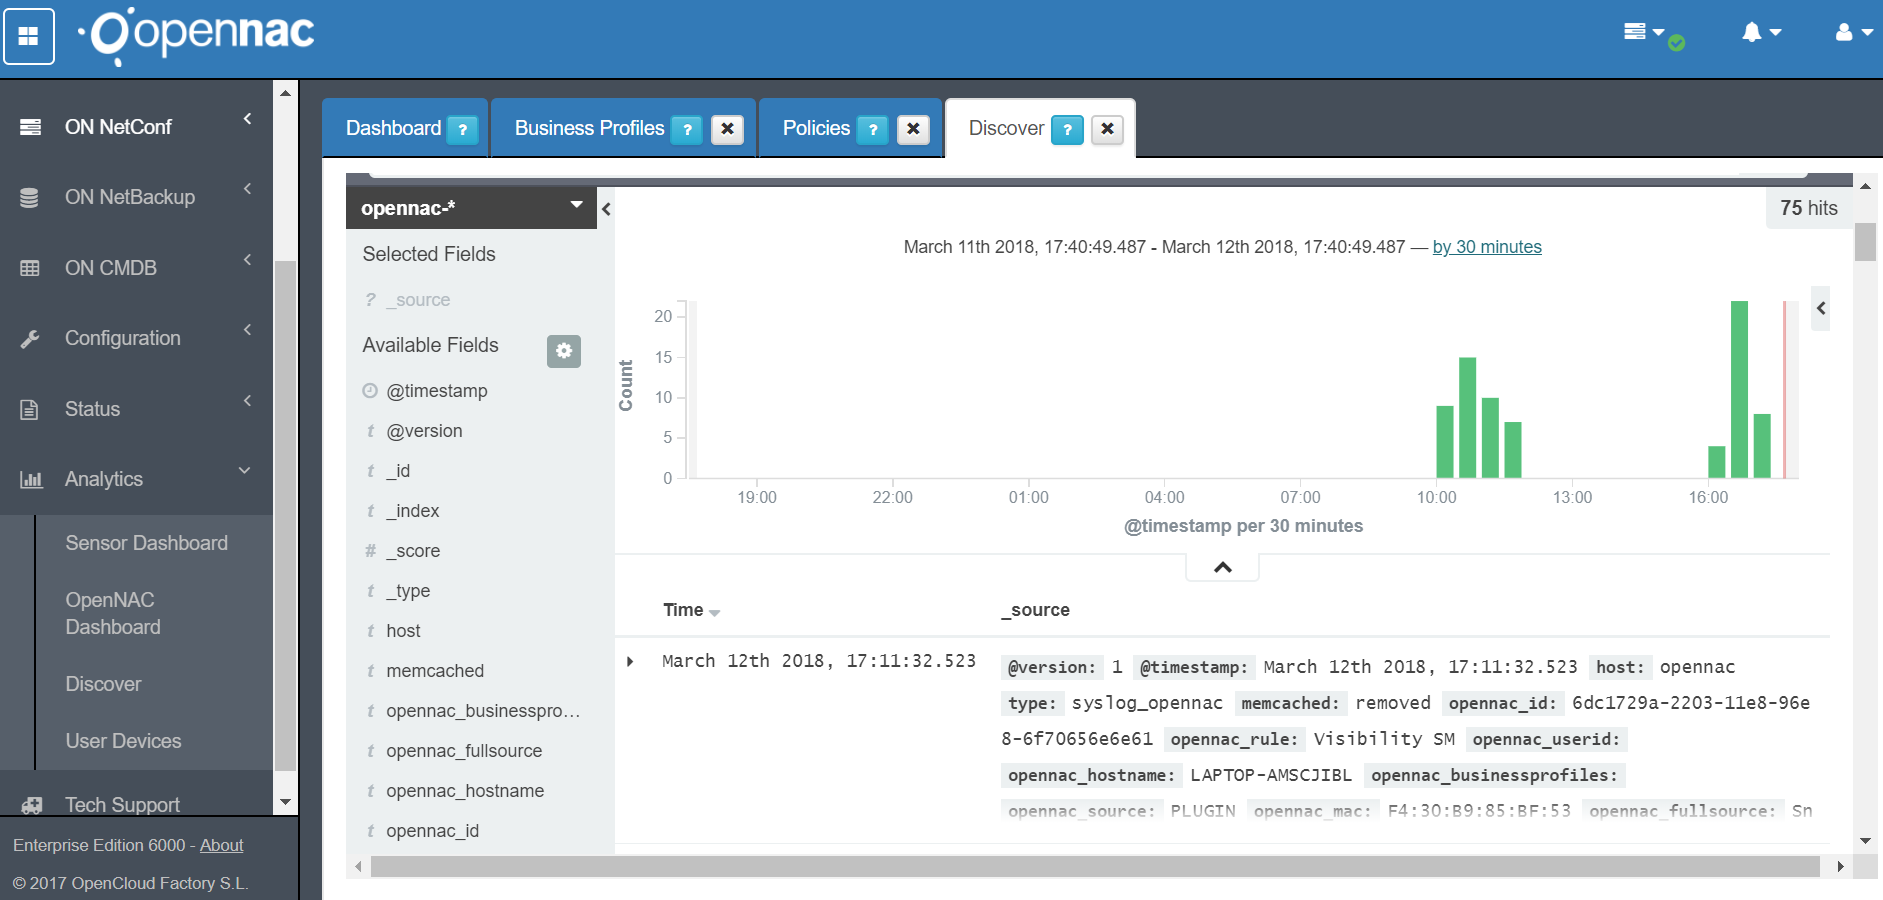
Analytics Logs
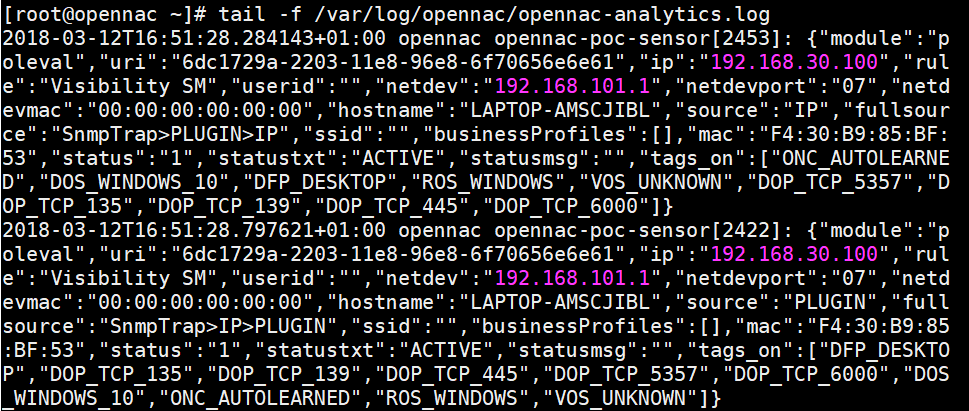
The log that contains the information printed in Analytics option is collected in file opennac-analytics.log, verify it from CLI on core and later using the web console.
tail -f /var/log/opennac/opennac-analytics.log