Checking healthcheck status through SNMP
The SNMP service has been configured so that the status of each of the services configured in the “healthcheck” can be consulted, both Cores, Analytics and Sensor. Today severals methods are available and we will describe two of them.
Here is a list of OIDs by node type:
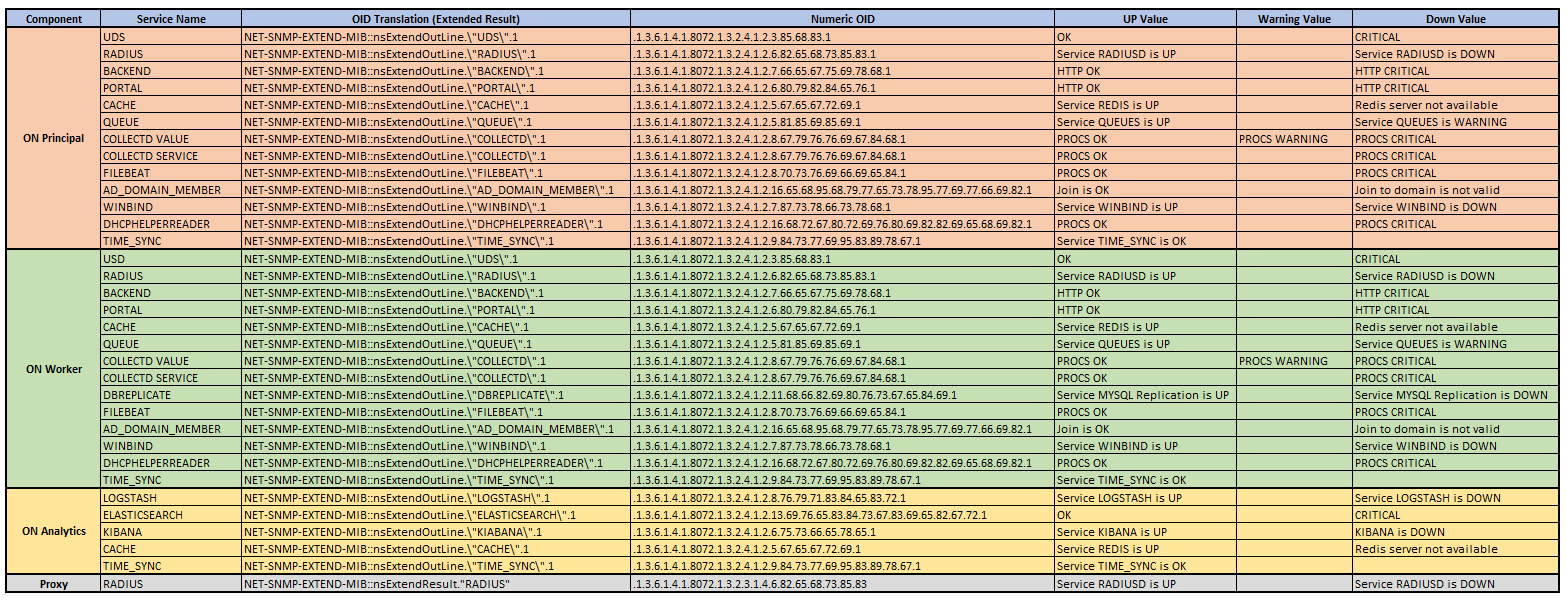
We can see the table in the “Reference Guide”: OpenNAC SNMP OIDs
- The first step is to allow snmp flow into iptables (/etc/sysconfig/iptables) and for all monitored nodes:
# SNMP enabled
-A INPUT -s <Source-ip> -p udp -m state --state NEW -m udp --dport 161 -j ACCEPT
The first method to check the status of a specific service, is using the following OIDs and must be accessed with the configured community (by default, “public”).
2.1 To get the status of the service, for example “BACKEND”:
snmpget -v2c -c public <ip_opennac> 'NET-SNMP-EXTEND-MIB::nsExtendResult."BACKEND"'2.2 To get the detail of the service, for example “BACKEND”:
snmpget -v2c -c public <ip_opennac> 'NET-SNMP-EXTEND-MIB::nsExtendOutLine."BACKEND".1'
The service names correspond to those configured in the “healthcheck”.
Note
It is strongly recommended to modify the snmp community editing /etc/snmp/snmpd.conf file.
You can get a list of services and the different options of each service with the following command “snmpwalk”:
snmpwalk -v2c -c public ip_opennac .1.3.6.1.4.1.8072.1.3.2
- A second method is using openNAC plugin (Only available on openNAC Enterprise 1.2.1):
We can find it on /usr/share/opennac/healthcheck/integration/monitor_client.sh This plugin is flexible and designed to be used for most monitoring software like Nagios or PRTG Monitor.
The next table shows us parameters we can use. Some of them are simply requiered:
Available options:
-H: host OPENNAC_SERVER             openNAC server to connect by SNMP to retrieve service status. (Default: localhost)
-s: service SERVICE_NAME            service name to check (ex: BACKEND, DBREPLICATION or UDS). Requiered
-o: output-style OUTPUT_STYLE       output format to send information. (PRTG, Nagios)
-c|--community COMMUNITY             community string to connect by SNMP (Default: public)
3.1 Configuring sensors on PRTG Monitor:
- The first step is to copy the plugin on /var/prtg/scripts.
mkdir -p /var/prtg/scripts
cp -p /usr/share/opennac/healthcheck/integration/monitor_client.sh /var/prtg/scripts/
- Befor adding a new sensor, we need to create a new group of devices and next a new device. As an example our new group and device will be openNAC and Core 1.2.1.
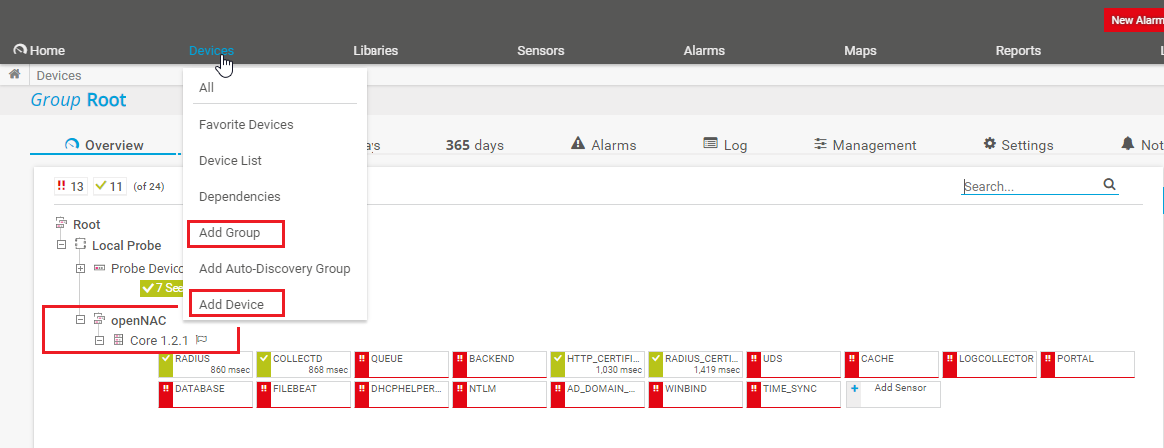
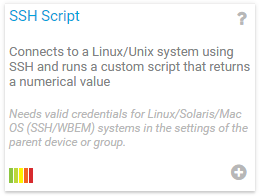
- Next step is to add new sensor. To do it, right click on your device and add sensor. Search for SSH Script.
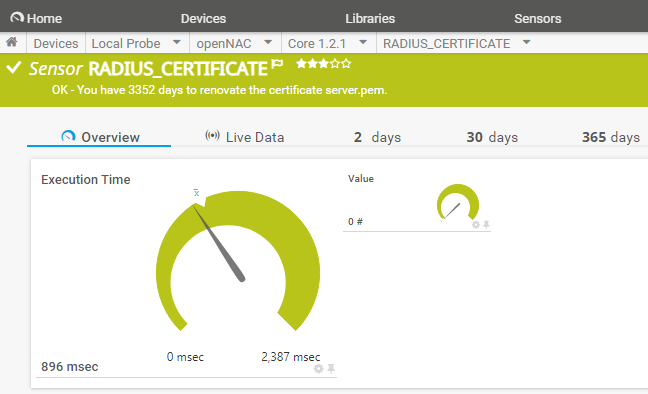
- Configure sensor information. It’s requered to add at less name’s sensor and Parameters.
- Sensor name = RADIUS_CERTIFICATE
- Script = monitor_client.sh (Don’t forget, PRTG will search it at /var/prtg/script on the node)
- Parameters = -H localhost -s RADIUS_CERTIFICATE -o PRTG
- After executing sensor scanning, it will shows us the status of the service.
Note
To create the others sensors it’s possible to clone one and modifying internal information.