Dashboard Customization
One of most important advantage of openNAC over other similar NAC solutions in the ability to customize e product according with interest of openNAC users.
By default openNAC has several created dashboards into Analytics menu, but sometimes openNAC users want to visualize other network/assets information in a graphic way, for this purpose created a new dashboard with the information are you interest in.
To create a new dashboard:
- Define the data you want to show and perform the data search.
- Define the visualization to create the graphic.
- Create dashboard and link the visualization created before to this dashboard.
Step 1. Access to Kibana Server
Use the Kibaba IP address to access the server via SSH, to verify the Kibana IP address go to Configuration –> Configuration vars tab Generic.
Method 1
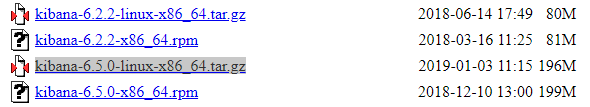
Download from openNAC repository the latest kibana package un tar.gz extension
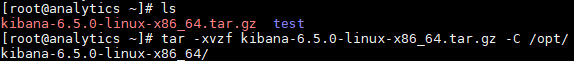
Decompress the package in the analytics server, in the path /opt/
tar -xvzf kibana-6.5.0-linux-x86_64.tar.gz -C /opt/
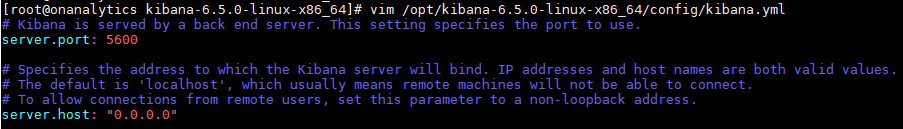
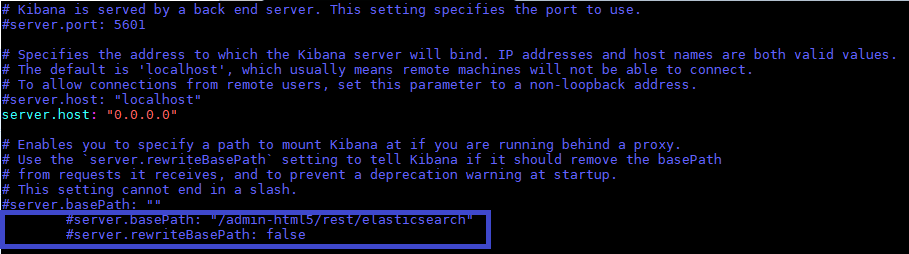
Edit kibana.yml in the /opt/kibana-6.5.0-linux-x86_64/config/ path, and assing the port 5600 with ip 0.0.0.0
vim /opt/kibana-6.5.0-linux-x86_64/config/kibana.yml
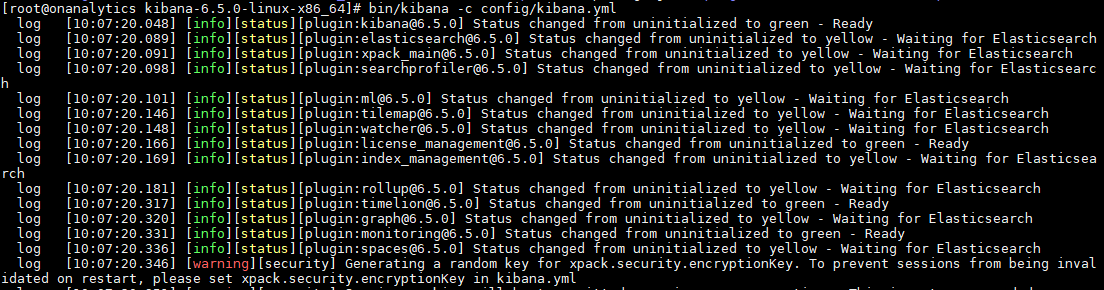
Run a new Kibana instance in the follow way
cd /opt/kibana-6.5.0-linux-x86_64/
bin/kibana -c config/kibana.yml
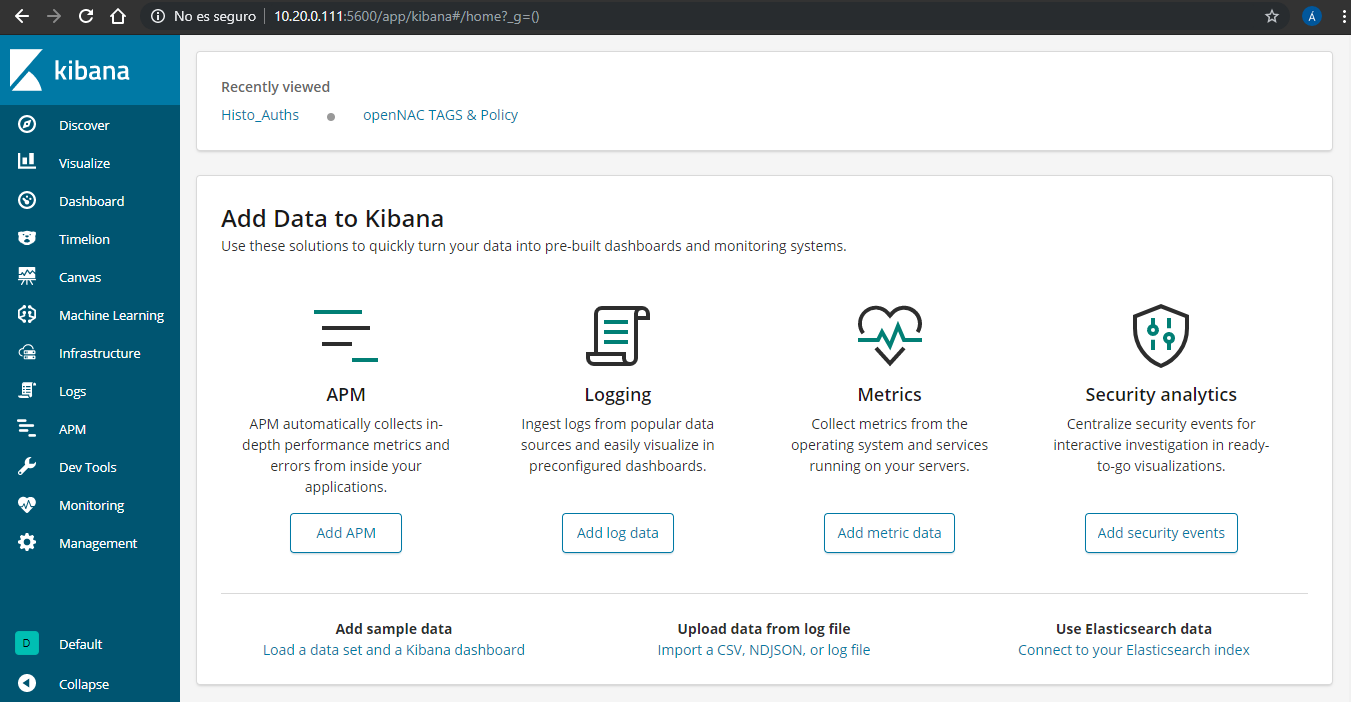
From web browser access to Analytics IP address by port 5600. <ANALYTICS-IP:5600>.
Method 2
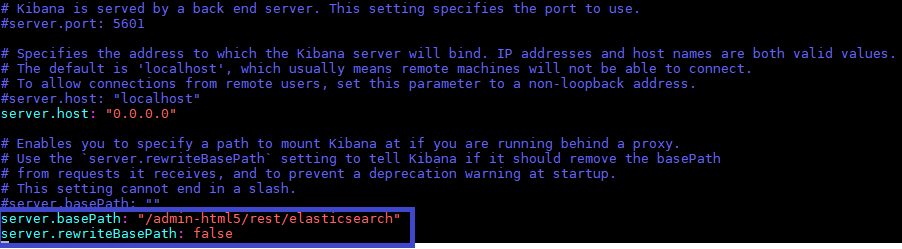
Edit the file kibana.yml in the path /etc/kibana/ comment the lines:
server.basePath: “/admin-html5/rest/elasticsearch”; server.rewriteBasePath: false
vim /etc/kibana/kibana.yml

#server.basePath: "/admin-html5/rest/elasticsearch"
#server.rewriteBasePath: false
Restart Kibana service:
systemctl restart kibana
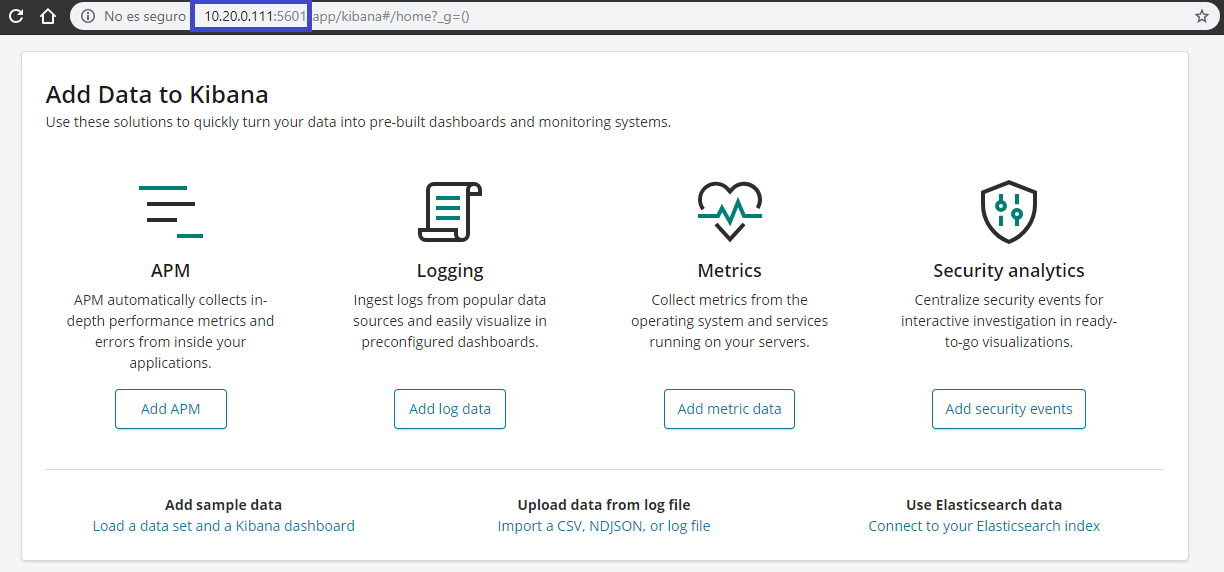
From web browser access to Analytics IP address by port 5601. <ANALYTICS-IP:5601>.
Step 2. Select Graphic
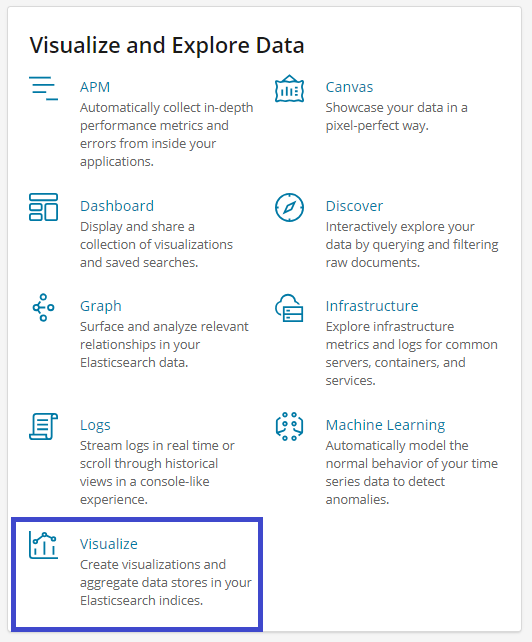
Once in Kibana portal go to Visualize and Explore Data click on Visualize.
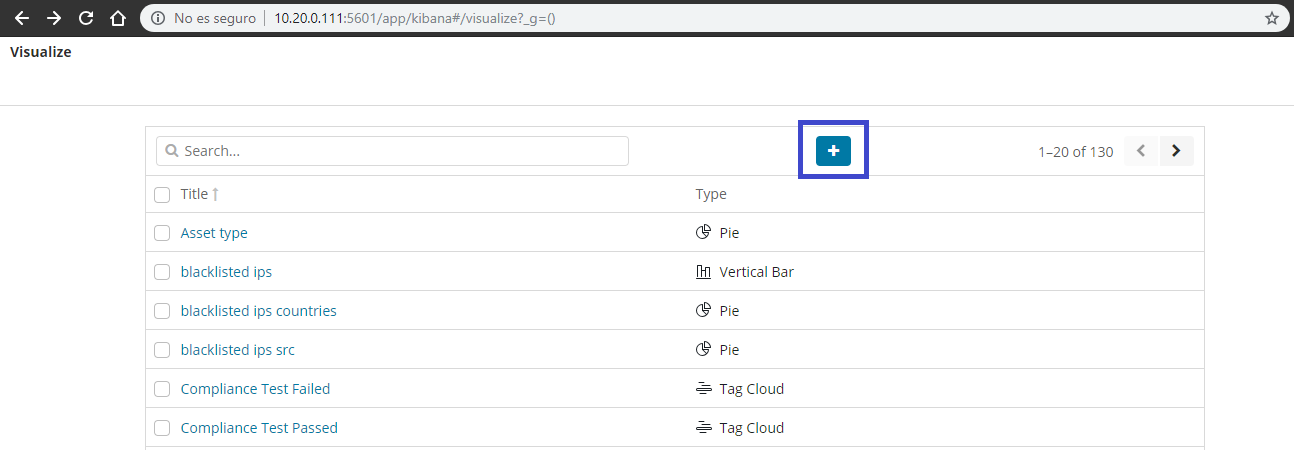
Some of the created visualizations are listed here, for this case we are creating a new one so, Click on + icon.
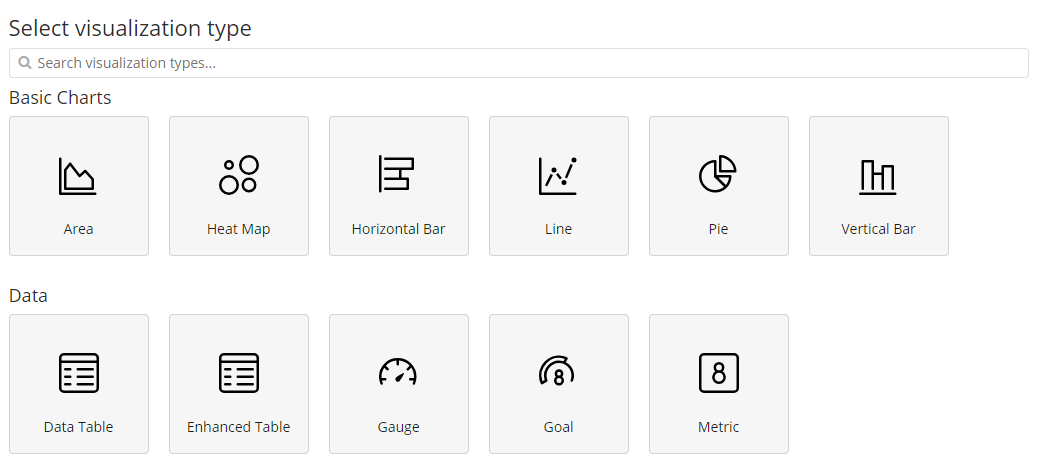
A menu with graphics options will be show, select which you want to generate, for this case we are using Pie.
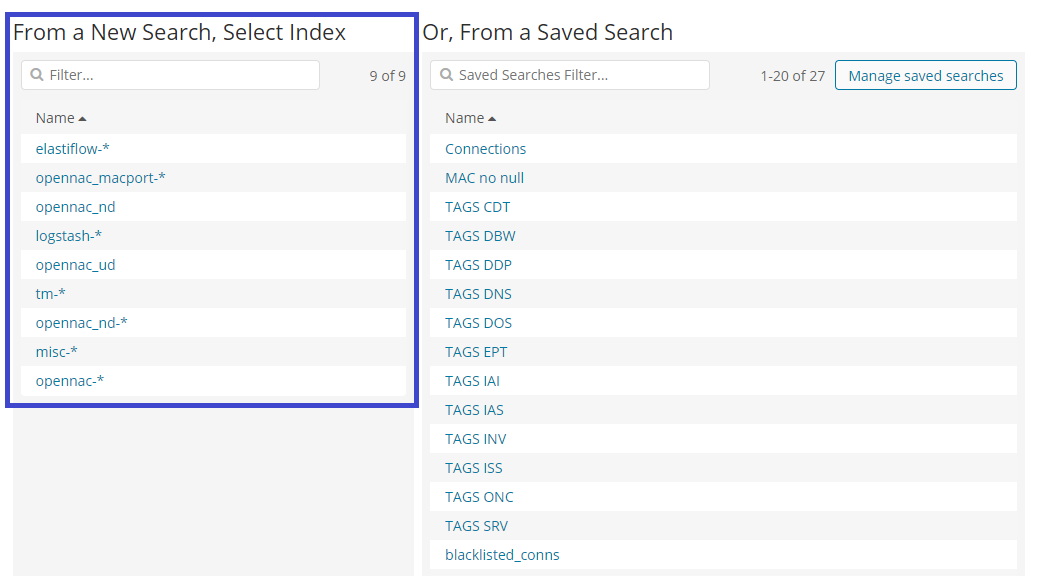
Step 3. Select Data
From the left side select the Index to use as source of data, in this case we are using opennac_ud.
- Count in aggregation metrics are used for this case. This option allows to counts the number of appearances of selected field in the selected index.
- In buckets the main parameter to define is the Field, is the selected data you want show, in this example opennac_source_keyword is selected.
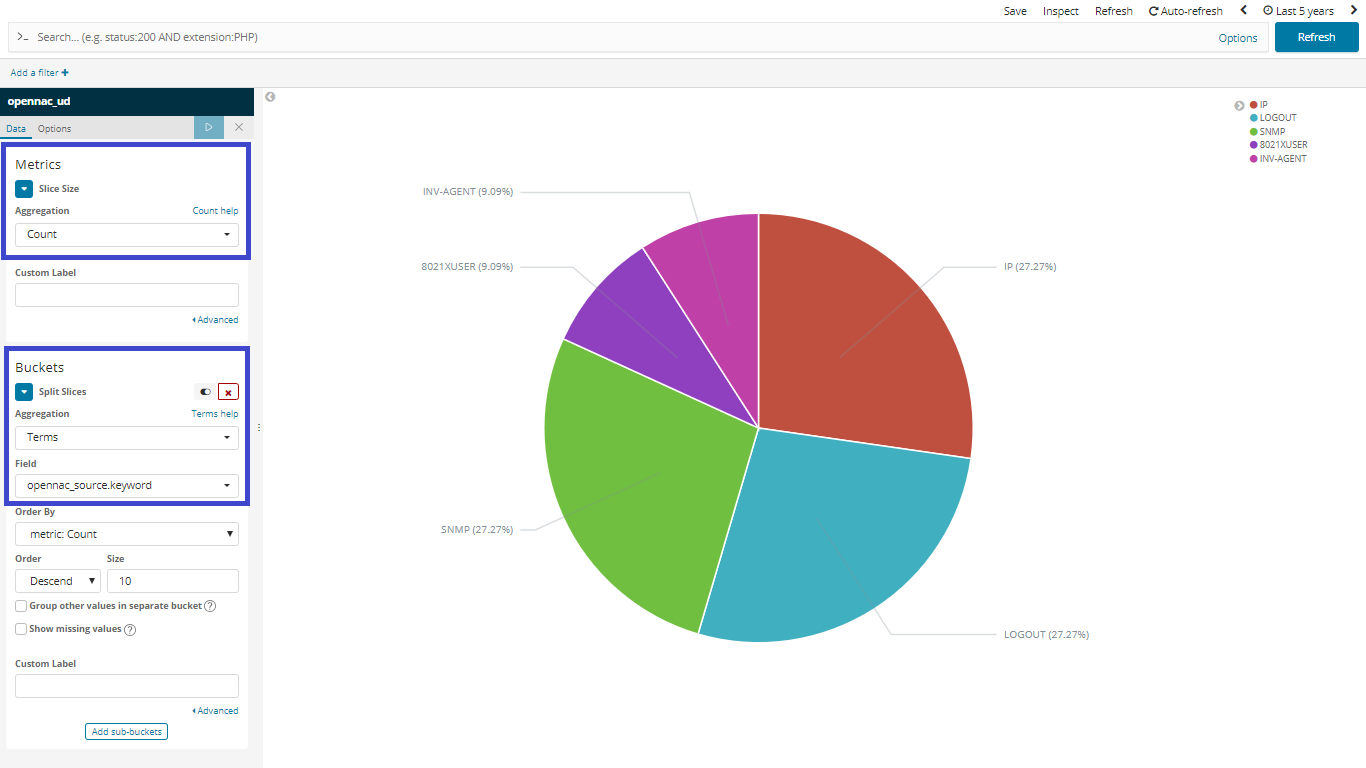
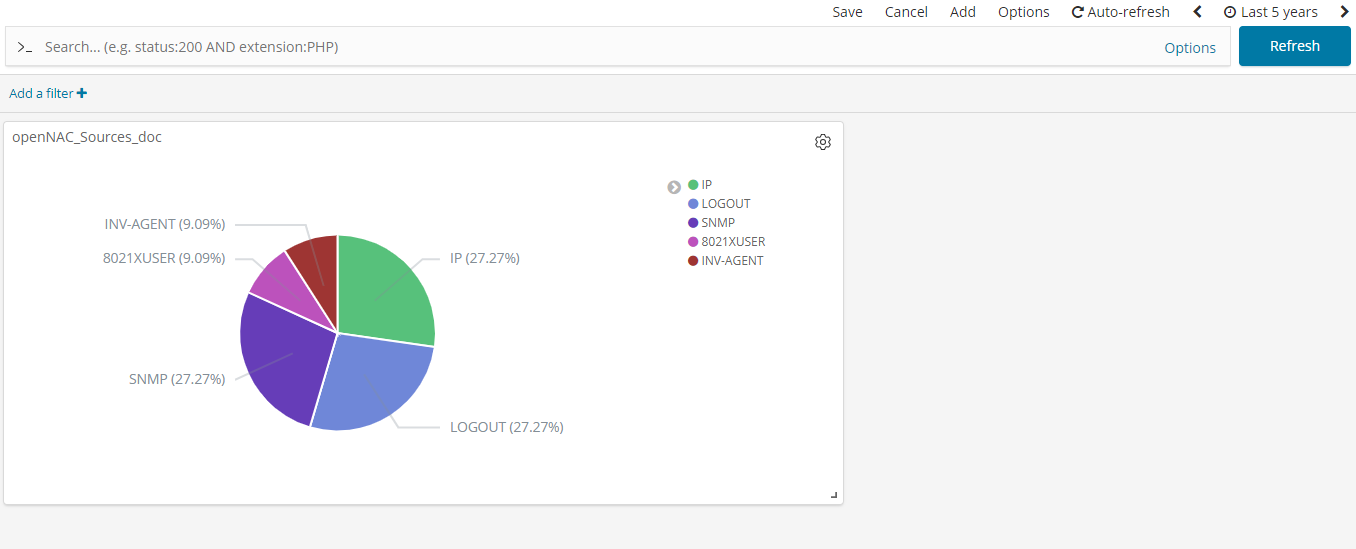
So a pie graphic with the count of openNAC authentication sources is shown.
Step 4. Create Dashboard
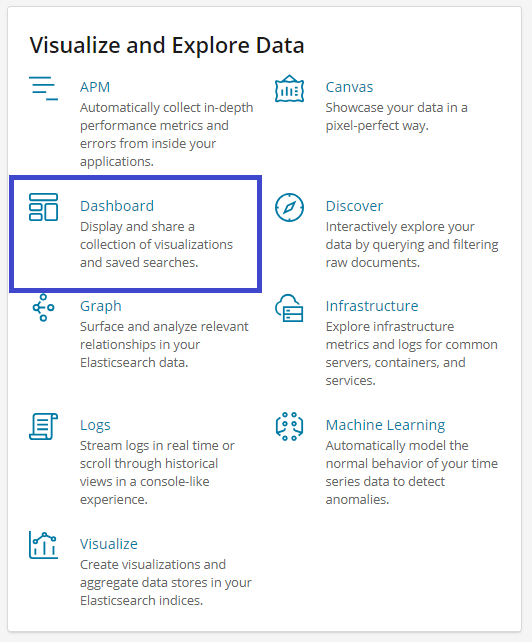
The next step is to create a dashboard and assing the visualization to it. Into main menu select the option Dashboard,
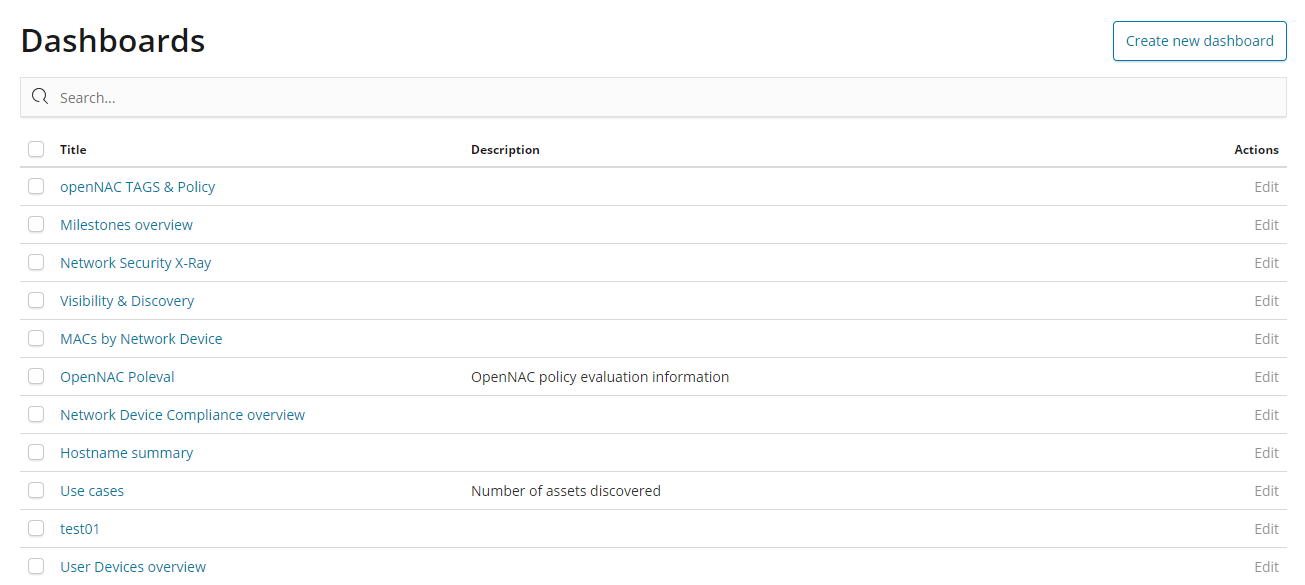
Select the option Create new dashboard, this dashboard is going to be empty, so now add the visualization already created.
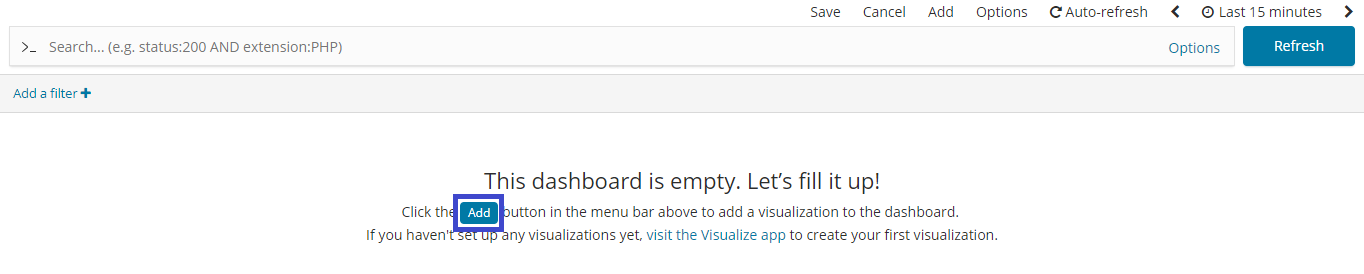
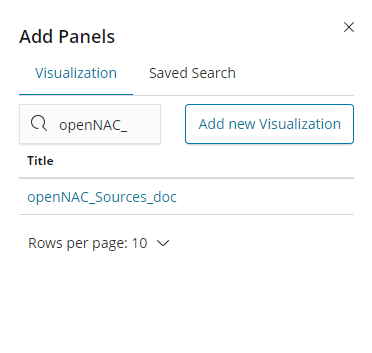
Click on add bottom to add the visualization.
Find the visualization filter by name given.
A dashboard preview will be show.
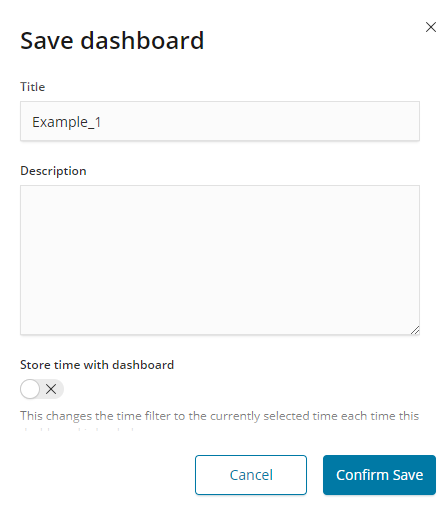
Save the dashboard.
Look at the browser bar, there is a number between / ?. This number number is the dashboard ID, copy in clipboard, in this case 2c38f230-4bc9-11e9-964b-47a388912602.

Use the Kibaba IP address to access the server via SSH. Edit the file kibana.yml in the path /etc/kibana/ dis-comment the lines:
#server.basePath: “/admin-html5/rest/elasticsearch”; #server.rewriteBasePath: false
vim /etc/kibana/kibana.yml

server.basePath: "/admin-html5/rest/elasticsearch"
server.rewriteBasePath: false
Restart Kibana service:
systemctl restart kibana
Step 5. Adding Dashboard to Web Console
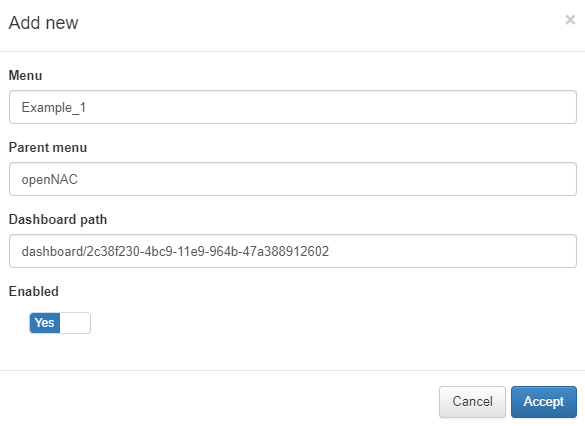
Open web console, go to Configuration –> Dashboards, in Dashboard list tab click on + Add new.
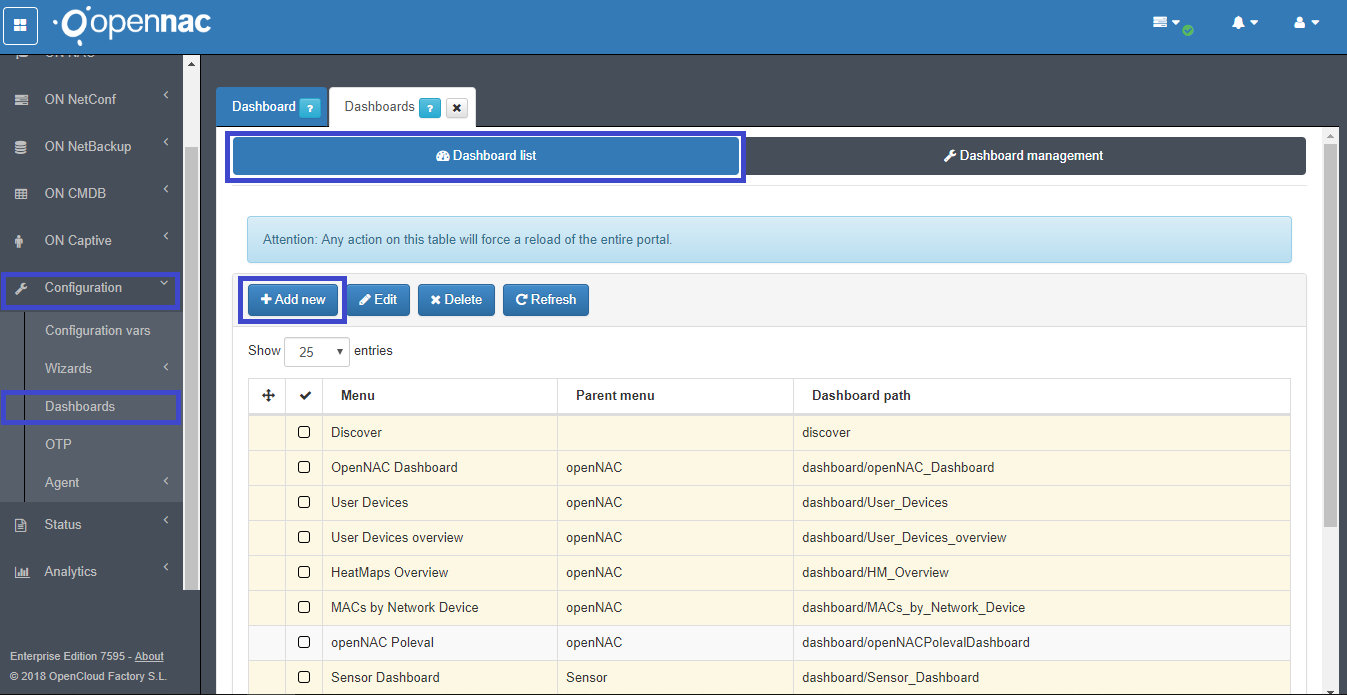
Menu: Name of new dashboard on openNAC web console.
Parent menu: Menu where the dashboard is going to be inserted
Dashboard path: Dashboard ID, paste it from the clipboard.
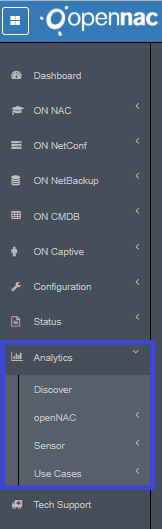
To verify, go to Analytics –> openNAC –> Name of Dashboard (Menu) click on it, and the created dashboard would be shown as follows.
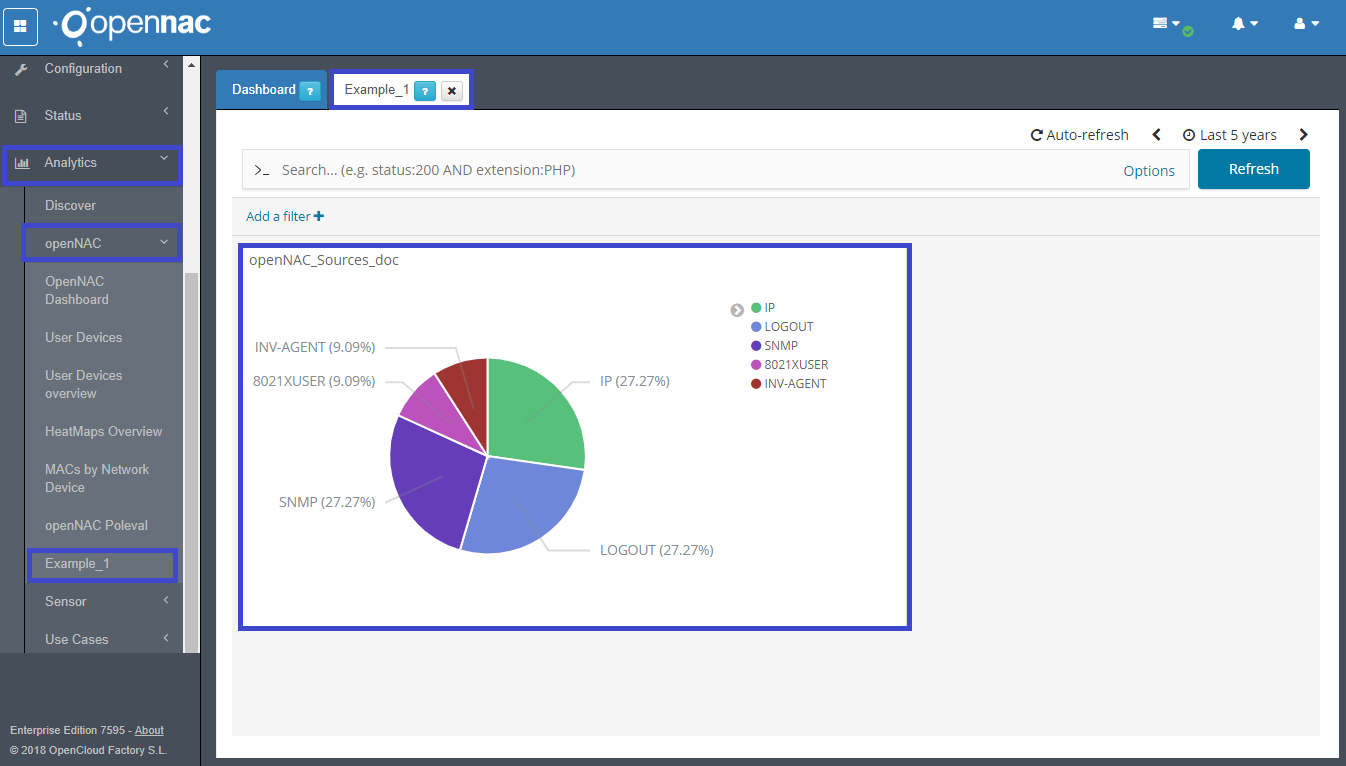
OpenNAC users can add more than one visualization into a single dashboard.