4.6.7. Monitoring
With all the information related to the Guest module that the system collects, it generates dashboards so that this information can be read and interpreted quickly and easily by the user. As a large volume of data of different types and sources is generated, different dashboards have been defined that group this information through graphs and tables.
All Dashboards have filters that allow us to define what parameters to show and what time period of the data will be used to generate said dashboards. Keep in mind that, if in the indicated period of time there has been no update on a specific device, through an event, this device will not appear.
4.6.7.1. Guest/BYOD Mngt Overview
This dashboard displays global visualizations of Guest and BYOD events.
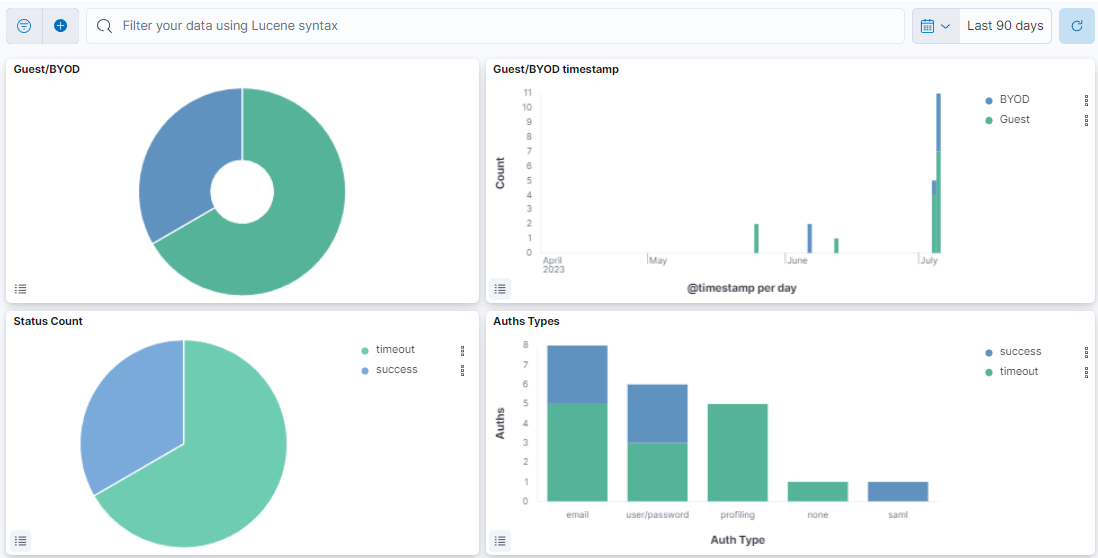
Guest/BYOD: Represents the percentage of Guest and BYOD events.
Guest/BYOD timestamp: Shows the Captive events, separated by Guest and BYOD types on a timeline.
Status Count: Represents the percentage of the events status.
Auths Types: Shows the different authentication types with the count of events for each separated by the event status.
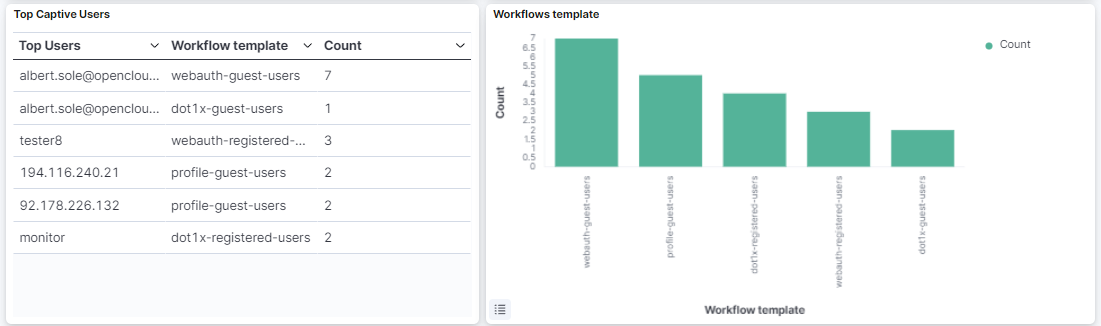
Top Captive Users: Graphic representation of top captive users.
Workflows template: Workflows template.
4.6.7.2. Guest/BYOD Mngt Metrics
The Guest/BYOD Metrics dashboard displays all the ON Captive events, divided into Guest and BYOD use cases:
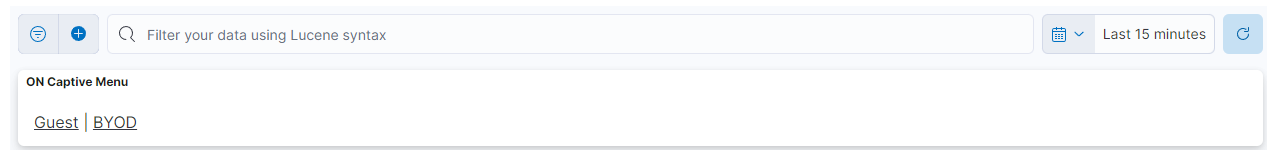
Menu
The ON Captive Menu features two different windows: Guest and BYOD. Each window offers distinct dashboard views, allowing you to navigate between these sections. The following topics will explore these menu options in detail.
4.6.7.2.1. Guest
This window displays Guest status, workflows and timestamps.
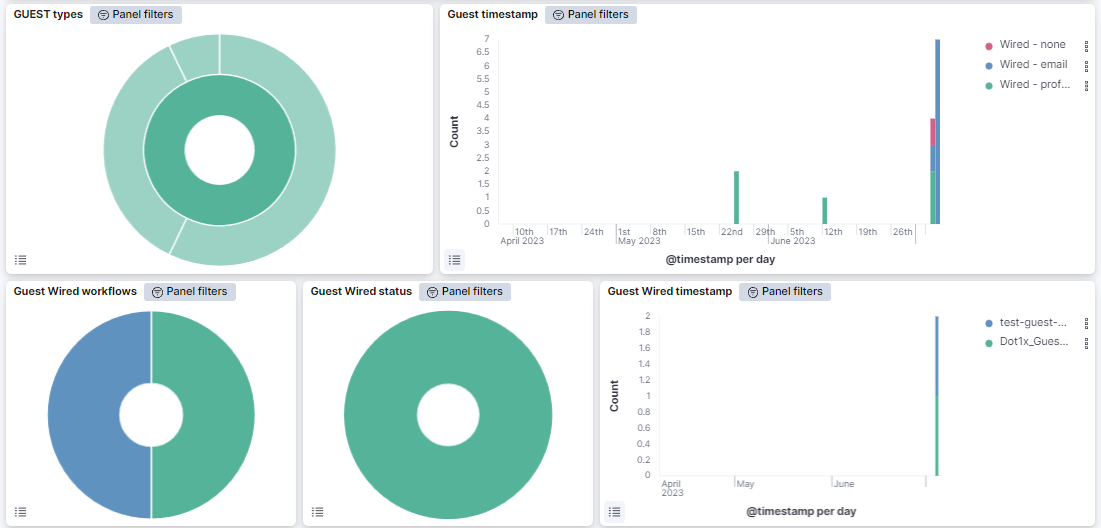
Guest types: In the internal pie we can see the percentage of Guest event types, that can be wired and Wi-Fi, and in the external pie we can see the authentication type used, which can be user and password or SAML.
Guest timestamp: Shows the Guest events, separated by Guest type and authentication type on a timeline.
Guest Wired workflows: Displays the workflows of guest wired connections.
Guest Wired status: Provides information on the current status of the guest wired connection.
Guest Wired timestamp: Represents the timestamp at which a specific event related to the guest wired connection occurred.
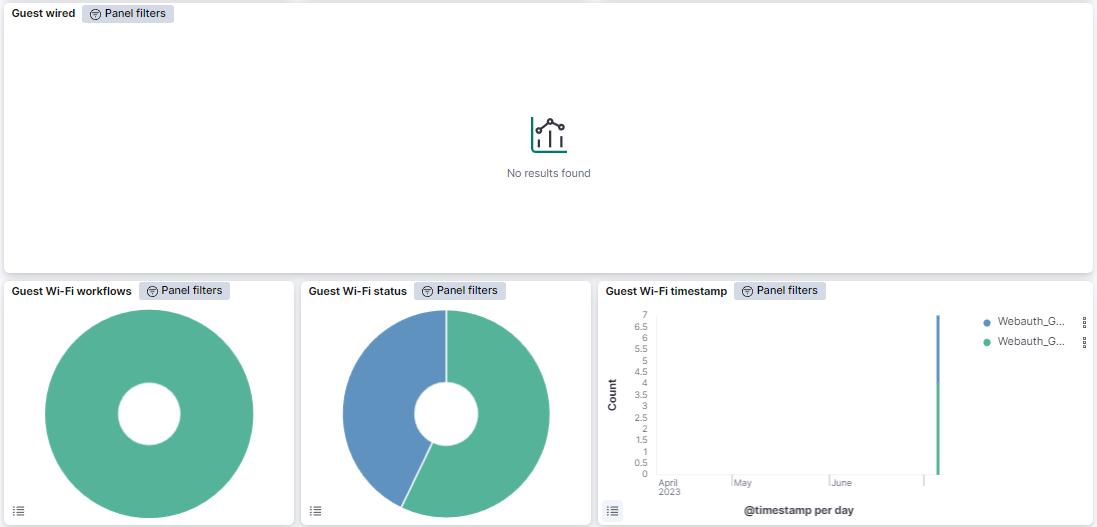
Guest wired: The table presents Guest wired events, featuring the user ID, authentication method, server IP, workflow name, redirection page for the device, and the event’s repetition count.
Guest Wi-Fi workflows: Displays the workflows of guest Wi-Fi connections.
Guest Wi-Fi status: Provides information on the current status of the guest Wi-Fi connection.
Guest Wi-Fi timestamp: Represents the timestamp at which a specific event related to the guest Wi-Fi connection occurred.
Guest Wi-Fi: The table displays Guest Wi-Fi events, including the user ID, authentication method, server IP, workflow name, access point MAC, client MAC, WLAN, redirection page for the device, and the event’s repetition count.
You can also navigate to Administration Portal > Analytics > Guest/BYOD to find information about the dashboards available for this use case.