VPN
The VPN dashboard displays VPN connections and their features. We can see the following views on this dashboard:
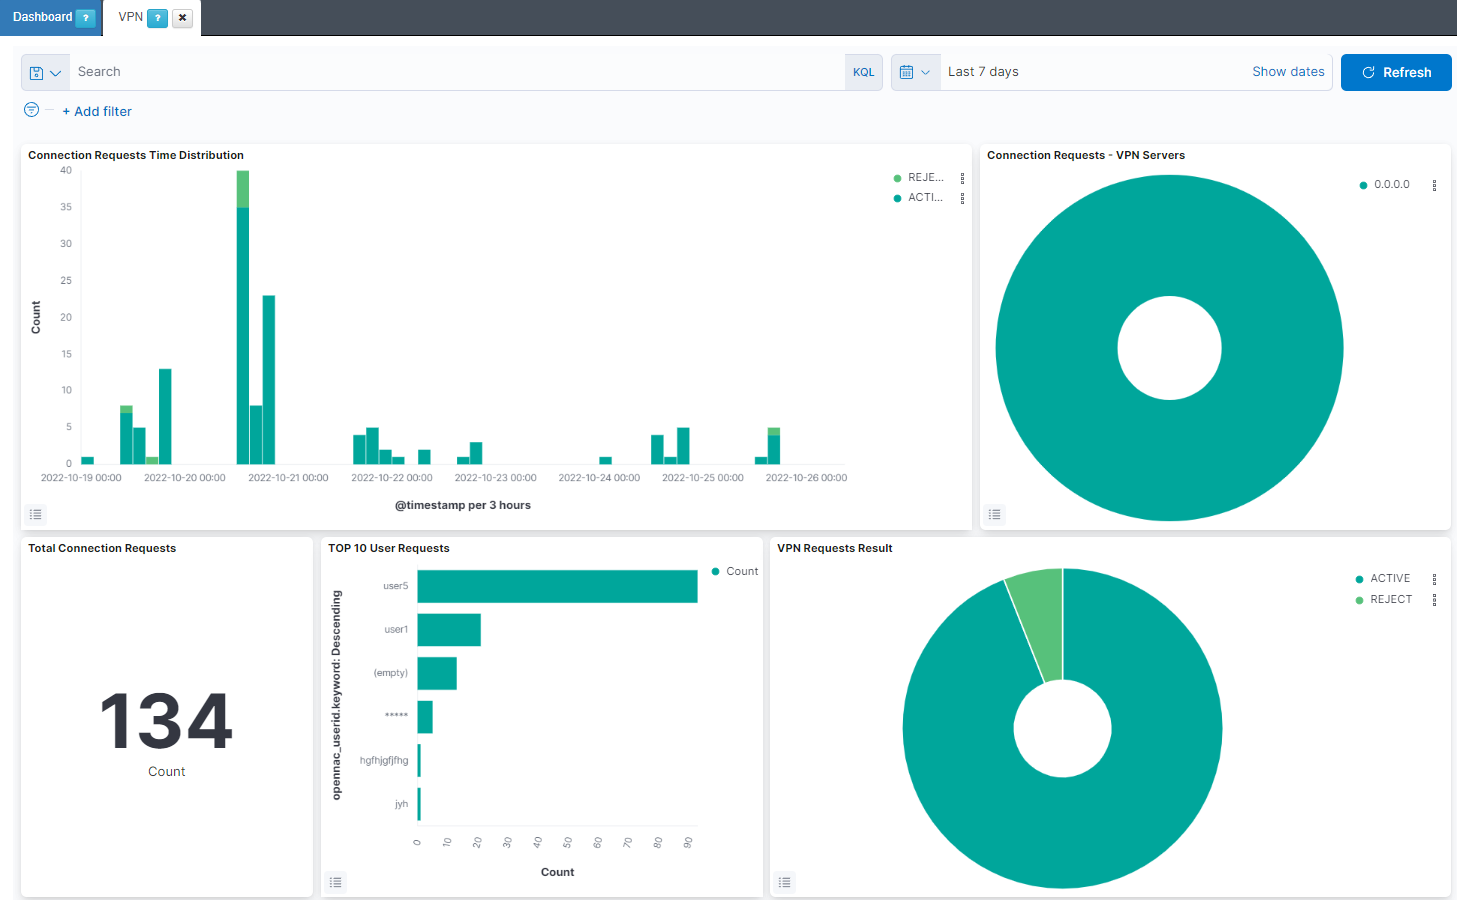
Connection Requests Time Distribution: Shows the total of VPN events separated by active and rejected on a timeline.
Connection Requests - VPN Servers: Represents the percentage of network devices VPN events.
Total Connection Requests: Shows the number of total VPN connection requests.
TOP 10 User Requests: Shows the top 10 users that generates the VPN requests, with the number of requests for user.
VPN Requests Result: Represents the percentage of network devices VPN events results.
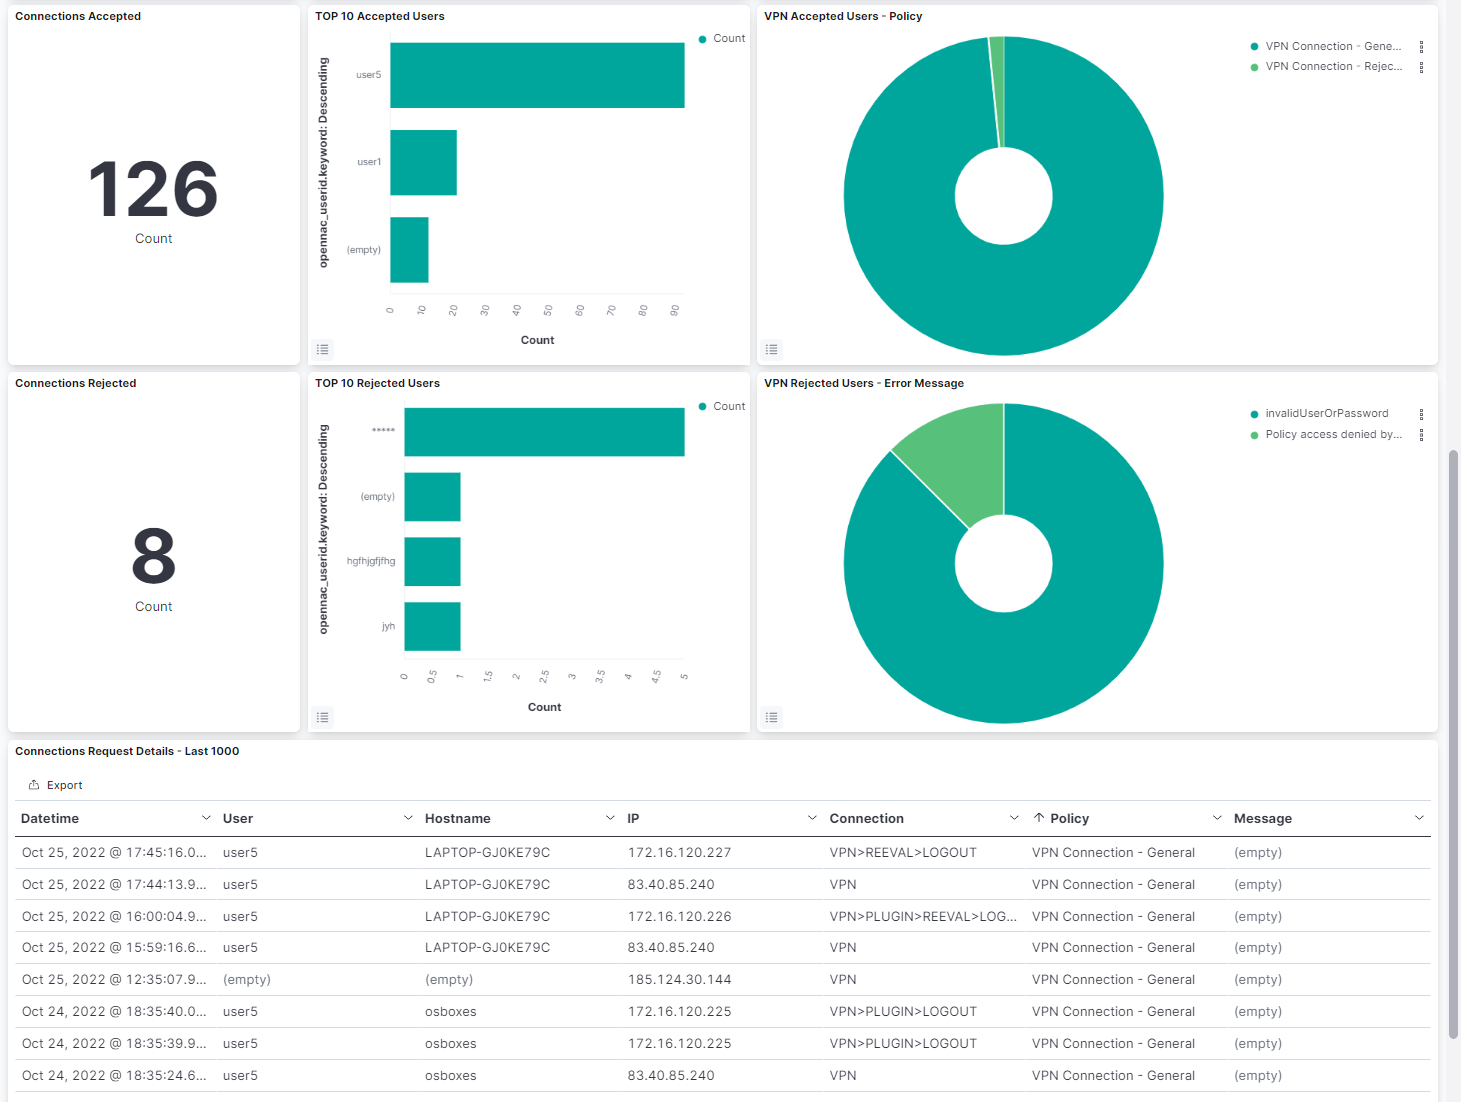
Connections Accepted: Shows the number of total VPN connections accepted.
TOP 10 Accepted Users: Shows the top 10 users that generates the VPN requests, with the number of accepted requests for user.
VPN Accepted Users - Policy: Represents the percentage of VPN policy rules for the accepted requests.
Connections Rejected: Shows the number of total VPN connections rejected.
TOP 10 Rejected Users: Shows the top 10 users that generates the VPN requests, with the number of rejected requests for user.
VPN Rejected Users - Error Message: Represents the percentage of error messages for the rejected requests.
Connections Request Details - Last 1000: Shows a table with the last 1000 VPN connection requests details. In this table timestamp is represented, as well as the user, the hostname, the IP, the connection type, the policy rule and the message.