4.1.7. Monitoring
With all the information collected about the Visibility module, the Analytics component generates dashboards providing users with quick and comprehensive insights.
The dashboards utilize graphs and tables to organize the diverse and substantial volume of data collected from various sources. Users can apply filters and time periods to customize the displayed parameters. Please note that devices without recent updates won’t be included in the displayed events.
For access to these dashboards, navigate to Administration Portal > Analytics > Visibility.
4.1.7.1. Visibility Overview
The “Visibility Overview” dashboard provides an overview of all the user devices connected to the network. It categorizes them based on their endpoint type and displays the characteristics associated with them.
We can see the following views on this dashboard, starting from the header:
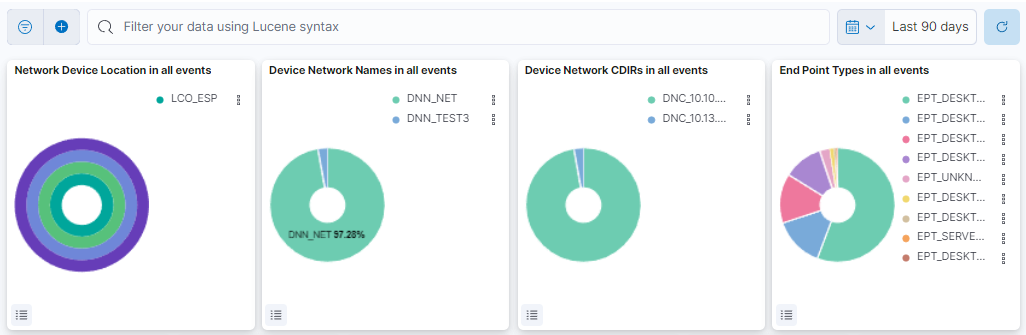
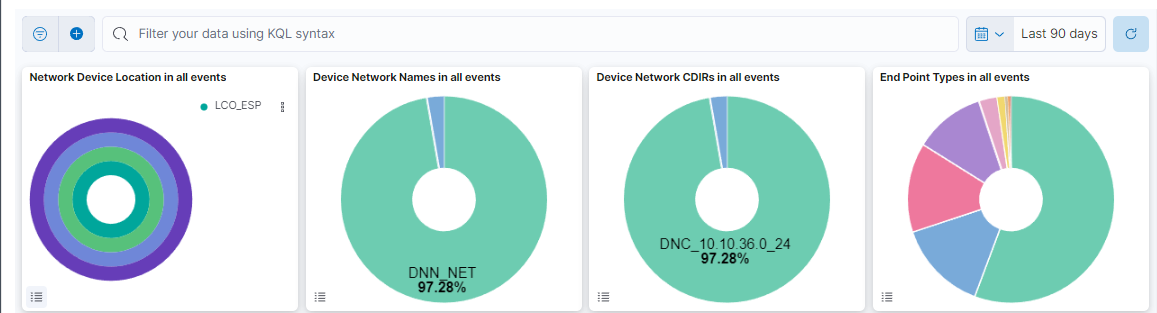
This header composed of four dashboards allows filtering by Network Device Location, Device Network Name, Device Network CDIRs, Endpoint Types. It will always look for the temporary index that is regenerated every day. In this toolbar, filter your data using Lucene syntax.
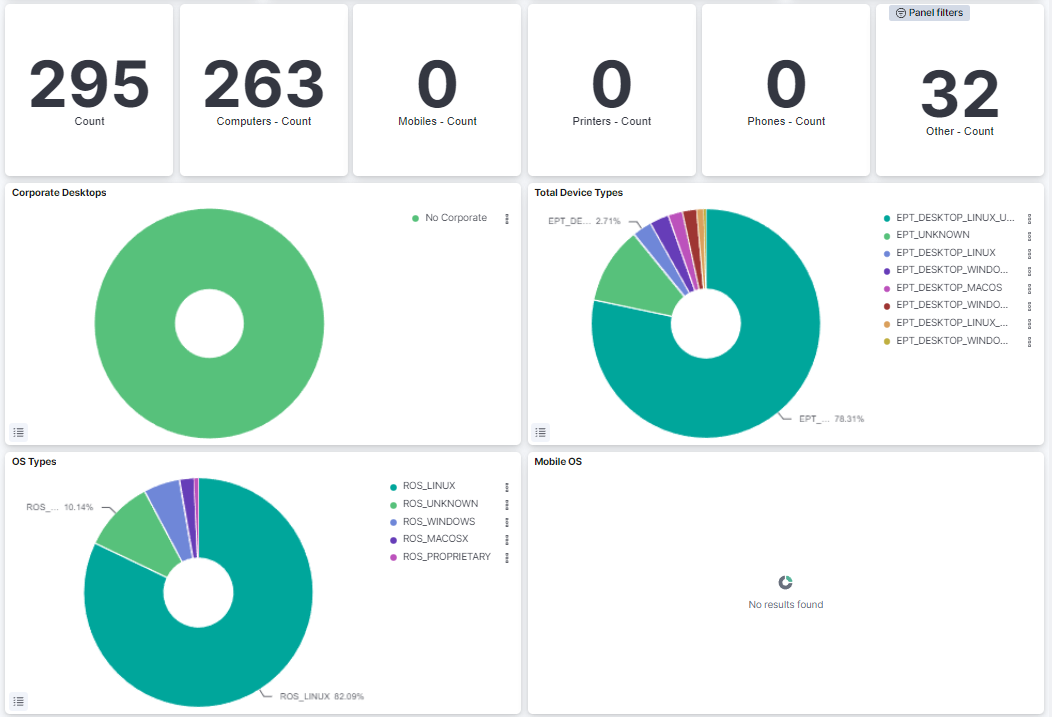
Total Devices: Shows the number of total devices in the network.
Computers: Shows the number of total computers in the network.
Mobiles: Shows the number of total mobiles in the network.
Printers: Shows the number of total printers in the network.
Phones: Shows the number of total phones in the network.
Other: Shows the number of the other devices in the network.
Corporate Desktops: Represents the percentage of corporate devices and no corporate devices.
Total Device Types: Represents the percentage of EPT (Endpoint Type) tags.
OS Types: Represents the percentage of the operating systems from all the devices in the network.
Mobile OS: Represents the percentage of the operating systems from the mobiles in the network.
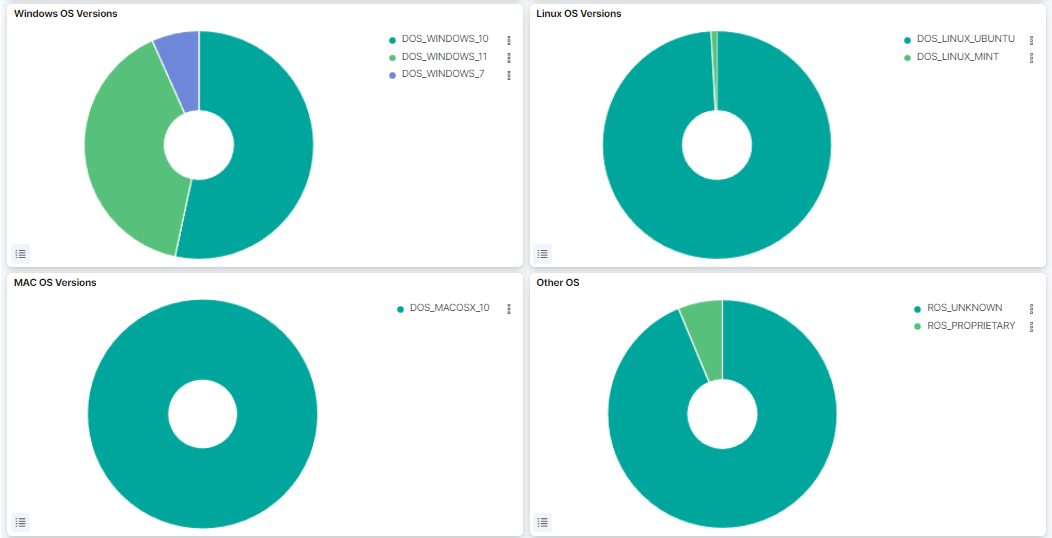
Windows OS Versions: Represents the percentage of the Windows versions found in the network.
Linux OS Versions: Represents the percentage of the Linux versions found in the network.
MAC OS Versions: Represents the percentage of the MAC OS versions found in the network.
Other OS: Represents the percentage of the other operating systems found in the network.
4.1.7.2. Mobile Visibility
The Visibility Mobile dashboard showcases the relationship between the Endpoint (EPT) and HTTP agents parsed on mobile devices. This relationship enables the creation of profiling rules using this protocol, which helps identify the specific model of the mobile device (smartphone, tablet, etc.).
We can see the following views on this dashboard, starting from the header:
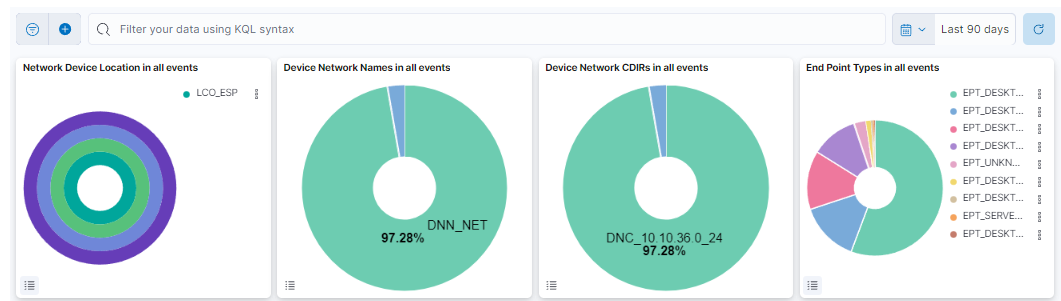
This header composed of four dashboards allows filtering by Network Device Location, Device Network Name, Device Network CDIRs, Endpoint Types. It will always look for the temporary index that is regenerated every day. In this toolbar, filter your data using KQL syntax.
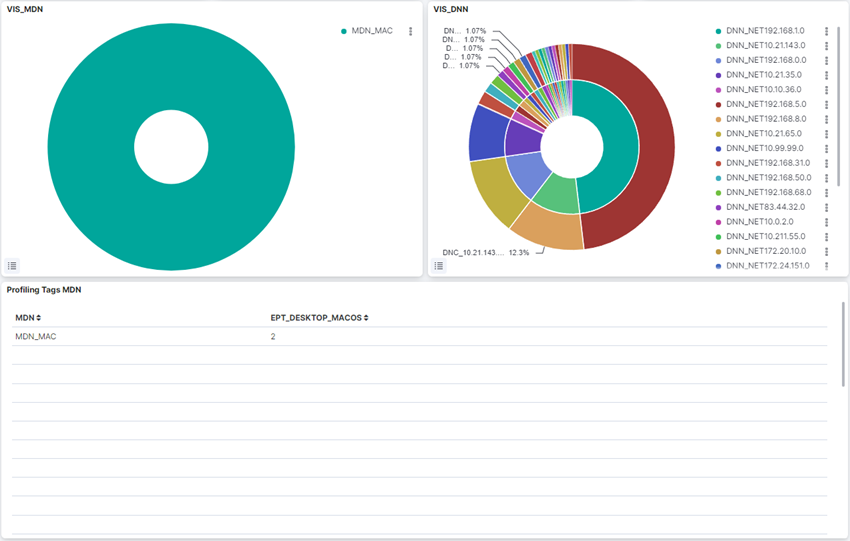
VIS_MDN: A pie chart that shows the MDN (Mobile Device Name) TAGs percentage. These TAGs are added by the execution of the UserDeviceProfiling plugin.
VIS_DNN: A pie chart that shows each subnet information with the DNN and DNC tags.
Profiling Tags MDN: A table that shows the EPT by MDN.
4.1.7.3. CMDB Metrics
The CMDB metrics dashboard display various metrics and insights related to Network Devices and Enpoint Devices and their tags.
We can see the following views on this dashboard, starting from the header:
This header composed of four dashboards allows filtering by Network Device Location, Device Network Name, Device Network CDIRs, Endpoint Types. It will always look for the temporary index that is regenerated every day. In this toolbar, filter your data using KQL syntax.
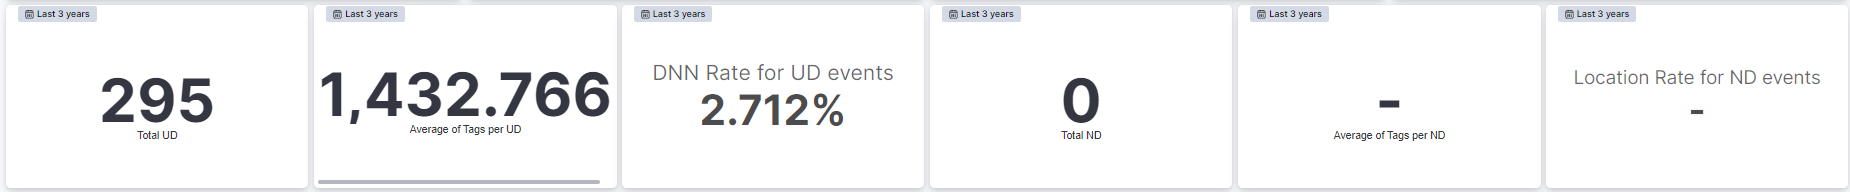
Total UD: Displays the count of total User Devices.
Average of Tags per UD: Displays the average count of tags per User Device.
DNN Rate for UD events: Displays the rate of predicting events related to User Devices.
Total ND: Displays the count of total Network Devices.
Average of Tags per ND: Displays the average count of tags per Network Device.
Location rate for ND events: Displays the rate of predicting events related to Network Devices.
Note
By default, these modules display data by the last 3 years time range.
To change the time range, click on the time displayed and a configuration window will pop-up.
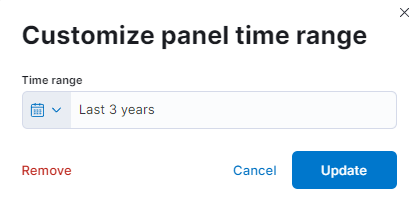
Choose the time range that better suit your needs and click on Update to save your preferences.
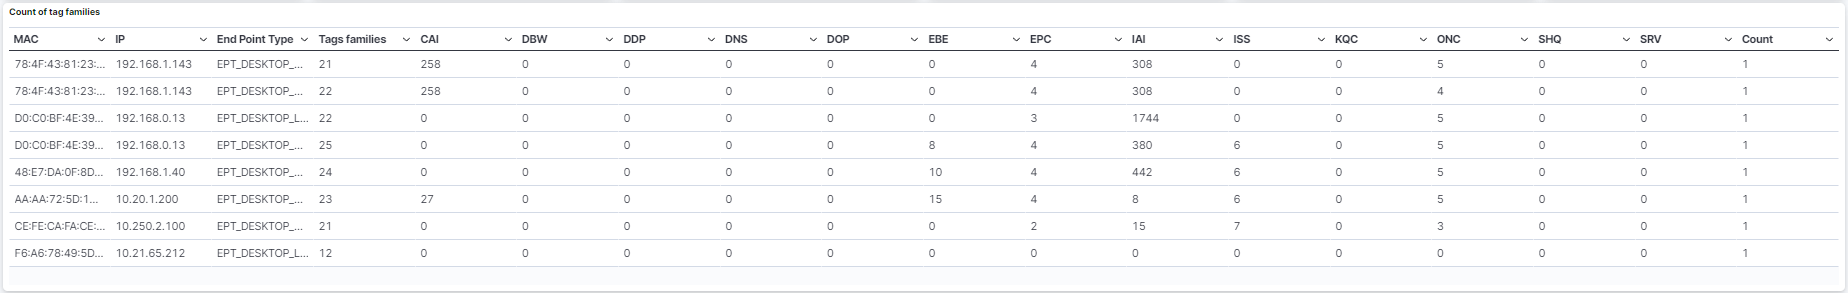
Count of tag families: Table that features the tags associated to a specific device and its count of tag families. See the Tags Table section for detailed information about the tags displayed in this view.
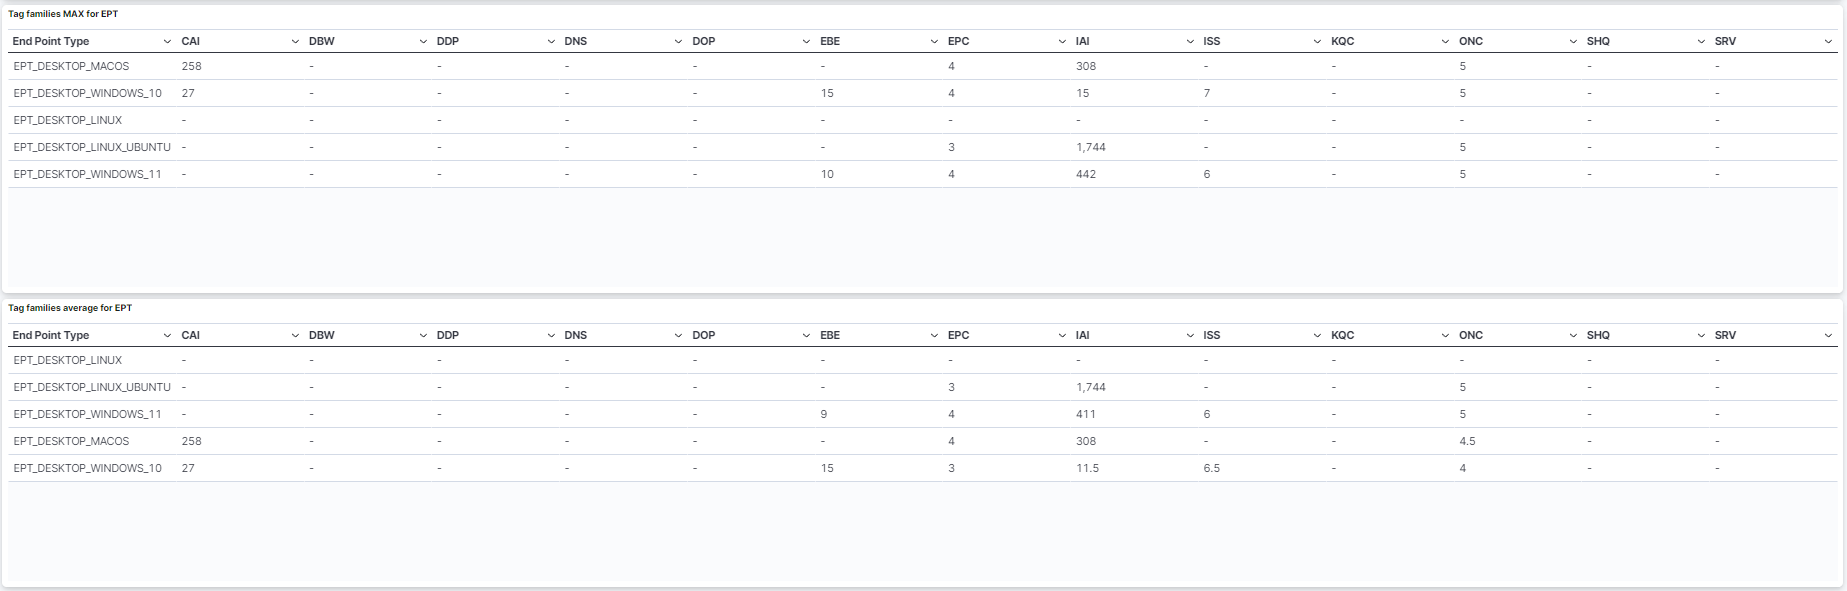
Tag families MAX for EPT: Table that features the MAX tag families associated to an Endpoint Type.
Tag families average for EPT: Table that features the average tag families associated to an Endpoint Type.
4.1.7.4. Network Behaviour
The CMDB metrics dashboard display various metrics and insights related to Network Devices and Enpoint Devices and their tags.
We can see the following views on this dashboard, starting from the header:
This header composed of four dashboards allows filtering by Network Device Location, Device Network Name, Device Network CDIRs, Endpoint Types. It will always look for the temporary index that is regenerated every day. In this toolbar, filter your data using KQL syntax.
Total UD: Displays the count of total User Devices.
Average of Tags per UD: Displays the average count of tags per User Device.
DNN Rate for UD events: Displays the rate of predicting events related to User Devices.
Total ND: Displays the count of total Network Devices.
Average of Tags per ND: Displays the average count of tags per Network Device.
Location rate for ND events: Displays the rate of predicting events related to Network Devices.
Note
By default, these modules display data by the last 3 years time range.
To change the time range, click on the time displayed and a configuration window will pop-up.
Choose the time range that better suit your needs and click on Update to save your preferences.
Count of tag families: Table that features the tags associated to a specific device and its count of tag families. See the Tags Table section for detailed information about the tags displayed in this view.
Tag families MAX for EPT: Table that features the MAX tag families associated to an Endpoint Type.
Tag families average for EPT: Table that features the average tag families associated to an Endpoint Type.
4.1.7.5. Profiling Metrics
The Profiling Metrics dashboard presents device tag metrics to enhance device profiling capabilities.
We can see the following views on this dashboard, starting from the header:
This header composed of four dashboards allows filtering by Network Device Location, Device Network Name, Device Network CDIRs, Endpoint Types. It will always look for the temporary index that is regenerated every day. In this toolbar, filter your data using KQL syntax.
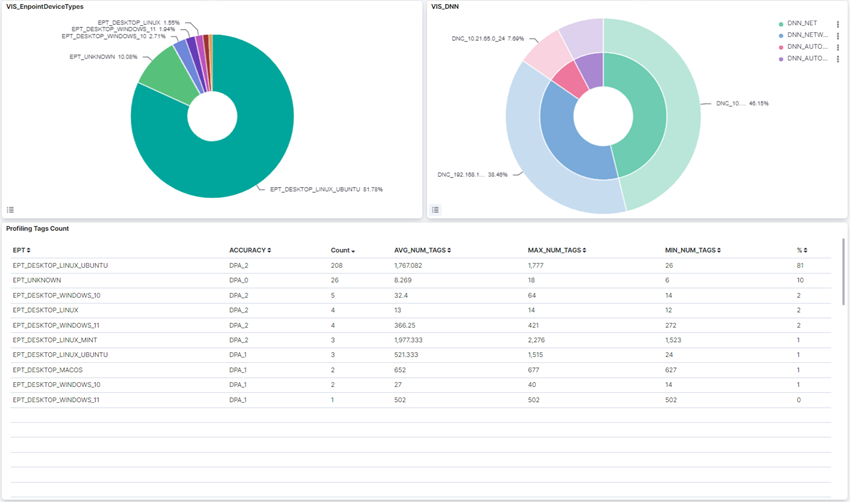
VIS_EndpointDevice_Types: A pie chart that shows the percentage of each EPT.
VIS_DNN: A pie chart that shows each subnet information with the DNN and DNC tags.
Profiling Tags Count: A table that shows information about each EPT: count, percentage, accuracy (TAG DPA), minimum number, average, and a maximum of TAGs.
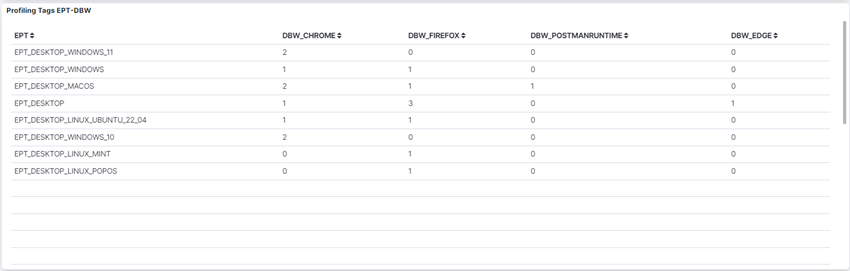
Profiling Tags EPT-DBW: A table that shows the tag account of DBW (device browser) tags by EPT.
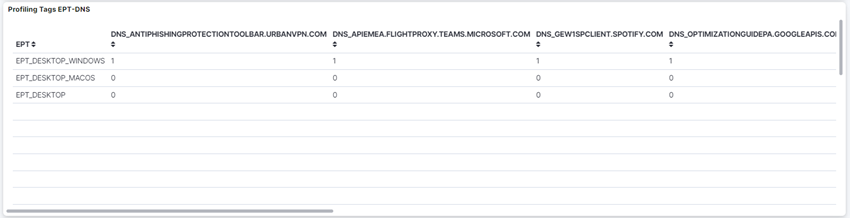
Profiling Tags EPT-DNS: A table that shows the tag account of DNS (DNS queries) tags by EPT.
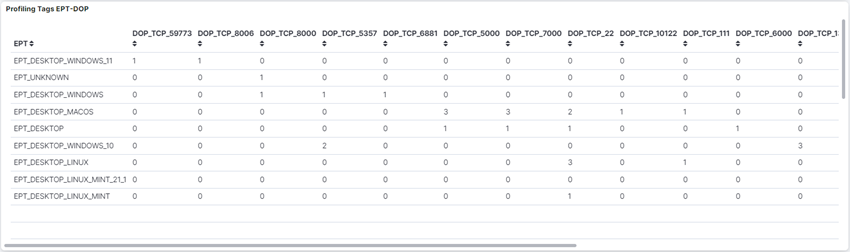
Profiling Tags EPT-DOP: A table that shows the tag account of DOP (device open port) tags by EPT.
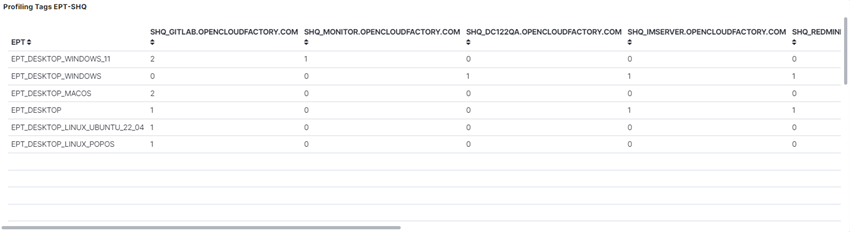
Profiling Tags EPT-SHQ: A table that shows the tag account of SHQ (SSL hostname query) tags by EPT.