4.4.1.6. Monitoring
With all the information related to the Endpoint Compliance network module that the system collects, it generates dashboards so that this information can be read and interpreted quickly and easily by the user. As a large volume of data of different types and sources is generated, different dashboards have been defined that group this information through graphs and tables.
All Dashboards have filters that allow us to define what parameters to show and what time period of the data will be used to generate said dashboards. Keep in mind that, if in the indicated period of time there has been no update on a specific device, through an event, this device will not appear.
4.4.1.6.1. UDC Overview
The UDC Overview dashboard displays all the user devices connected to the network, along with their compliance status and Agent features. We can see the following view on this dashboard:
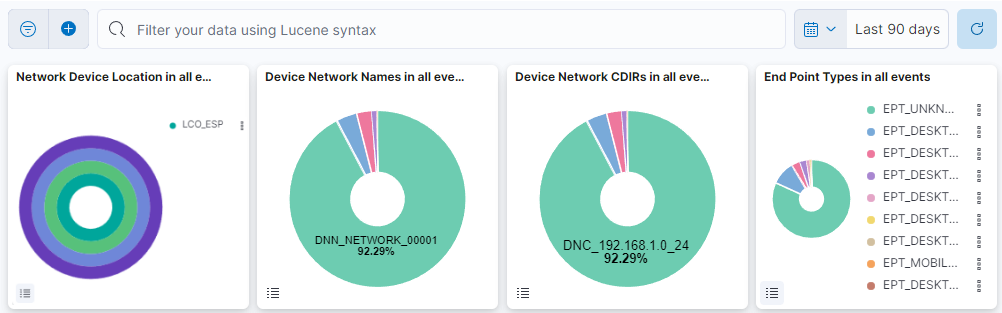
This header composed of four dashboards allows filtering by Network Device Location, Device Network Name, Device Network CDIRs, Endpoint Types. It will always look for the temporary index that is regenerated every day. In this toolbar, filter your data using Lucene syntax.
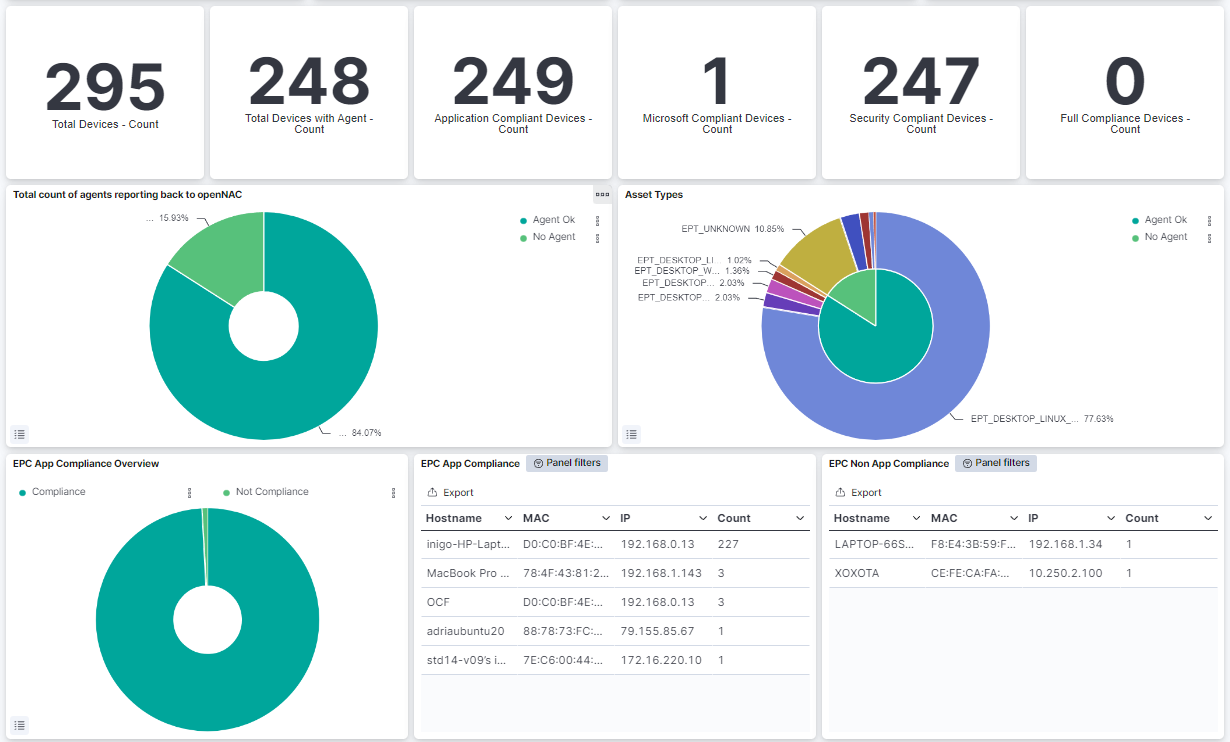
Total Devices: Shows the number of total devices in the network.
Total Devices with Agent: Shows the number of total devices with agent in the network.
Application Compliant Devices: Shows the number of application compliant devices in the network.
Microsoft Compliant Devices: Shows the number of Microsoft compliant devices in the network.
Security Compliant Devices: Shows the number of security compliant devices in the network.
Full Compliance Devices: Shows the number of full compliant devices in the network.
Total count of agents reporting back to openNAC: Represents the percentage of agentless devices and agent OK devices in agents reporting to OpenNAC.
Asset Types: Represents the percentage of EPT (END POINT TYPE) tags.
EPC App Compliance Overview: Shows an overview of application compliance within the enterprise.
EPC App Compliance: Displays detailed information about individual applications and their compliance status.
EPC Non App Compliance: Displays non-application compliance within the enterprise data.
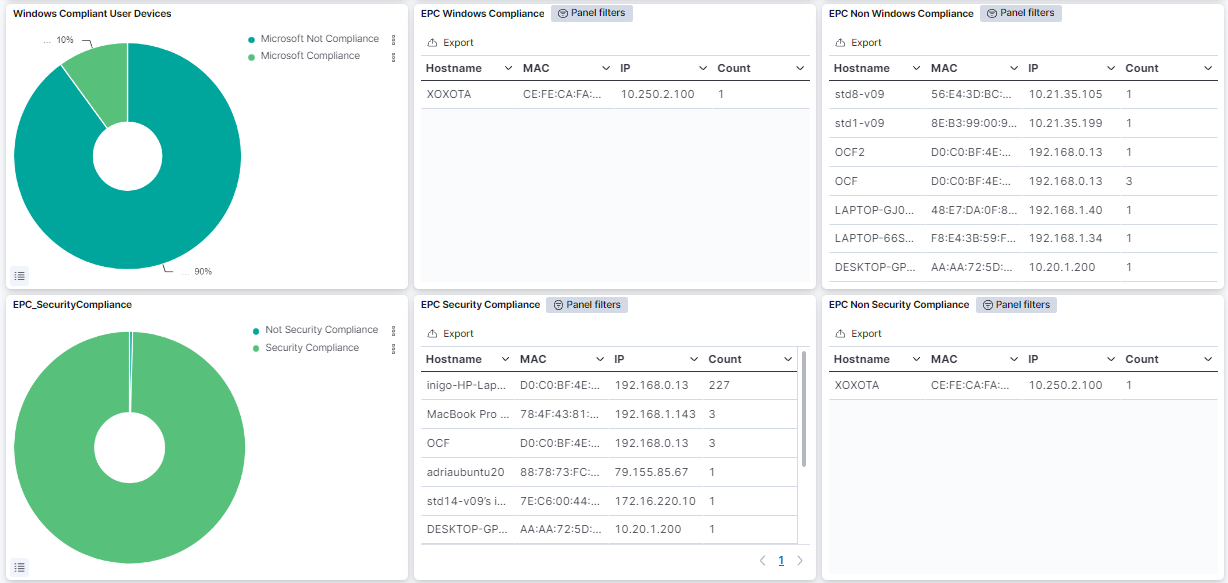
Windows Compliant User Devices: Represents the percentage of user devices with Microsoft compliance and Microsoft not compliance.
EPC Windows Compliance: Displays a table of user devices compliant with Windows. In this table the hostname is represented, as well as the MAC address, the IP, and the amount of times this event is repeated.
EPC Non Windows Compliance: Displays a table of user devices not compliant with Windows. In this table the hostname is represented, as well as the MAC address, the IP, and the amount of times this event is repeated.
EPC_SecurityCompliance: Represents the percentage of user devices with security compliance and not security compliance.
EPC Security Compliance: Shows a table with the security compliance user devices. In this table the hostname is represented, as well as the MAC address, the IP, and the amount of times this event is repeated.
EPC Non Security Compliance: Shows a table with the non security compliance user devices. In this table the hostname is represented, as well as the MAC address, the IP, and the amount of times this event is repeated.
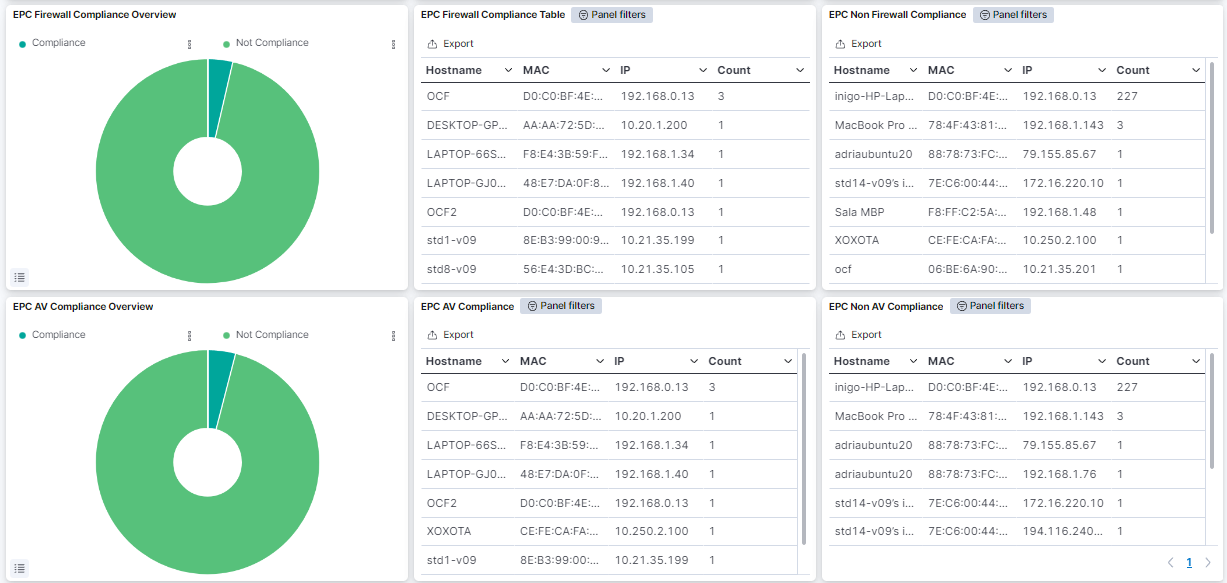
EPC Firewall Compliance Overview: Displays a graphic representation of cof both compliant and non-compliant EPC Firewalls. - EPC Firewall Compliance Table: Features a table displaying the hostname, MAC address, IP, and count of compliant EPC Firewall. - EPC Non Firewall Compliance: Features a table displaying the hostname, MAC address, IP, and count of non-compliant EPC Firewalls. - EPC AV Compliance Overview: Displays a graphic representation of cof both compliant and non-compliant EPC AV. - EPC AV Compliance: Features a table displaying the hostname, MAC address, IP, and count of compliant EPC AV. - EPC Non AV Compliance: Features a table displaying the hostname, MAC address, IP, and count of non-compliant EPC AV.
4.4.1.6.2. UDC Metrics
The UDC Metrics dashboard displays various metrics and statistics related to User Device Compliance (UDC):
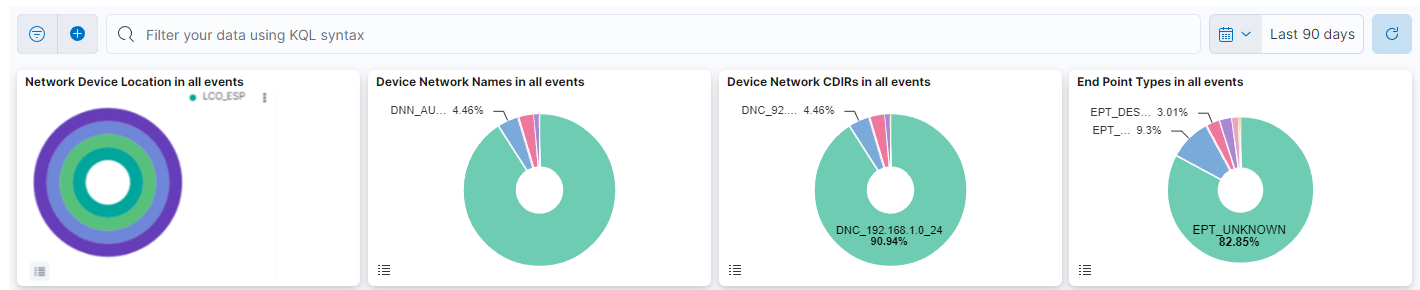
This header composed of four dashboards allows filtering by Network Device Location, Device Network Name, Device Network CDIRs, Endpoint Types. It will always look for the temporary index that is regenerated every day. In this toolbar, filter your data using Lucene syntax.
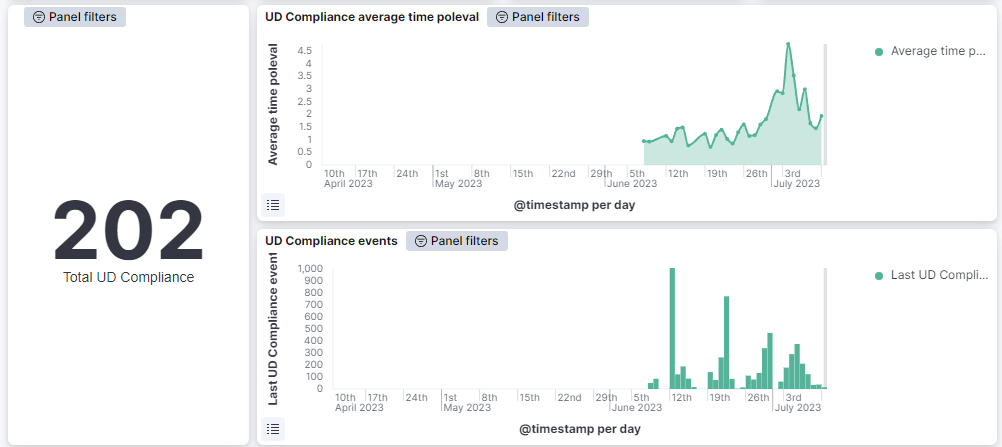
Total UD Compliance: Display the total count of compliant User Devices.
UD Compliance average time poleval: Displays the average time of poleval.
UD Compliance events: Displays the User Devices compliance events.
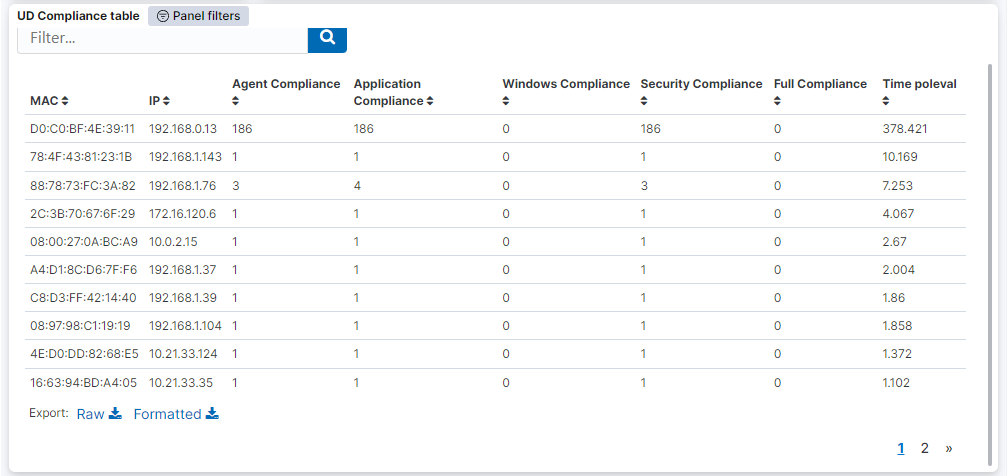
UD Compliance table: Shows a table with the compliant user devices. This table displays data for instance as the MAC adddres, the IP, and Agent compliance.
4.4.1.6.3. UDC Agent Metrics
The UDC Agent Metrics dashboard displays various metrics and statistics related to Agent events:
This header composed of four dashboards allows filtering by Network Device Location, Device Network Name, Device Network CDIRs, Endpoint Types. It will always look for the temporary index that is regenerated every day. In this toolbar, filter your data using KQL syntax.
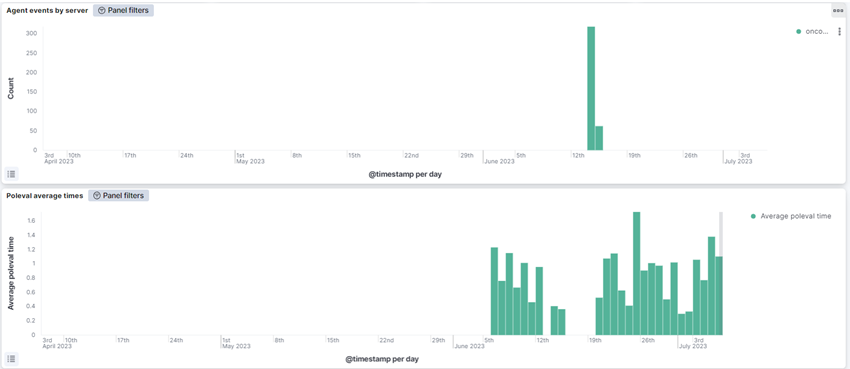
Agent events by server: Metric that represents the agent events by server.
Poleval average times: Metric that represents the average time taken for poleval (policy evaluation) in a specific timestamp.
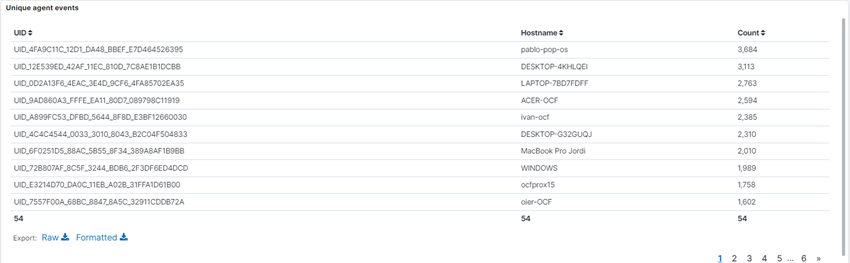
Unique agent events: Table that features the UID (Device Unique Identifier) tags, hostname and count of unique agent events.
4.4.1.6.4. EPT Changes
The EPT Changes dashboard displays information and records related to changes in Endpoint types:
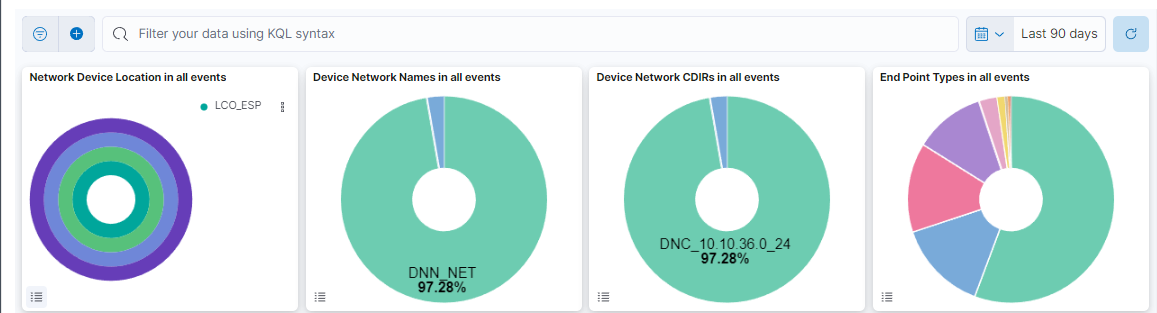
This header composed of four dashboards allows filtering by Network Device Location, Device Network Name, Device Network CDIRs, Endpoint Types. It will always look for the temporary index that is regenerated every day. In this toolbar, filter your data using KQL syntax.
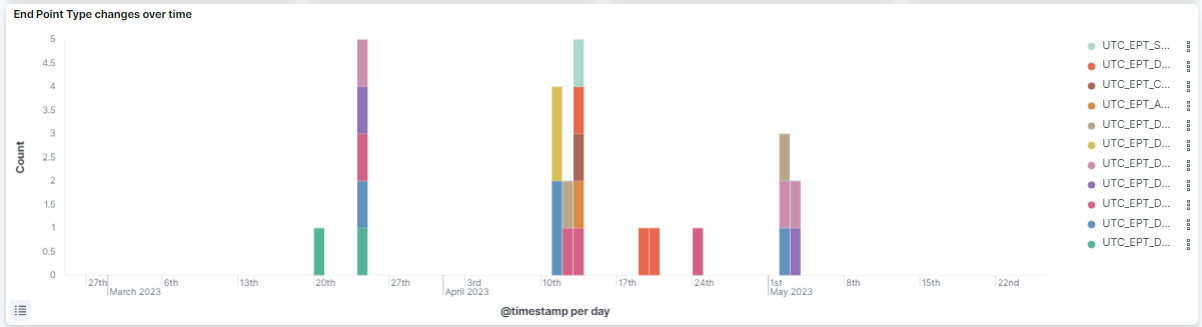
EndPoint Type changes over time: Displays a graphic with the changes over time and the tags associated to the EPT.
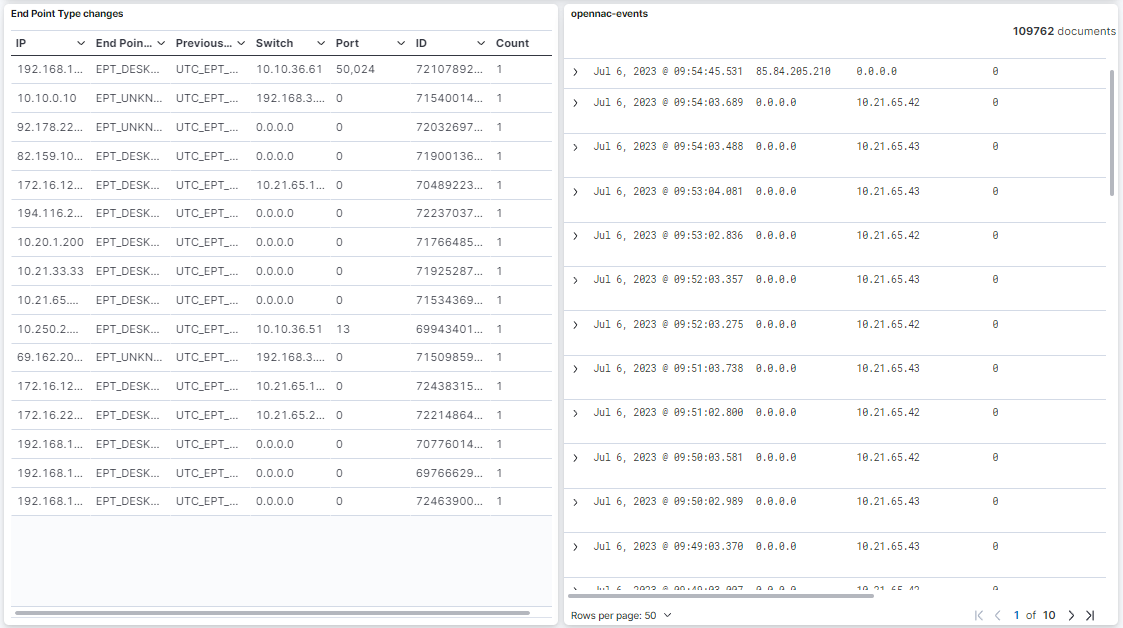
EndPoint Type changes: Table that displays APT changes details, including the previous EPT tags (UTC) and the count of those events.
oppenac events: Displays events related to the EPT change.
You can also navigate to Administration Portal > Analytics > UDC to find information about the dashboards available for this use case.