9.4. SIEM Logs
This section will explain the logs that are sent to the SIEM if said integration (SIEM Integration) has been configured.
This is intended to be a guide on how we can interpret these logs in order to configure alerts in the SIEM to detect possible failures.
Note
Before proceeding to analyze the logs, its recommended to check the different types of events and their explanation on Events List page.
9.4.1. SIEM Logs Structure
The logs that are generated in OpenNAC are sent to the SIEM in syslog format, with the header containing the timestamp the log was generated, the hostname of the host sending the log, the log name, message if and a JSON containing all the information related log.
Here we have an example of a log generated by a MAB type authentication:
This is the log in plain text that we would have:

The JSON will made up of the different values depending on the log we are sending.
9.4.2. SIEM Logs types
OpenNAC generates a large number of logs that are sent by default to the SIEM if this functionality is configured. Some of these logs are the following:
opennac-poc-sensor: This log reports all those events that occur during OpenNAC operations. For each of the event of the events list a log will be generated.
opennac-macport: With this log we maintain the information regarding the number of devices and the MACs connected to each of the ports of the network devices.
opennac-netdev-compliance: Logs related to the execution of tests from the Network Device Compliance module.
opennac-captive-analytics: These logs contain the information collected during the flows carried out in the captive portal.
opennac-nd-analytics: Logs related to the information we have configured and collected about network devices.
9.4.2.1. opennac-poc-sensor
Each of the logs in this group triggered by an event that can vary both in the cause and the effect it produces, based on the OpenNAC policy evaluation of the “module” called “poleval” in the logs.
We can find a list of such events at Events List.
Starter Events
Within the list of events, we find some that are called Starter events. This are those that cause the device session to be initialized in OpenNAC.
These can be of the following types divided between authentication and visibility events:
Authentication |
|
Visibility |
|
In use cases such as UNAC, the initializing events are usually RADIUS authentication events (8021X or MAB) since authentication is the first step to access the network, we see that there are also other events such as USER or VPN that are part of other use cases but are also capable of initializing a session. In other use cases such as Visibility, the initializing events can be SNMP, MACDISCOVER or VISIBILITY itself.
Event concatenation
Once a session is initialized (through an initializer event), subsequent events will be concatenated as a chain to the initializer in order of execution.
An example would be the following:
802.1x User>IP>PLUGIN
Here we see how the 802.1x User event has initialized the session, which has been preceded by an IP event that provides us with information about the device’s IP. Then we see that a PLUGIN event is added later. Its important taken into account that the events are unique in the chain, if in the previous example we had an IP event again, the previous IP event would disappear and this would go to the end of the chain since being newer, the information provided is more relevant.
The result would be like this:
802.1x User>PLUGIN>IP
Typical Authentication Session Flow
The sessions that are initialized in OpenNAC usually have a representative and similar structure between all of them.
Below we can see a representation of the typical structure of a correct session from start to finish.
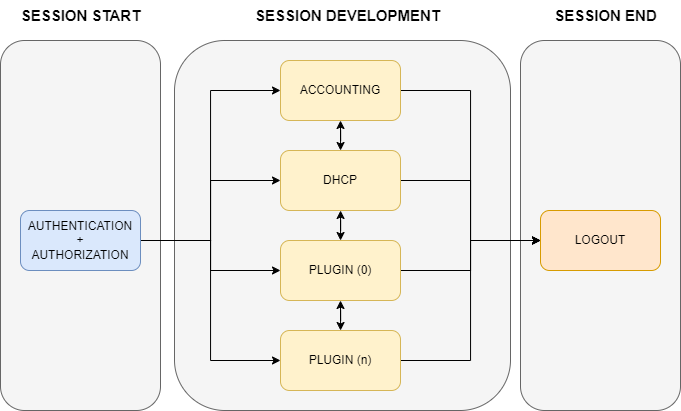
We can see that the session is initiated through the authentication of the user device, this is done through one of the Starter Events List.
Once the user device has accessed the network and we start the session, during the course of the session several events will be generated that will complement the session. These events may be generated repetitively throughout the session. Some examples are radius Accouunitng messages, information received through DHCP, or information we collect through the use of OpenNAC plugins. These events will not always be executed in the same order or simply not executed depending on the installation and system configuration.
Finally, upon receiving a LOGOUT event, we will terminate the session.
Here we can see what this event flow would look like in the ON Analytics “Discover” menu:
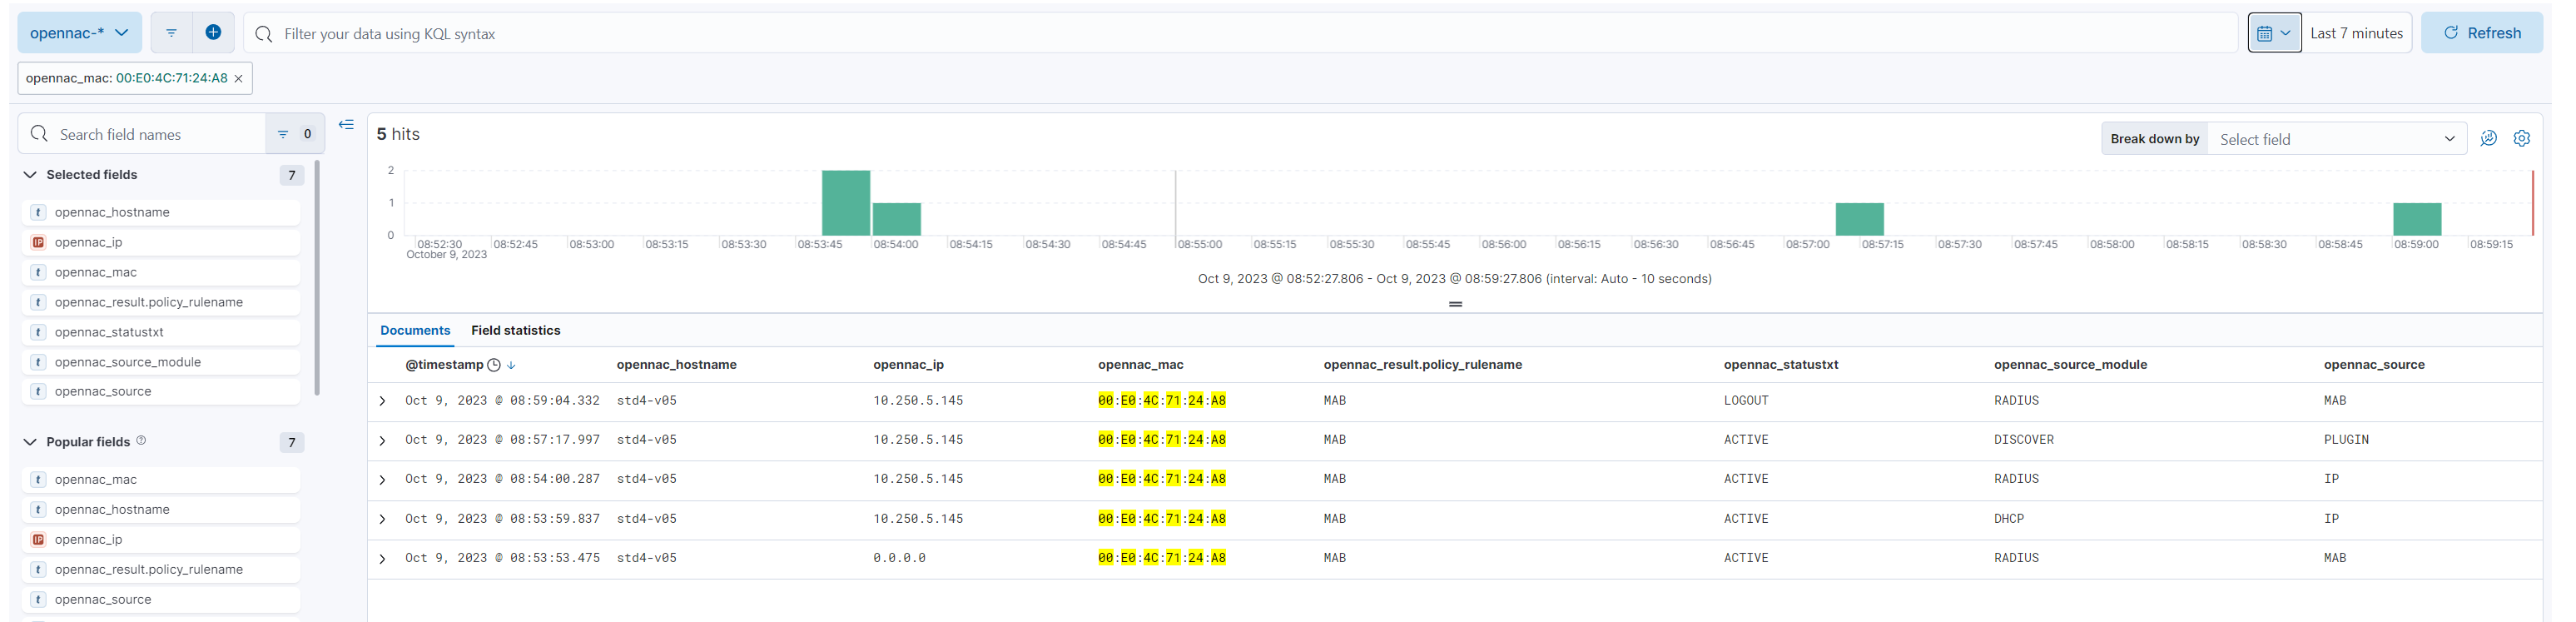
As we can see, the session begins with the MAB event (“opennac_source”) and the information is complemented with several events such as IP events where we have two sources, the DHCP module and the RADIUS module (“source_module”). Later we see that a PLUGIN has been executed, which in this case is DISCOVER. And finally we can see how the session (“openac_statustxt”) is closed with the LOGOUT event.
To access the ON Analytics discover menu you will have to go to “Analytics -> Discover”.
9.4.2.1.1. Authentication
In this section we will discuss about the different authentication events and the logs they generate.
Authentication events are those that, as their name indicates, represent authentication, that is, the validation of certain data, such as credentials, certificates or others, to validate access to the requested resources. We can find several types of events such as those based on 802.1x or MAB for the UNAC use case, user authentication events to authenticate network electronics, third-party services, etc.
Event in Discover:

SIEM Log JSON:
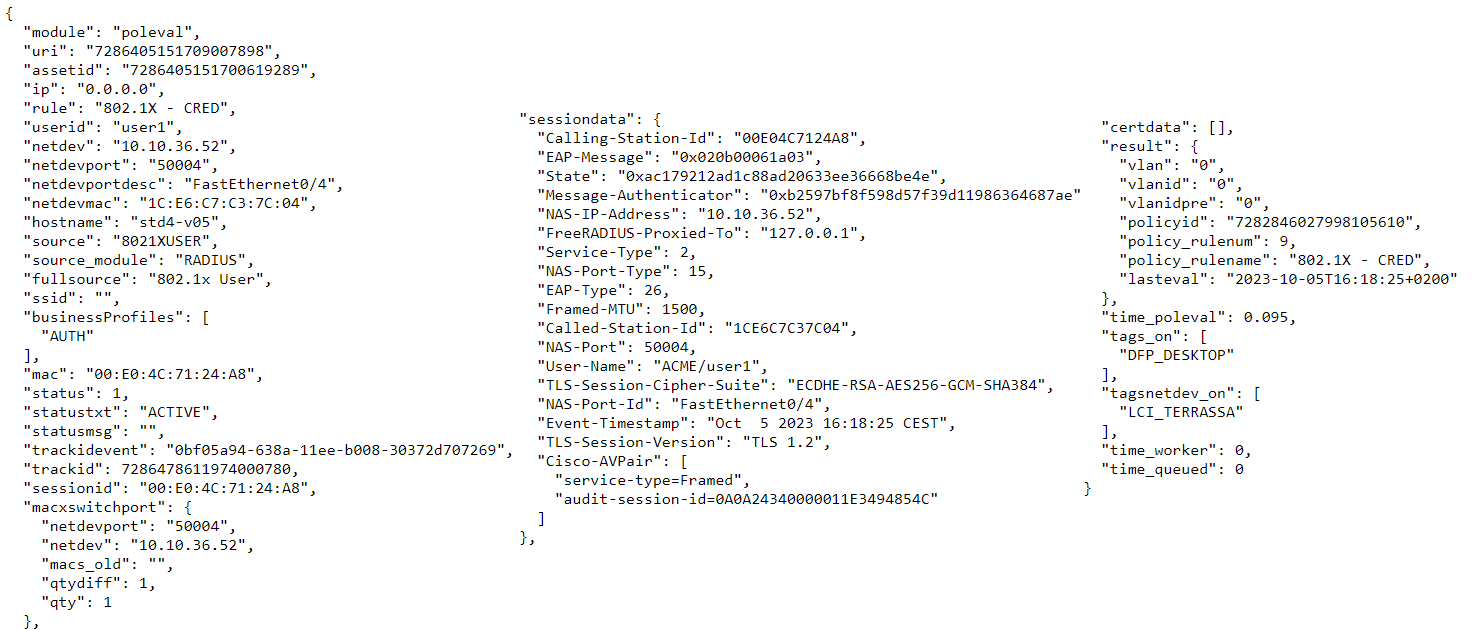
Here we have an example of an event of MAB authenticationR and we can see that we have a lot of information regarding the event. Below we will explain the information contained in this authentication logs.
Important Information:
In this first point we will focus on what we consider the most important information contained in the authentication logs. This information is what can give us more data and indications about the status of the events and sessions on the platform.
ip: The IP of the user device is specified in the ip field. This ip will come as “0.0.0.0” in case in the current or subsequent event, no information has been included that allows us to relate the device’s mac with an ip.
rule: This information corresponds to the policy that the event has matched during the policy evaluation.
userid: The userid corresponds to the user identifier. This information is completed based on the data presented for authentication. These can be different depending on the type of authentication, in an 802.1x-User authentication, this will be the user of the credentials, in an 802.1X-CERT authentication it can be filled with the certificate data (“TLS-Client-Cert-Common-Name”). It is also possible that in some events such as MAB this comes empty since there is no username as such but rather we use the mac address as a credential.
netdev: Here we can see the IP of the network device (NAS) that is performing the authentication against OpenNAC.
netdevport & netdevportdesc: These two fields are the identifiers of the port to which the user is connected, one is the port ID itself and the other is the associated description.
hostname: The hostname field tells us the computer name of the user device that is being authenticated. If it is not possible to collect this information, the field will be empty. In some authentications such as 802.1X-HOST, this field will be the same as the “userid” field since the authentication credentials used by the supplicant are those of the device itself.
source: This field will indicate the source that generated the event. This source is important to determine the type of event that is reaching us and understand the reason for the other values included in the log.
fullsource: The fullsource field indicates the concatenation of events after the start of the session. With this field we can see what events have been executed for this session and in what order.
mac: The mac field corresponds to the physical address of the user device to which the session belongs. In some events such as “USER” where there is no user device as such, this information may come as “00:00:00:00:00:00”
status & statustxt: The status and statustxt field indicate the same information in different formats. In the status field we will have the numerical value of the session state while in the statustxt field we will have that same information in text format. There are different session states and these vary depending on the event received, some states can be ACTIVE (when we start or keep a session started), REJECT (when the session is rejected for some reason) or LOGOUT (when the event received tells us that the session has ended).
Additional Information:
The logs also contain a large amount of information that, although not so relevant, in some cases can be very useful to know more information about the events and states of the session.
module: In the module field we can see which module the event is based on, in this case it is the “poleval”, that is, the evaluation of the policies defined in OpenNAC.
netdevmac: This is the physical address of the network device related to the event, in this case the NAS that is performing the authentication.
businessProfiles: Here the business profile to which the session has been assigned will be indicated.
ssid: In case it is an authentication event on a WiFi network, in this field we will have the ssid to which the user device tries to connect.
macxswitchport: This field maintains the number of devices and their MACs connected to the same port of the network device related to the event.
source_module: The source_module is the field that indicates which module caused the event. These can be several, such as the “radius” module when we have authentication or radius accounting events, the “dhcp” module when we have dhcp visibility events, etc.
statusmsg: This statusmsg field details information regarding the state of the session. In events where authentication is failing, here we will find information regarding the reason why it is failing (incorrect credentials, certificate failure, etc.).
sessiondata: The sessiondata field contains a lot of information that is uploaded through the module that generates the event. In the case of RADIUS authentications, the information contained in this block corresponds to the data and attributes of the RADIUS authentication.
result: The result field contains all the information related to the effect produced by the event, this includes the VLAN assigned to the user device, the session state, the policy information, etc.
certdata: If you are performing an 802.1X-CERT authentication, this field will be filled with the information of the certificate presented by the user device. In other events where there is no certificate, the field will be empty.
tags_on: Here we will find the list with all the tags that the user device involved in the event that generates the log has.
tagsnetdev_on: Here we will find the list with all the tags that the network device involved in the event that generates the log has.
Internal Identifiers:
Identification fields are values that allow us to identify data internally. These values do not usually have much importance in basic operations, but they can be helpful when identifying problems and performing subsequent troubleshooting.
sessionid: The sessionid is the identifier of the session that generates the events, this identifier allows us to trace the changes in the user session. This id is generated differently depending on the type of initializing event and the information available at that moment.
uri & assetID: Internal identifiers of the user device. We can notice that in some events, like the “USER” events, the uri and assetID are empty, this is because the event has not generated or is not related to any specific user device so these identifiers do not exist.
trackidevent & trackid: Internal traceability identifiers. These identifiers allow us to trace events in advanced troubleshooting scenarios.
Performance Indicators:
In the logs we can find parameters related to the performance of the platform. These can tell us if it is taking too long to respond to requests.
time_poleval: Time in which it took to carry out the policy evaluation.
time_worker: In the case of events that must be processed through queues, such as some plugins, this is the time it took for said process to be executed.
time_queued: In case of events that must be processed through queues, such as some plugins, this is the time it has been in queues before being processed.
By monitoring these times we can detect performance problems during work peaks, this would allow us to take appropriate measures to mitigate them.
9.4.2.1.2. DHCP
As we have already seen, after the authentication event we will expect information events to arrive that complement the device information through various sources. In this first case we have the “IP” event triggered by the DHCP module (“Dhcp-Helper-Reader”).
Event in Discover:

SIEM Log JSON:
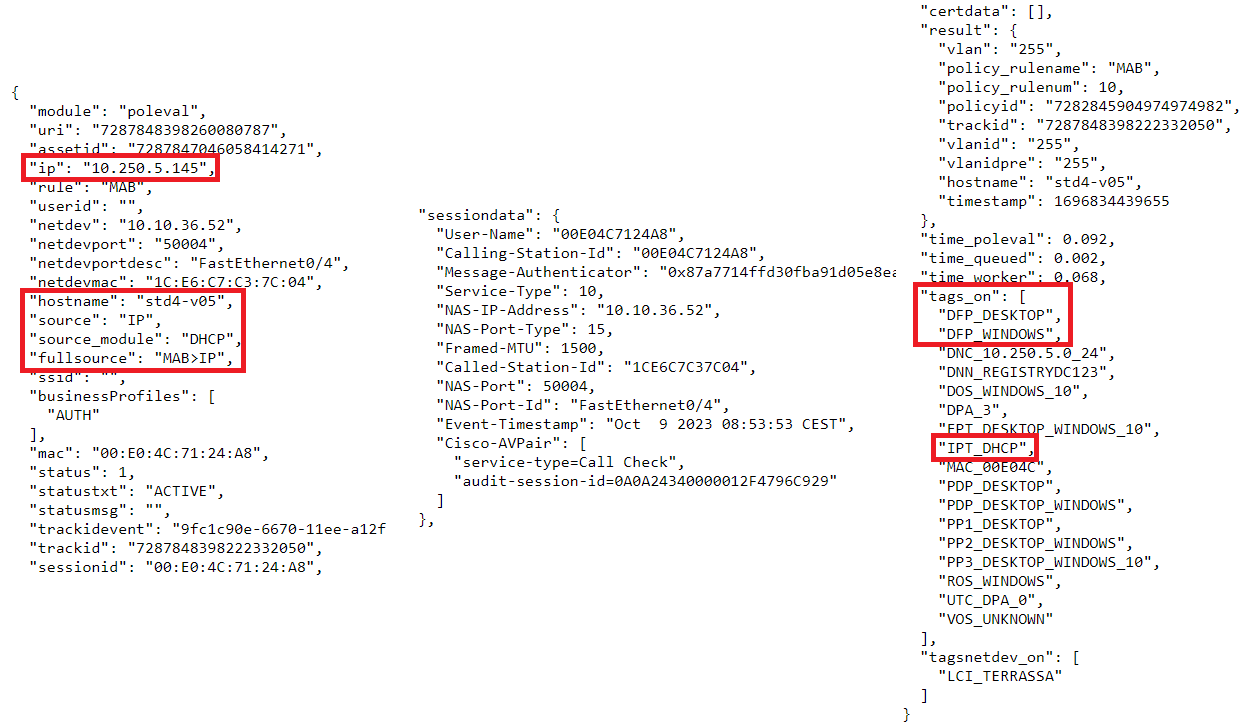
Here we can notice that unlike the authentication event we already have the “ip” field filled in thanks to the information received by DHCP. We can set that the “source” is “IP” since the events are of that class. On the other hand, “source_module” tells us that this event has been triggered by the DHCP module. In the tags section of the device “tags_on” we can see that the tags “DFP_*” and “IPT_DHCP” have been added (Tags Table) indicating that the device has obtained one IP per DHCP.
9.4.2.1.3. Accounting
Another way to obtain information about a user device’s session is through RADIUS Accounting messages. These messages provide us with information such as the session time or the IP of the device.
Event in Discover:

SIEM Log JSON:
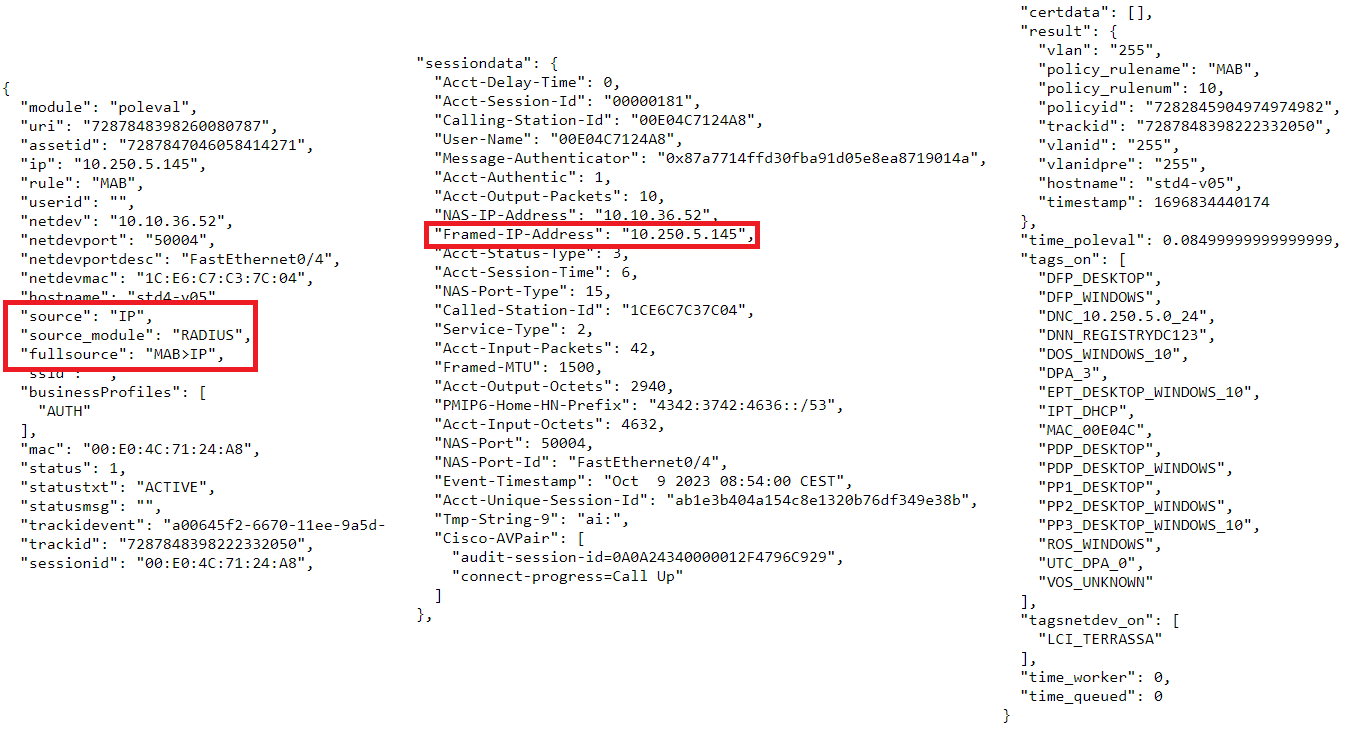
Here we can see in the “source” field how we have an “IP” event that has triggered the RADIUS module (“source_module”) since it is an Accounting message. In the accounting messages where the device’s IP is specified, this information is encapsulated in the “Framed-IP-Address” attribute of the RADIUS message that we can see in the “sessiondata” field.
Let’s remember that in this case we come from a previous DHCP event and if we look at the “fullsource” we see that we only have one IP after authentication (“MAB”), this is because as we have explained in Event Concatenation, we only keep the last event of the same type because it is the one that provides the most recent information.
9.4.2.1.4. Plugin
If we have Plugins activated in the policy where a policy evaluation matches, we will see events of this type regularly during the course of the session. These events correspond to the execution of said plugins and report the status of the execution as well as the information they have collected.
Note
Only Asynchronous plugins (that run outside of policy evaluation) will appear as separate events from the event that causes them to run. For more information check Plugin Types.
Event in Discover:

SIEM Log JSON:
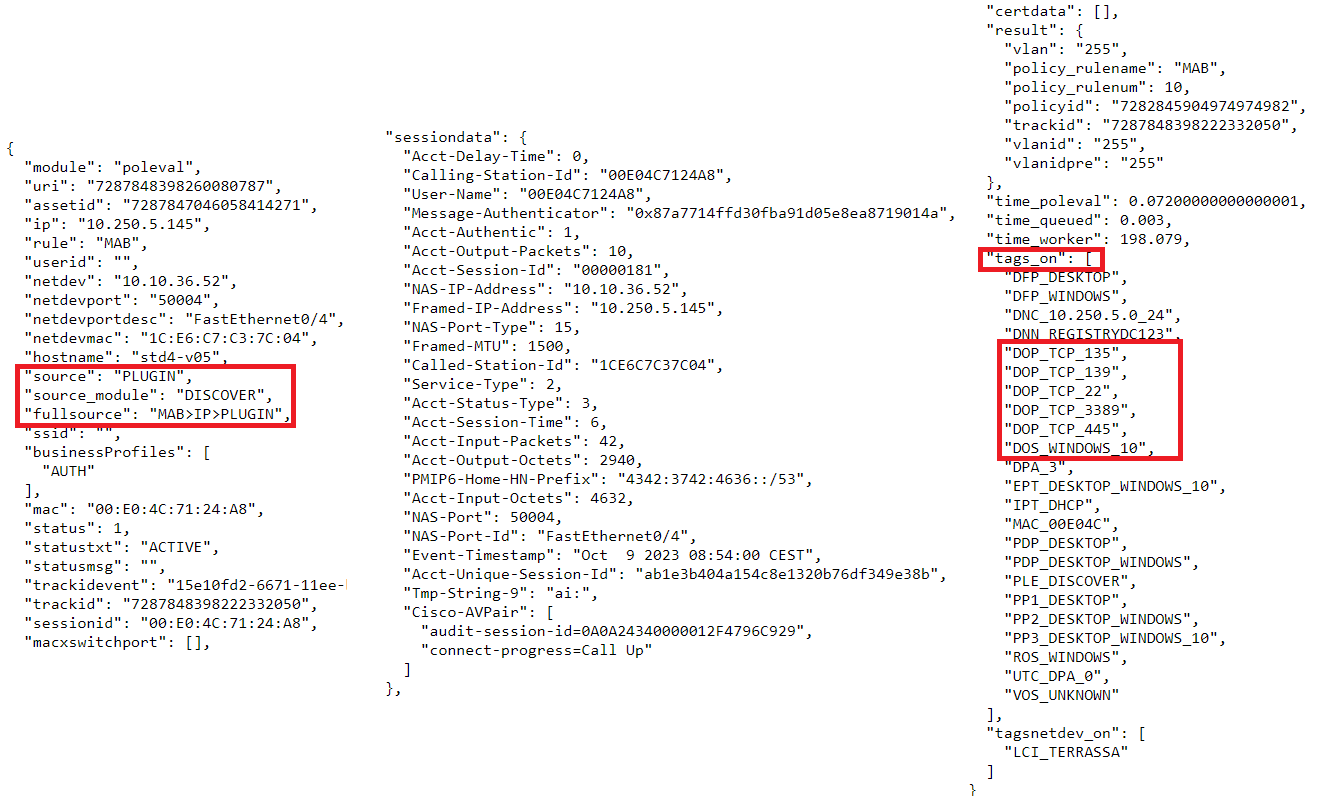
In this case we see that the event is of type “PLUGIN” (“source”) and that the trigger of this event has been the DISCOVER plugin (“source_module”). We see that in event chain (“fullsource”) the plugin has finished executing after the “IP” events.
As we can see in the “tags_on” field, the plugin has added some (tags) to the user device that could be relevant for device profiling or knowing the compliance status.
As it is a job that has been queued, we can look at the “time_worker” field where we will see the time that the execution of this plugin has lasted.
9.4.2.1.5. Logout
Logout events are those that indicate that a user device has been disconnected from the network or service. These events can come from different modules where the most typical is a RADIUS Accounting message sent by the Network Device that has authenticated the device.
Event in Discover:

SIEM Log JSON:
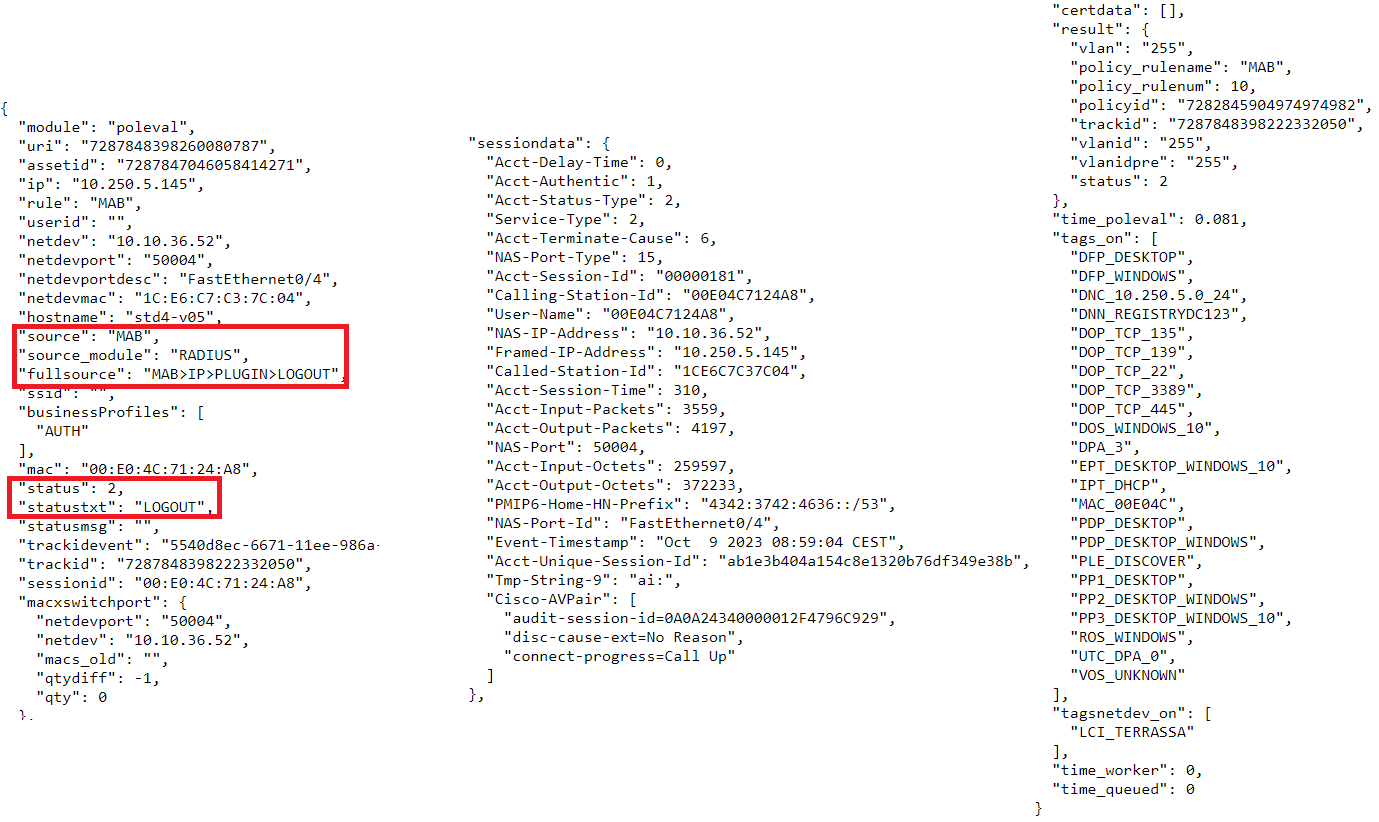
The “fullsource” field is interesting here; this field tells us the concatenation of events from the initialization of the session. In this case, we can see how the user started by connecting to the network through a “MAB” authentication, later we received information about the IP of the device (this could be through various sources Accounting, DHCP-Helper-Reader or Sensor) . Once the IP was obtained we can see how a PLUGIN was executed (for example the discover one that needs the IP of the device to be executed) and finally the user device was disconnected, with the LOGOUT event.
Here the “status” and “statustxt” fields indicate that the session is ending (2 = LOGOUT).
9.4.2.1.6. Reject
“REJECT” logs are authentication events in which the access request has been denied. This denial may be due to various factors.
SIEM Log JSON:
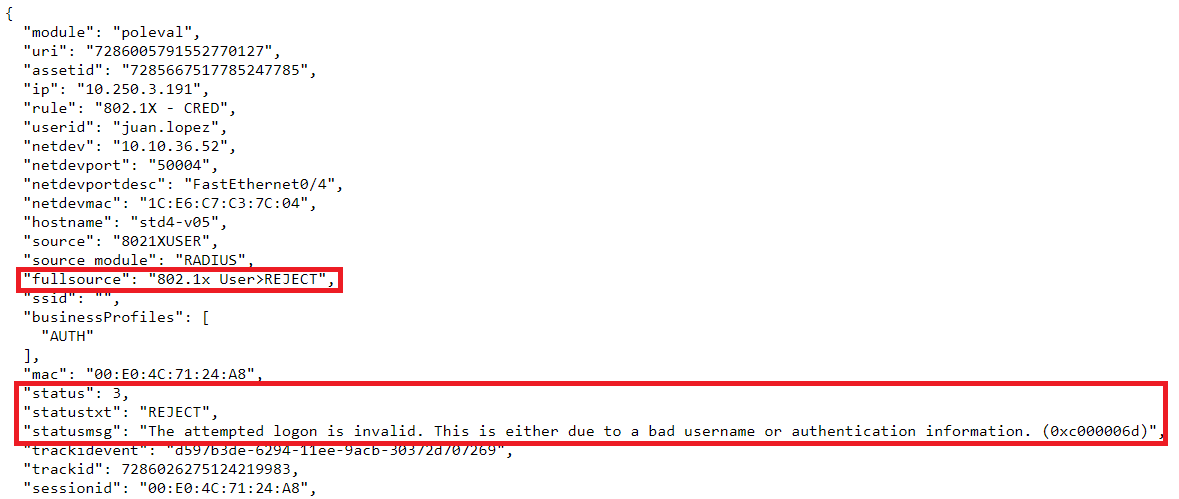
As we can see here we have an event where the “source” is an 802.1XUSER, this means that the user tries to access through 802.1x using credentials (User/Passord). If we look at the “fullsource” we see that the 802.1XUSER event has triggered a “REJECT”, that is, access has been denied.
In these situations we are interested in knowing why this reject could have happened. This information will be given to us by the “statusmsg” field, which will indicate the reason for the failure. In this case it tells us that the credentials entered by the user may be incorrect. We can find the user in the “userid” field but since it is an EAP authentication, the password will be encrypted and we will not be able to see it.
Another case, is that the user has matched a policy where access is explicitly denied for some reason such as non-compliance. This policy is detailed in the “rule” field.
If doing mach in this REJECT policy is not what was expected, we could look at the different parameters of the session in the “sessiondata” field or at the device tags in the “tags_on” field in case you are missing any to be able to access the expected policy.
Here the “status” and “statustxt” fields indicate that the session has been rejected (3 = REJECT).