2.5. Architecture Scalability
In this section, we explain the scalability of the OpenNAC Enterprise architectures: the basic ones and the specific ones for the different Use Cases.
2.5.1. Standard scaling
Depending on the scenario we have, we need to deploy biggest architecture. We will see how to increase from basic architecture to large architecture.
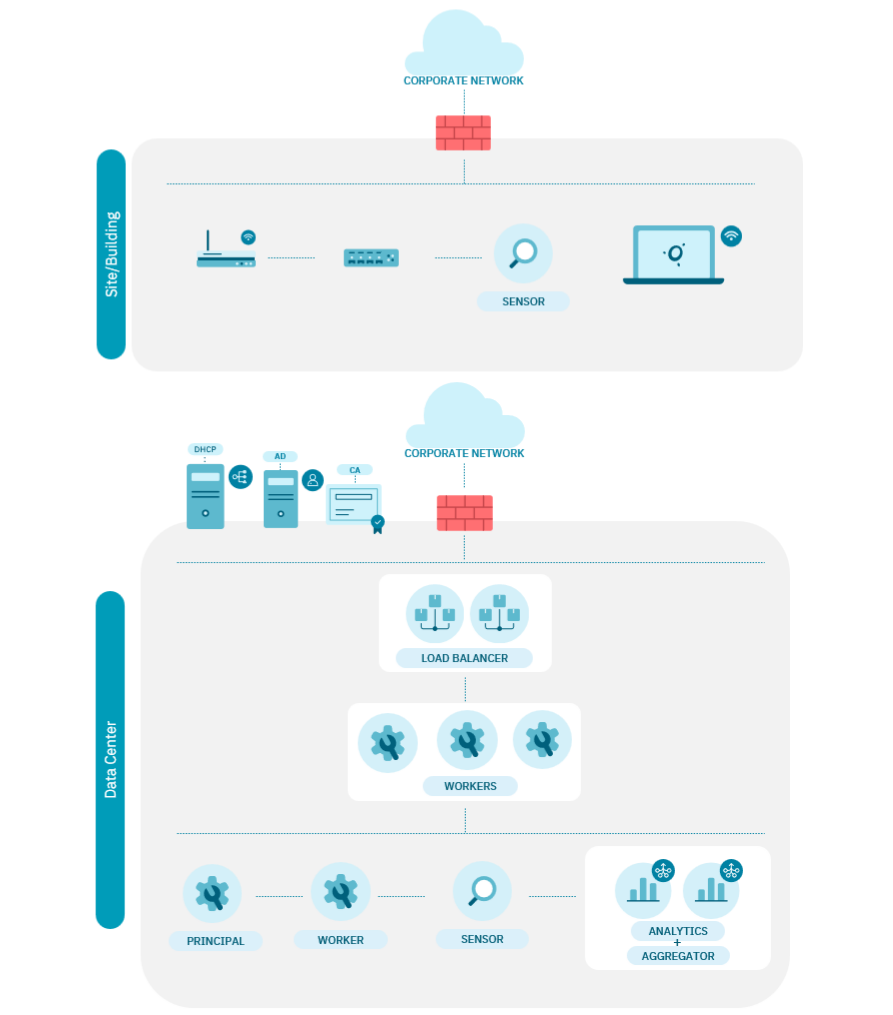
2.5.1.1. Basic architecture
A basic architecture should look like the following diagram:
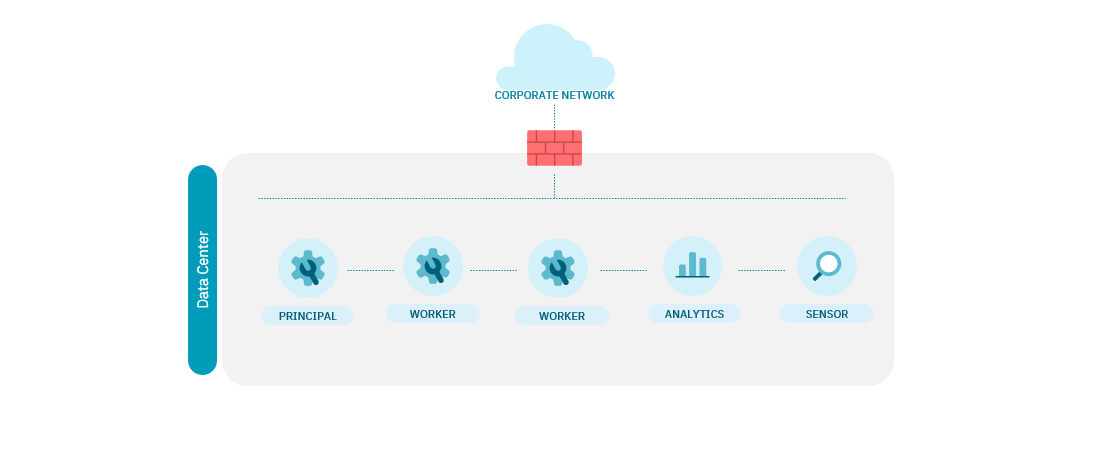
The authentication service has High Availability.
One Worker can manage more than 5.000 RADIUS authentications.
Management without HA (non-critical service) > Degraded mode
There is a dedicated sensor to provide visibility and deeper analysis of the communications generated.
Note
Request balancing can be delegated to network devices (switches, WLC, FW)
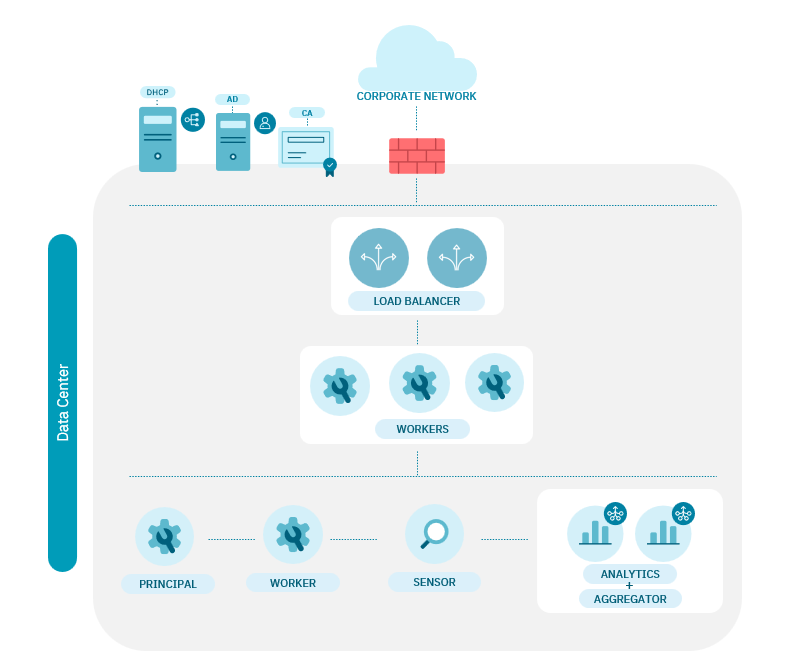
2.5.1.2. Basic architecture scaling
Scaling a basic architecture looks like the following diagram:
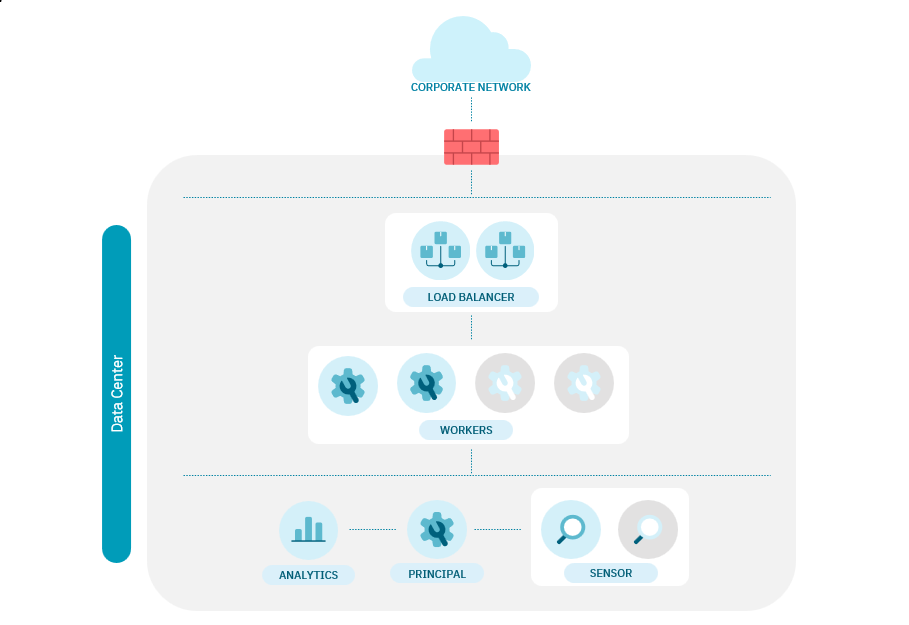
Horizontal scaling of Workers based on concurrent users and HA (2N+1).
One Worker can manage more than 5.000 RADIUS authentications.
Management without HA (non-critical service) > Degraded mode
Analytics scales based on the number of events and log traffic to be injected (see Analytics scaling).
Sensor scales based on the amount of information to be analyzed.
Load Balancing performed by ON Load Balancer.
Note
You can delegate the balancing of requests to External Load Balancers (F5)
2.5.1.3. Large architectures
A large architecture should look like the following diagram:
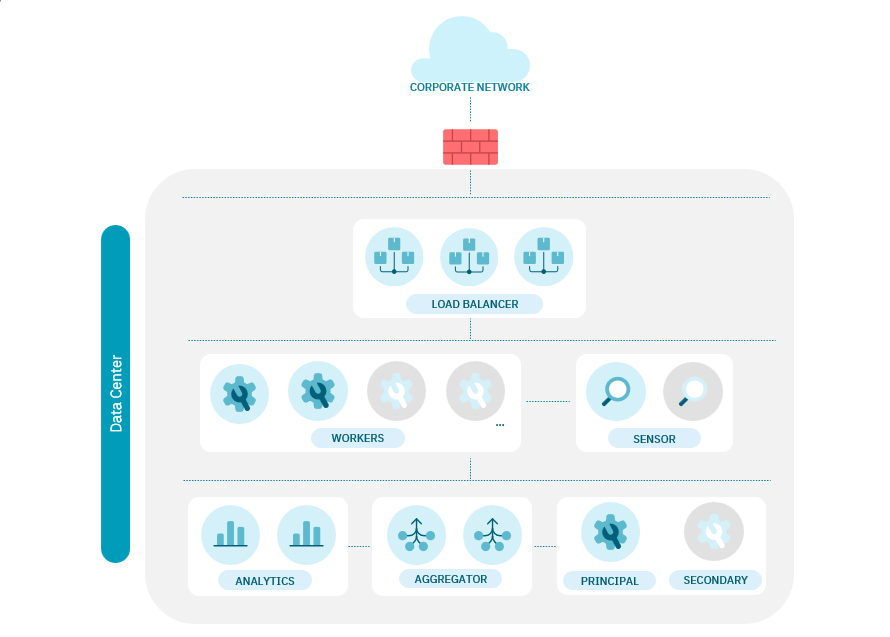
Horizontal scaling of Workers based on concurrent users and HA (2N+1).
One Principal can hold more than 32 Workers.
One Worker can manage more than 5.000 Radius authentications.
Management with HA (Active-Passive)
Analytics scales based on the number of events and log traffic to be injected (see Analytics scaling).
Aggregators are in dedicated servers.
Sensor scales based on the amount of information to be analyzed.
Note
You can delegate the balancing of requests to External LB (F5)
2.5.2. Visibility scaling
Scaling for Visibility looks like the following diagram:
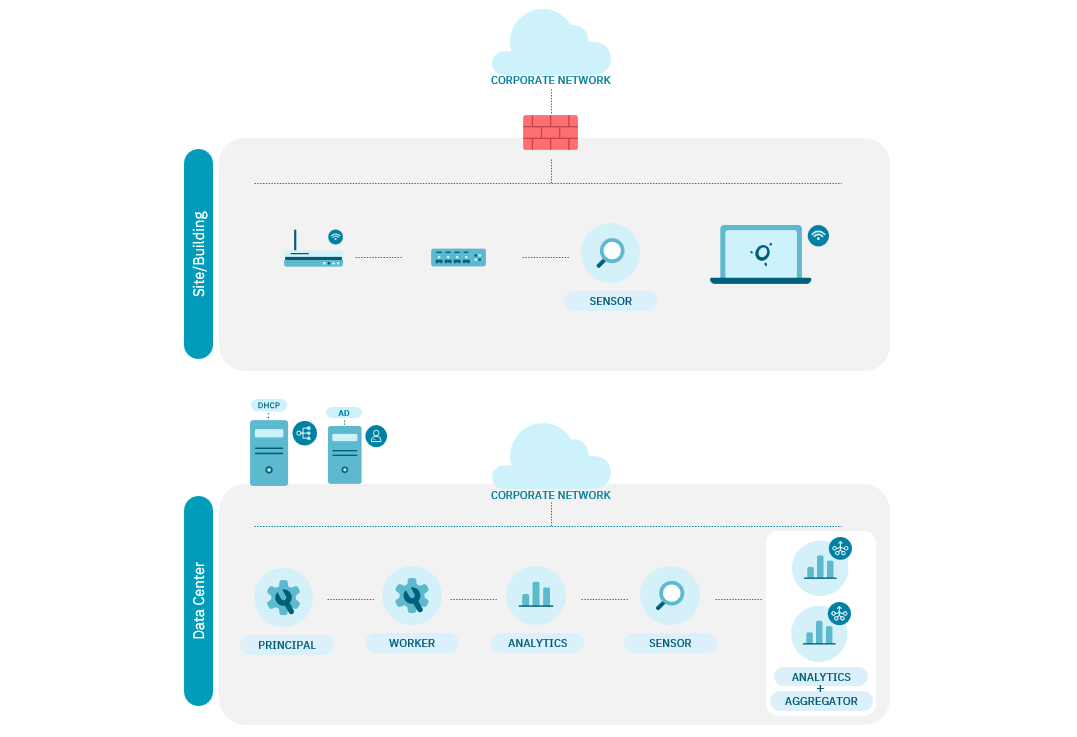
2.5.3. UNAC scaling
Scaling for UNAC looks like the following diagram:
2.5.4. 2SRA scaling
Depending of the 2SRA scenario we have, we need to deploy a biggest architecture. We will see how to increase from basic architecture to large architecture.
2.5.4.1. 2SRA basic architecture
A 2SRA basic architecture should look something like the following diagram :
High Availability (HA) both VPN and Authentication service.
One VPN Gateway can manage more than 1100 remote connections.
One Worker can manage more than 5.000 Radius authentications.
Management without HA (non-critical service).
There is a dedicated sensor to provide visibility and deeper analysis of the communications generated through the VPN.
Note
VPN Gateway can perform FW work on the Internet.
2.5.4.2. 2SRA basic architecture scaling
Scaling a 2SRA basic architecture looks like the following diagram:
Horizontal scaling of VPN Gateway based on concurrent users and HA (2N+1).
Management without HA (non-critical service).
Analytics scales based on the number of events and log traffic to be injected (see Analytics scaling).
Sensor scales based on the amount of information to be analyzed.
Note
Important traffic balancing per agent (OpenVPN) or external LB.
2.5.5. ON Analytics scaling
Depending on the network size and the information to process, we can have four different types of Analytics scaling:
2.5.5.1. One Analytics
This architecture looks like the following diagram:

Regarding this architecture:
ElasticSearch, Logstash and Kibana in the same component.
Why?
When the events, troubleshooting, dashboard and reports services are NOT CRITICAL.
Environments with a standard number of events and logs.
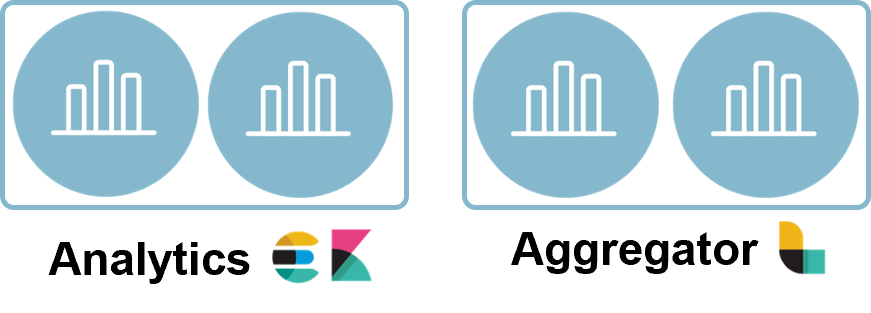
2.5.5.2. Multiple Analytics and one Aggregator
This architecture looks like the following diagram:

Regarding this architecture:
ElasticSearch and Kibana on multiple servers.
Possibility of growing horizontally.
Dedicated logstash for receiving traffic.
Why?
When the events, troubleshooting, dashboard and reports services are CRITICAL.
Environments with a standard number of events and logs.
2.5.5.3. One Analytics and multiple Aggregators
This architecture looks like the following diagram:

Regarding this architecture:
ElasticSearch and Kibana in the same component.
Possibility of growing horizontally.
Dedicated logstash for receiving traffic.
Why?
When the events, troubleshooting, dashboard and reports services are NOT CRITICAL.
Environments with a number of events and logs higher than usual.
2.5.5.4. Multiple Analytics and multiple Aggregators
This architecture looks like the following diagram:
Regarding this architecture:
ElasticSearch and Kibana on multiple servers.
Dedicated logstash for receiving traffic.
Spread across multiple servers with a single instance of Logstash.
Possibility of growing horizontally.
Why?
When the events, troubleshooting, dashboard and reports services are CRITICAL.
Environments with a standard number of events and logs.
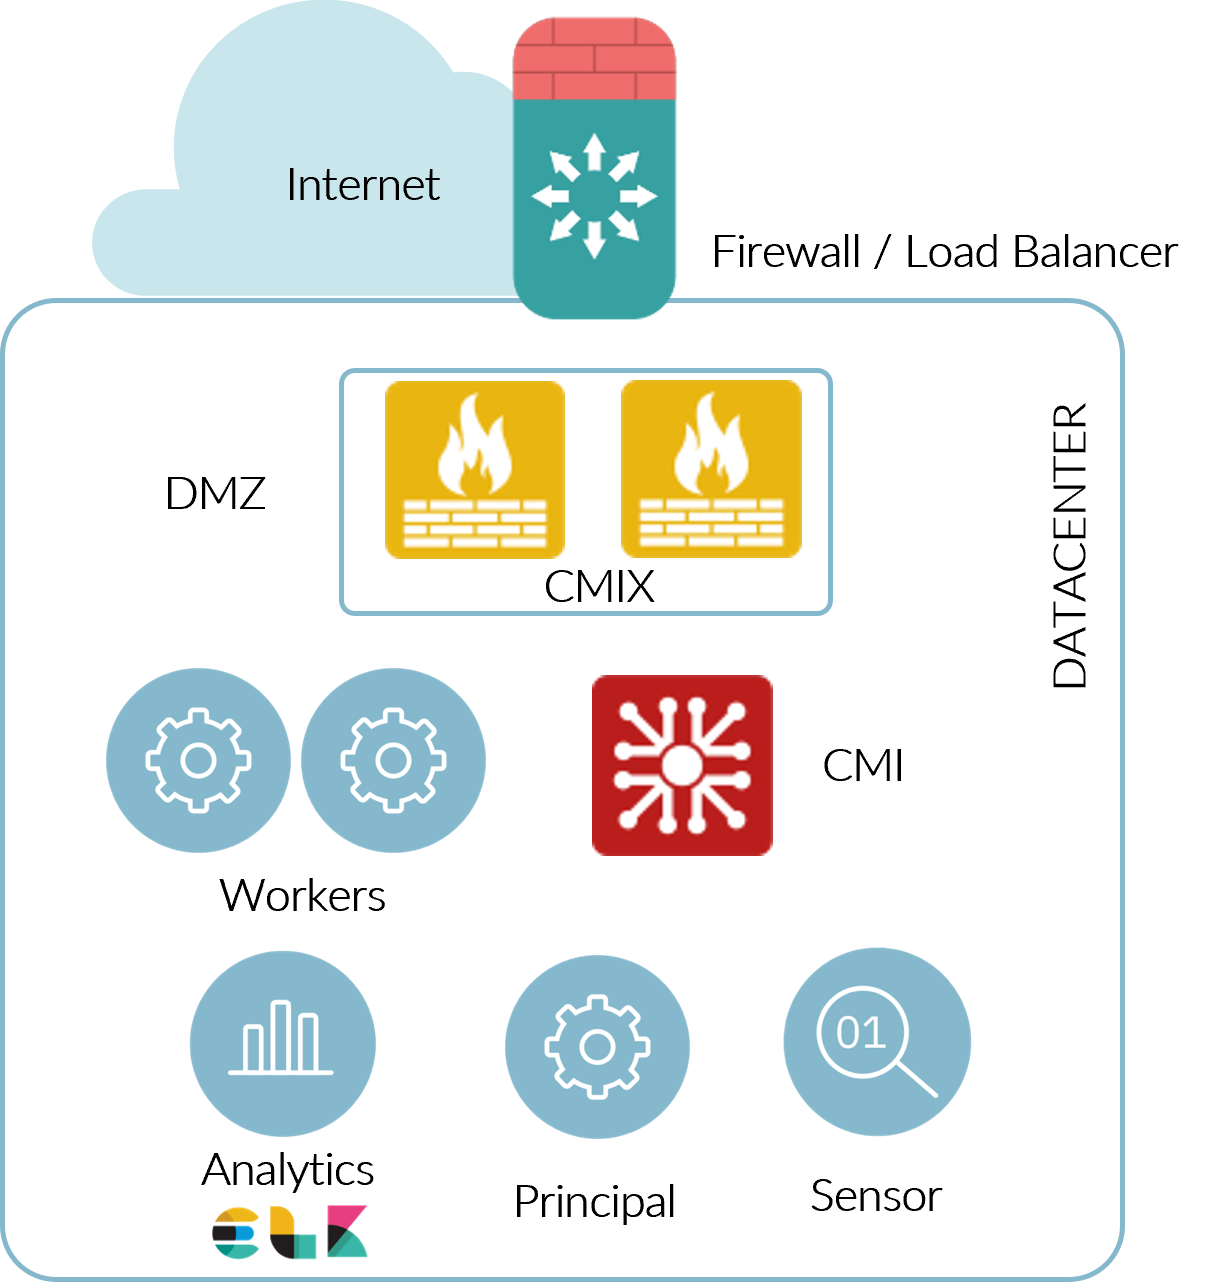
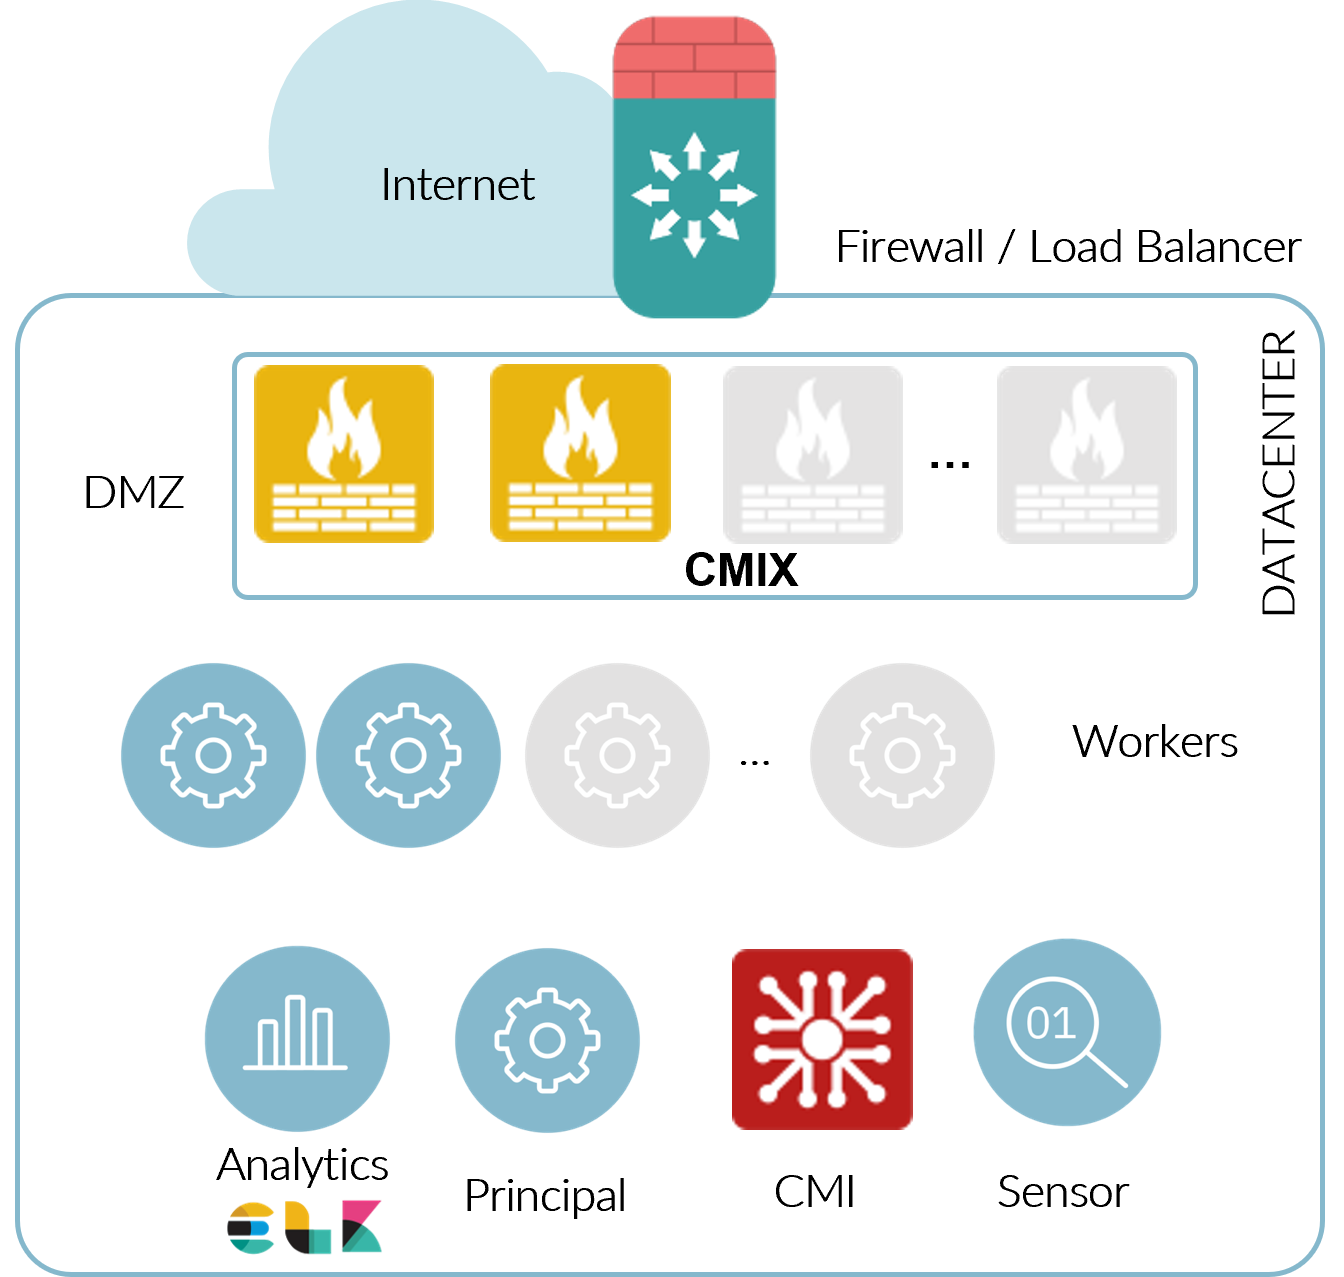
2.5.6. Captive Portal
When an external Captive Portal is needed, we have the following architecture:
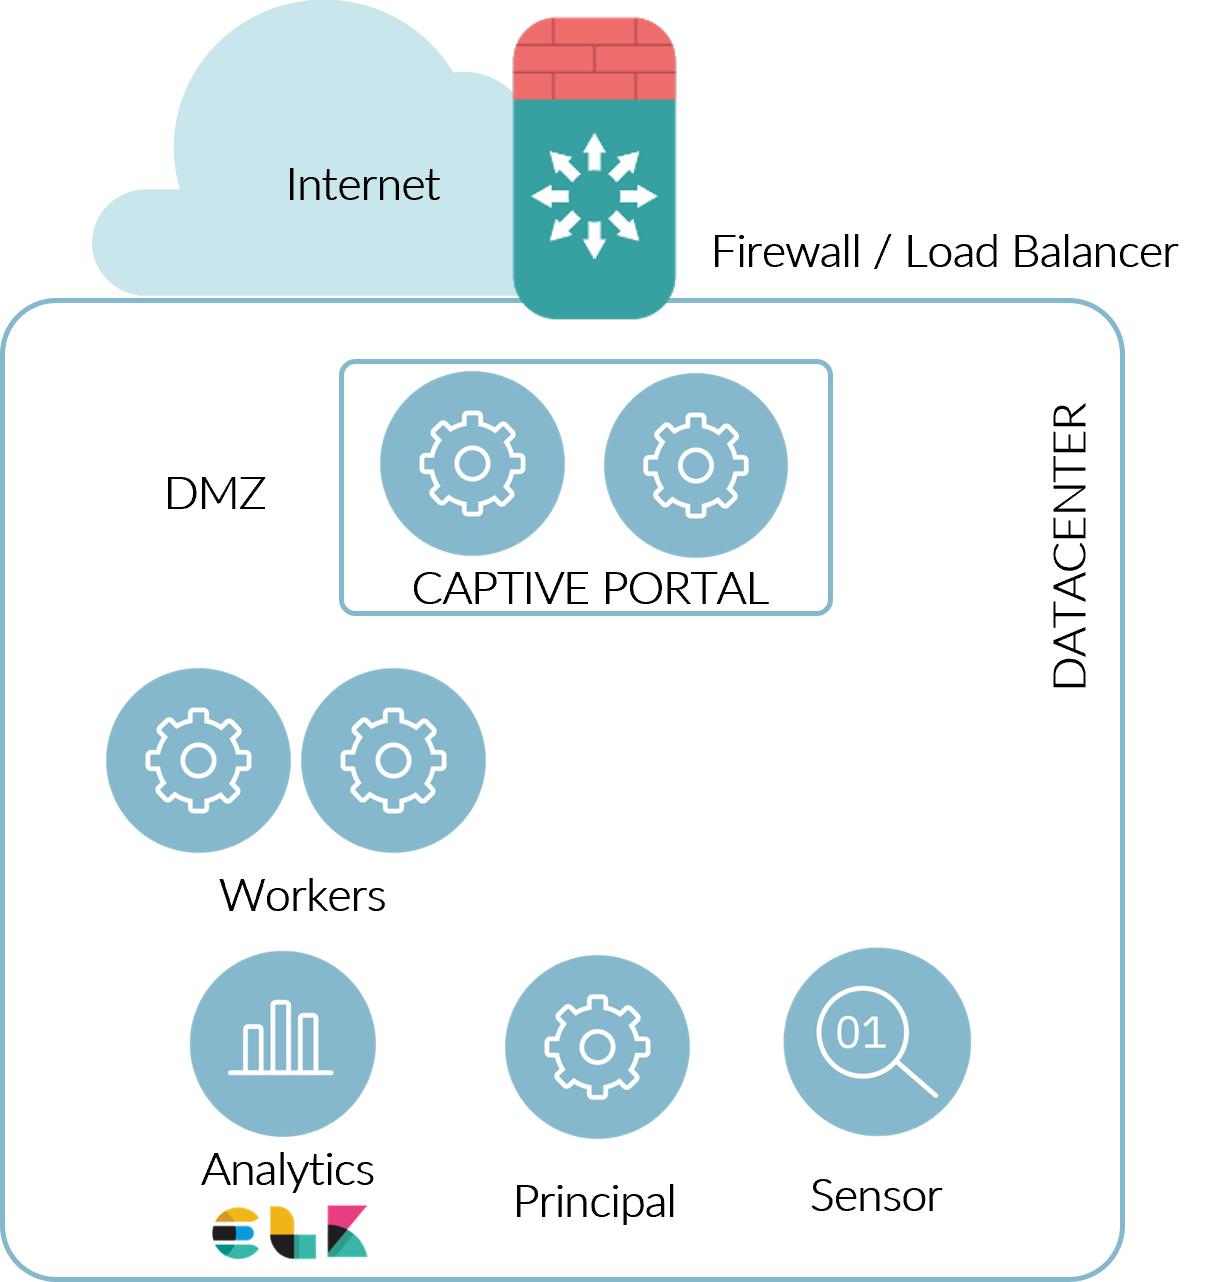
Service published to external clients so it would have to be located in the DMZ.
Dedicated worker in DMZ.
Without the common Worker services running.
2.5.7. Principal and worker
It is possible to have a Principal and a Worker running on the same component:
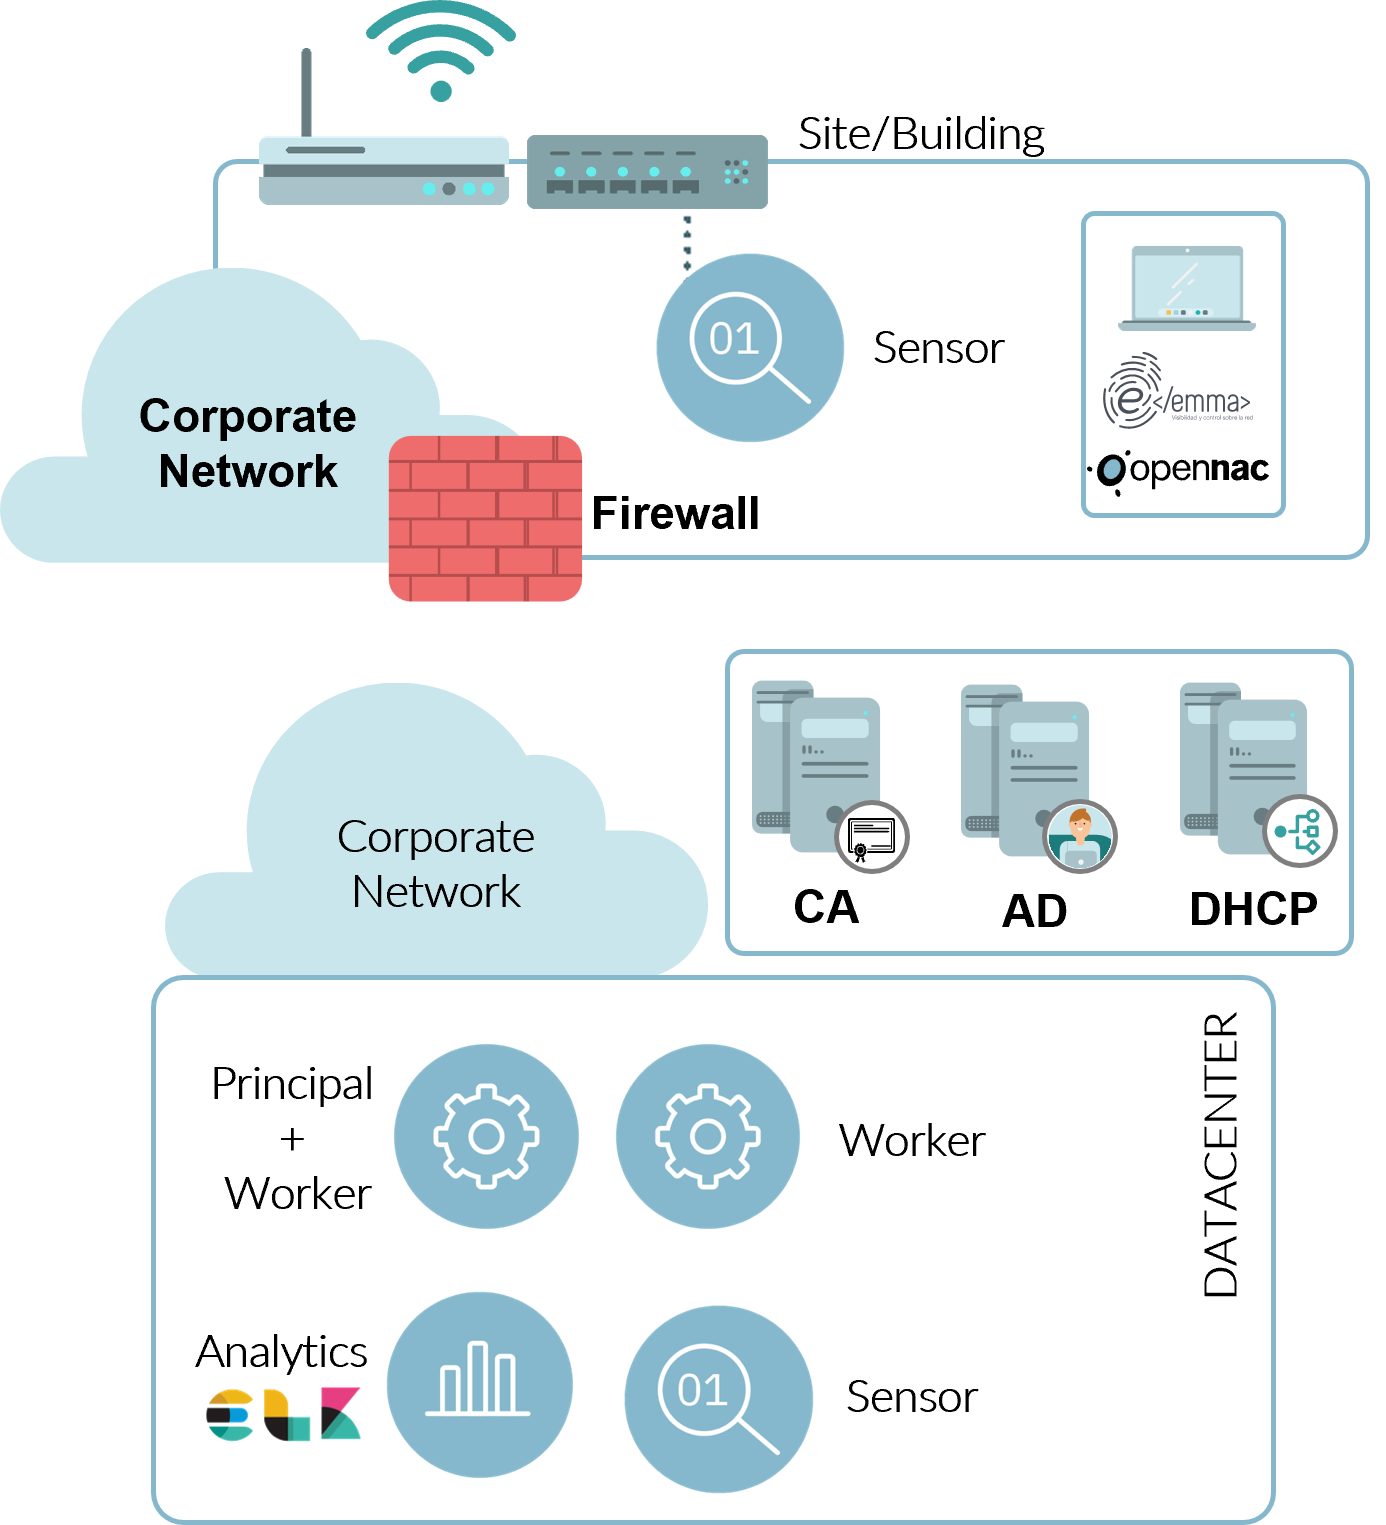
Not recommended, it does not follow the defined standards of architecture and service availability.
Small clients, with less than 5.000 concurrent devices.
Approximately all the service will be provided by the Worker and in specific cases or in cases of high availability, the Principal will assume the functions of Worker.