3.1.12.2.5. Profiling Metrics
The Profiling Metrics dashboard presents device tag metrics to enhance device profiling capabilities.
We can see the following views on this dashboard, starting from the header:
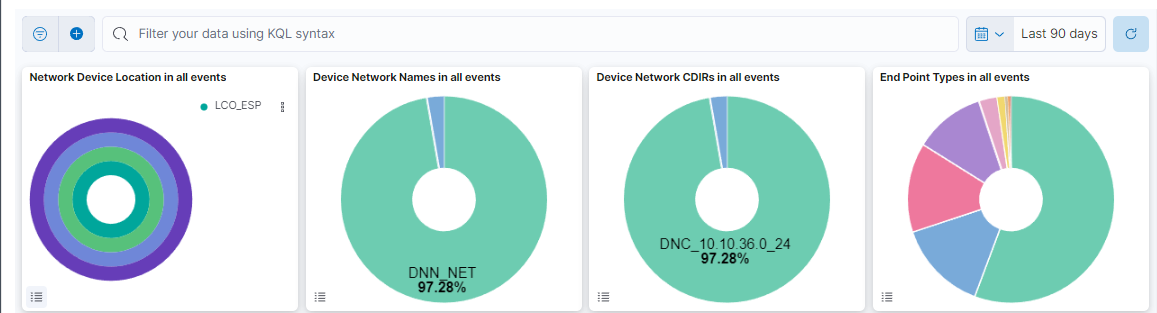
This header composed of four dashboards allows filtering by Network Device Location, Device Network Name, Device Network CDIRs, Endpoint Types. It will always look for the temporary index that is regenerated every day. In this toolbar, filter your data using KQL syntax.
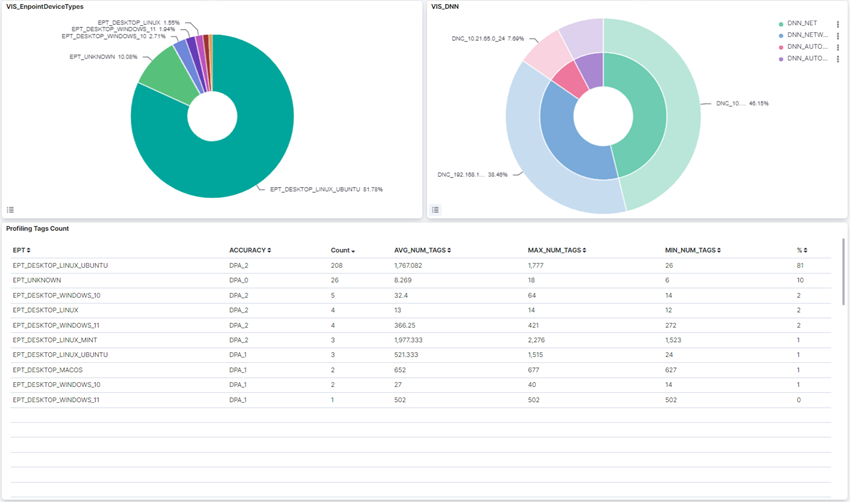
VIS_EndpointDevice_Types: A pie chart that shows the percentage of each EPT.
VIS_DNN: A pie chart that shows each subnet information with the DNN and DNC tags.
Profiling Tags Count: A table that shows information about each EPT: count, percentage, accuracy (TAG DPA), minimum number, average, and a maximum of TAGs.
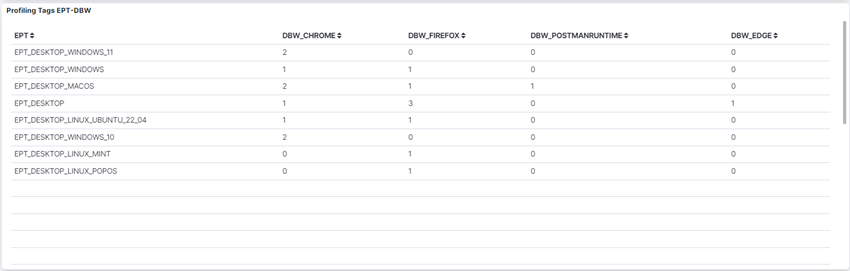
Profiling Tags EPT-DBW: A table that shows the tag account of DBW (device browser) tags by EPT.
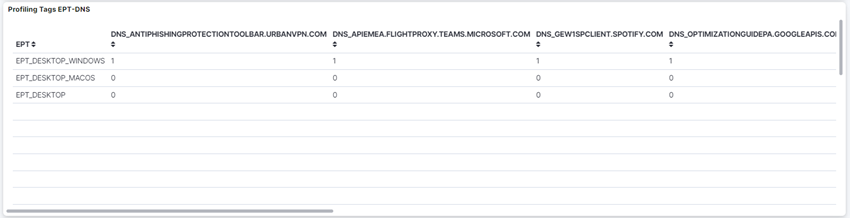
Profiling Tags EPT-DNS: A table that shows the tag account of DNS (DNS queries) tags by EPT.
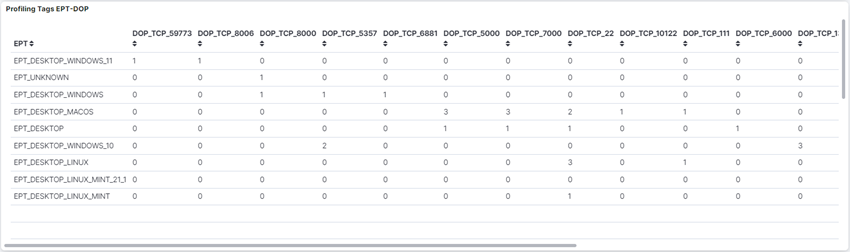
Profiling Tags EPT-DOP: A table that shows the tag account of DOP (device open port) tags by EPT.
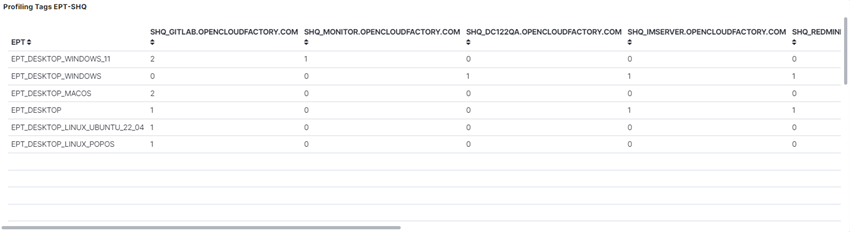
Profiling Tags EPT-SHQ: A table that shows the tag account of SHQ (SSL hostname query) tags by EPT.