3.1.12.3.2. UNAC Detail
Following the drill-down approach of the UNAC section, the UNAC Details dashboard displays detailed information about User Devices.
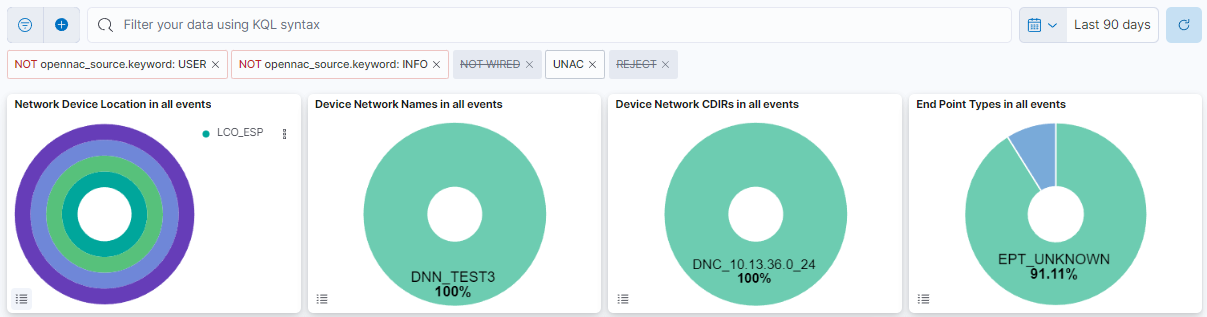
This header composed of four dashboards allows filtering by Network Device Location, Device Network Name, Device Network CDIRs, Endpoint Types. It will always look for the temporary index that is regenerated every day.
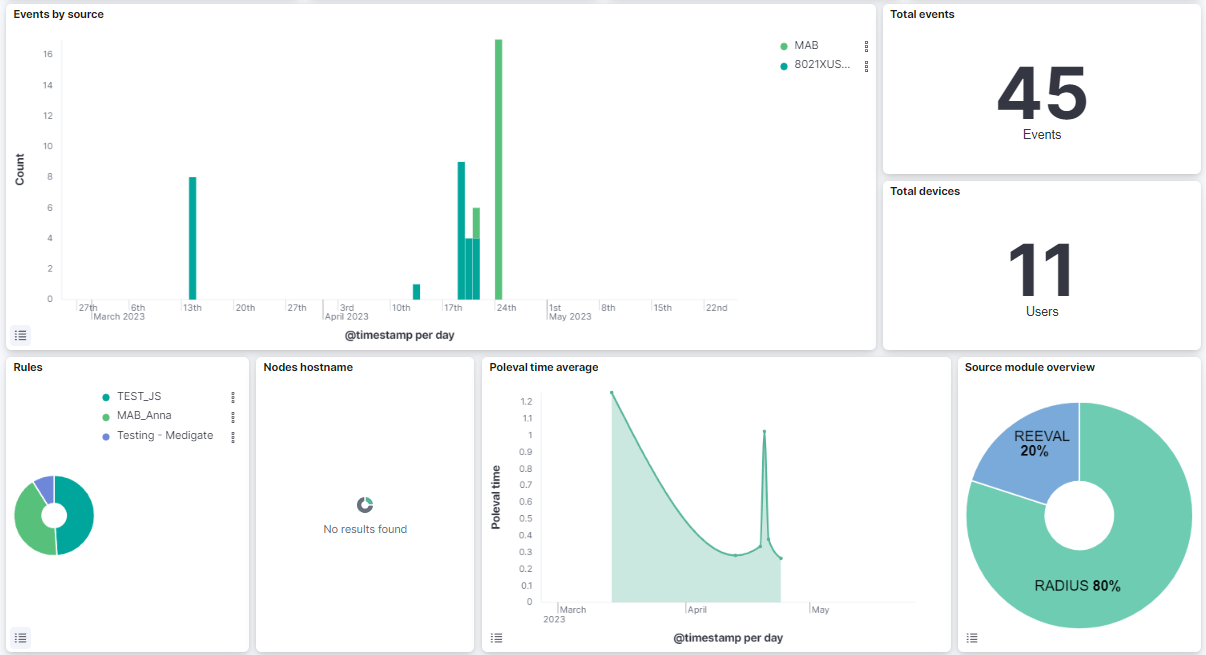
Events by source: The overtime events by source (SNP, 8021XUSER, IP, VPN)
Total events: The total number of opennac events.
Total devices: The total number devices that generate opennac events.
Rules: A pie chart showing the policies of the user devices.
Nodes hostname: A pie chart showing the hostnames of the farm nodes.
Poleval time average: A timestamp that shows the poleval time average.
Source Module overview: A pie chart showing the source module.
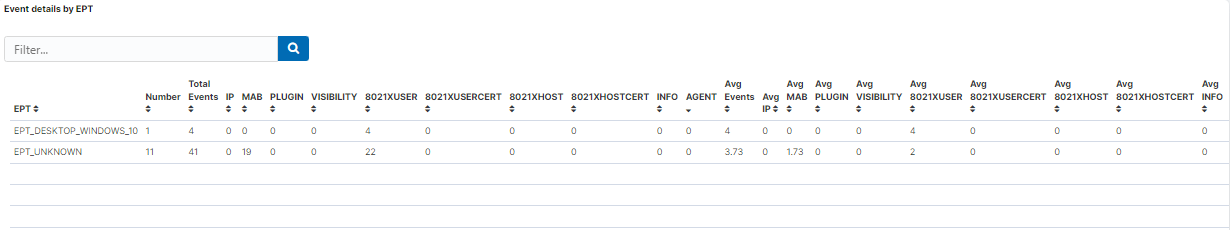
Event details by EPT: A table that shows the details of each event by EPT (number of events, source, etc).
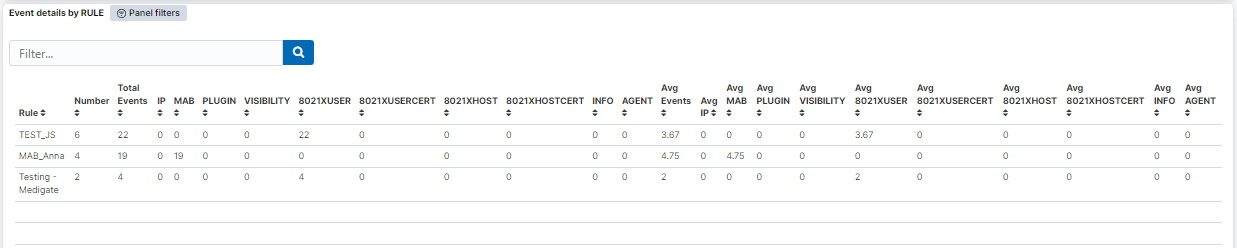
Event details by RULE: A table that shows the details of the events by policy.
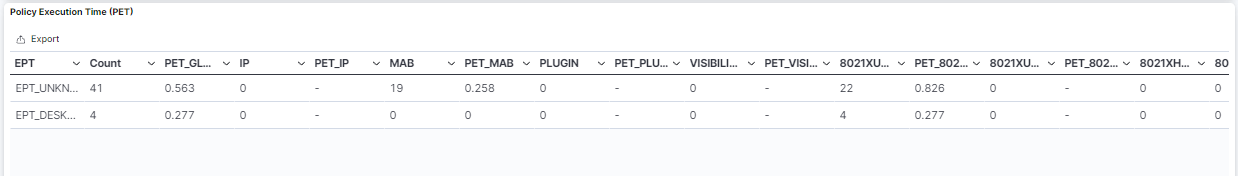
Policy Execution Time (PET): A table that shows the poleval execution time.