8.4.4. CMI Logs
Within the CMI node we can find a large number of logs that can help us understand or detect errors that may arise during system operation.
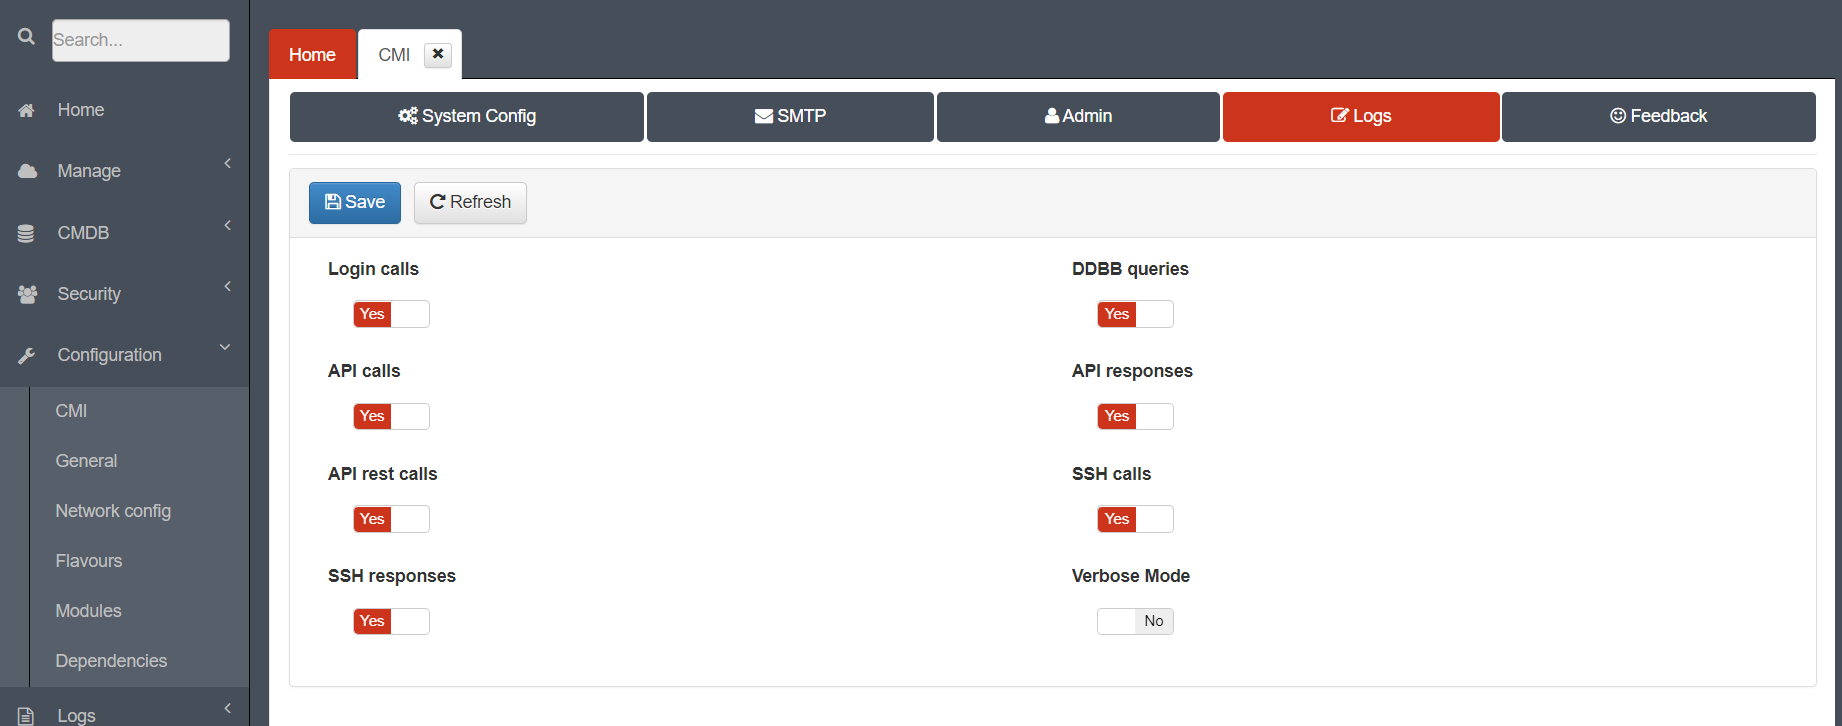
In case the desired modules are not being achieved, we can activate/deactivate the logs in the CMI configuration portal “Configuration -> General -> Logs”:
The main logs to take into account in the CMI node are:
8.4.4.1. cmi-api.log
This log contains information related to the requests made against the API.
Path:
/var/log/viapps/cmi-api.log
Example:
2022-09-01 15:28:03 NOTICE: [91a6][MEM:8993872] 401 Authentication required
Exception: Array
(
    [message] => Authentication required
    [stacktrace] => #0 /usr/share/cmi-api/library/Common/AuthPlugin.php(75): Common_AuthPlugin->createError(Object(Zend_Controller_Request_Http))
8.4.4.2. cmi-audit.log
This log contains information related to the changes/actions performed by a user through the CMI’s Administration Portal.
Path:
/var/log/viapps/cmi-audit.log
Example:
2022-09-01 15:00:10 INFO (6): UserId=crontab-437b748fefe2ab Update APPLIANCES item={"CUSTOMRSAKEYFLAG":0,"NAME":"fw03lab.viapps.org","DESCRIPTION":"FW WireGuard Bis","FARM":"virtp07","IP":"10.250.102.107","IPMANAGEMENT":"10.250.102.107","FLAVOURSID":"1","STATUSID":"9","STEPSTATUSID":"1","UPDATESTATUSID":0,"SSH_USER":null,"RSA_KEY_ID":"0","MESSAGE":"VAPP scripts copied to client.","OWNER":"admin","VERSION":"1.6.0-23.7268","URI":"https:\/\/10.250.102.107:10443\/cmix-api","TOKEN":"fw03lab.viapps.org_620ce7fa2064d","MAIL":"","AUTOMODE":0,"ENABLED_STATS":0,"ENABLED_ELASTICSEARCH":0,"MODIFIED":"2022-09-01 15:00:10","MODIFIED_BY":"crontab-437b748fefe2ab"}
8.4.4.3. cmi-check.log
Path:
/var/log/viapps/cmi-check.log
Example:
ERROR 1045 (28000): Access denied for user '-p'@'localhost' (using password: NO)
8.4.4.4. cmi-portal.log
This log contains information related to the Administration Portal’s application.
Path:
/var/log/viapps/cmi-portal.log
Example:
2022-09-01 02:54:42 ERR (3): Common_Api call to GET https://localhost/cmi-api/dbdelta/?count failed, status: 401
2022-09-01 02:54:45 NOTICE (5): Exception caught: Invalid controller specified (evox)
2022-09-01 02:54:45 NOTICE (5): Request Parameters: Array
(
    [controller] => evox
    [action] => about
    [module] => default
)
8.4.4.5. cmi-scheduler.log
Path:
/var/log/viapps/cmi-scheduler.log
Example:
2022-09-01 03:31:02 INFO (6): checking cron jobs...
2022-09-01 03:32:02 INFO (6): checking cron jobs...
2022-09-01 03:33:01 INFO (6): checking cron jobs...
8.4.4.6. cmi-portal-access_log
This log contains information related to the CMI Administration Portal’s application.
Path:
/var/log/httpd/cmi-portal-access_log
Example:
127.0.0.1 - - [01/Sep/2022:15:48:03 +0200] "GET /cmi-api/logical-cluster-status HTTP/1.1" 401 54
127.0.0.1 - - [01/Sep/2022:15:49:02 +0200] "GET /cmi-api/logical-cluster HTTP/1.1" 401 54
127.0.0.1 - - [01/Sep/2022:15:49:02 +0200] "GET /cmi-api/logical-cluster-status HTTP/1.1" 401 54
8.4.4.7. cmi-portal-error_log
This log contains information related to the errors based on CMI Administration Portal’s application.
Path:
/var/log/httpd/cmi-portal-error_log
Example:
[Thu Sep 01 03:33:27.074155 2022] [ssl:warn] [pid 815] AH01906: RSA server certificate is a CA certificate (BasicConstraints: CA == TRUE !?)
[Thu Sep 01 03:33:27.074285 2022] [ssl:warn] [pid 815] AH01909: RSA certificate configured for cmi-portal:443 does NOT include an ID which matches the server name
8.4.4.8. error_log
This log contains the apache error information related to the admonportal.
Path:
/var/log/httpd/error_log
Example:
[Thu Sep 01 15:17:59.356703 2022] [core:warn] [pid 815] (101)Network is unreachable: AH00056: connect to listener on [::]:80
[Thu Sep 01 15:18:00.357681 2022] [core:warn] [pid 815] (101)Network is unreachable: AH00056: connect to listener on [::]:80
[Thu Sep 01 15:18:01.358760 2022] [core:warn] [pid 815] (101)Network is unreachable: AH00056: connect to listener on [::]:80
8.4.4.9. repo-access_log
This log contains the apache error information related to the repo.
Path:
/var/log/httpd/repo-access_log
Example:
127.0.0.1 - - [01/Sep/2022:15:48:02 +0200] "GET /repo/x86_64/ HTTP/1.1" 200 1129619
127.0.0.1 - - [01/Sep/2022:15:49:01 +0200] "GET /repo/x86_64 HTTP/1.1" 301 237
127.0.0.1 - - [01/Sep/2022:15:49:01 +0200] "GET /repo/x86_64/ HTTP/1.1" 200 1129619
8.4.4.10. mariadb.log
This log contains all the information related to mysql’s service operation. For example, replication files could not be found, or if there is not enough memory available for the service to start or work properly. This information can be found in the file /etc/my.cnf .
Path:
/var/log/mariadb/mariadb.log
Example:
200305 12:48:26 mysqld_safe Starting mysqld daemon with databases from /var/lib/mysql
200305 12:48:26  InnoDB: Initializing buffer pool, size = 2.0G
8.4.4.11. messages.log
This log contains global system messages such as the system error messages, system startups and shutdowns, change in the network configuration, etc.
Path:
/var/log/messages
Example:
Mar  8 06:26:01 LAB0oncore auditd[1432]: Audit daemon rotating log files
Mar  8 06:40:09 LAB0oncore named[1531]: managed-keys-zone ./IN/registry: Failed to create fetch for DNSKEY update
8.4.4.12. curator.log
This log contains information about the curator service, that deletes Elasticsearch indexes after defined intervals of time.
Path:
/var/log/curator/curator.log
Example:
2022-08-29 12:00:04,302 INFO      Action ID: 9, "delete_indices" completed.
2022-08-29 12:00:04,302 INFO      Preparing Action ID: 10, "delete_indices"
2022-08-29 12:00:04,303 INFO      Creating client object and testing connection
2022-08-29 12:00:04,303 INFO      Instantiating client object
2022-08-29 12:00:04,304 INFO      Testing client connectivity
2022-08-29 12:00:04,307 INFO      Successfully created Elasticsearch client object with provided settings
2022-08-29 12:00:04,310 INFO      Trying Action ID: 10, "delete_indices": Delete tm-* > 7 days.
2022-08-29 12:00:04,438 INFO      Skipping action "delete_indices" due to empty list: <class 'curator.exceptions.NoIndices'>
2022-08-29 12:00:04,438 INFO      Action ID: 10, "delete_indices" completed.
2022-08-29 12:00:04,439 INFO      Job completed.
8.4.4.13. elasticsearch.log
This logs shows information about the Elasticsearch service and the different problems with the data storing into indexes.
Path:
/var/log/elasticsearch/elasticsearch.log
Example:
[2022-08-29T02:00:13,160][INFO ][o.e.c.r.a.AllocationService] [12-analytics-02] Cluster health status changed from [YELLOW] to [GREEN] (reason: [shards started [[opennac-2022.08.29][0]] ...]).
[2022-08-29T02:00:13,205][INFO ][o.e.c.m.MetaDataMappingService] [12-analytics-02] [opennac-2022.08.29/FXauSlwIQCadcPWWcyjGBw] update_mapping [_doc]
[2022-08-29T02:02:27,432][INFO ][o.e.c.m.MetaDataCreateIndexService] [12-analytics-02] [bro-2022.08.29] creating index, cause [auto(bulk api)], templates [bro, default], shards [1]/[0], mappings [_doc]
[2022-08-29T02:02:27,573][INFO ][o.e.c.r.a.AllocationService] [12-analytics-02] Cluster health status changed from [YELLOW] to [GREEN] (reason: [shards started [[bro-2022.08.29][0]] ...]).
[2022-08-29T02:02:27,669][INFO ][o.e.c.m.MetaDataMappingService] [12-analytics-02] [bro-2022.08.29/PhGoYPrDRmy6XEAt4WCwVg] update_mapping [_doc]
8.4.4.14. logstash-plain.log
This logs shows information about the Logstash service and the different problems with the data ingestion to Elasticsearch.
Path:
/var/log/logstash/logstash-plain.log
Example:
[2022-08-29T10:02:48,635][INFO ][logstash.javapipeline    ] Starting pipeline {:pipeline_id=>"main", "pipeline.workers"=>2, "pipeline.batch.size"=>125, "pipeline.batch.delay"=>50, "pipeline.max_inflight"=>250, :thread=>"#<Thread:0x3b48f94d run>"}
[2022-08-29T10:02:50,666][INFO ][logstash.inputs.beats    ] Beats inputs: Starting input listener {:address=>"0.0.0.0:5000"}
[2022-08-29T10:02:50,681][INFO ][logstash.inputs.beats    ] Beats inputs: Starting input listener {:address=>"0.0.0.0:5001"}
[2022-08-29T10:02:51,456][INFO ][logstash.javapipeline    ] Pipeline started {"pipeline.id"=>"main"}
[2022-08-29T10:02:51,552][INFO ][org.logstash.beats.Server] Starting server on port: 5000
[2022-08-29T10:02:51,646][INFO ][logstash.inputs.tcp      ] Starting tcp input listener {:address=>"0.0.0.0:5002", :ssl_enable=>"false"}
[2022-08-29T10:02:51,703][INFO ][org.logstash.beats.Server] Starting server on port: 5001
[2022-08-29T10:02:51,804][INFO ][logstash.agent           ] Pipelines running {:count=>1, :running_pipelines=>[:main], :non_running_pipelines=>[]}
[2022-08-29T10:02:52,891][INFO ][logstash.agent           ] Successfully started Logstash API endpoint {:port=>9600}
[2022-08-29T10:04:04,527][WARN ][logstash.outputs.elasticsearch] Could not index event to Elasticsearch. {:status=>400, :action=>["update", {:_id=>"7131054132030345254", :_index=>"opennac_ud", :_type=>"_doc", :routing=>nil, :retry_on_conflict=>3}, #<LogStash::Event:0x47623084>], :response=>{"update"=>{"_index"=>"opennac_ud", "_type"=>"_doc", "_id"=>"7131054132030345254", "status"=>400, "error"=>{"type"=>"illegal_argument_exception", "reason"=>"Limit of total fields [2000] in index [opennac_ud] has been exceeded"}}}}
8.4.4.15. yum.log
This log contains information related to the update process.
Path:
/var/log/yum.log
May 26 16:31:35 Updated: 1:java-1.8.0-openjdk-devel-1.8.0.332.b09-1.el7_9.x86_64
May 26 16:31:36 Updated: 32:bind-export-libs-9.11.4-26.P2.el7_9.9.x86_64
May 26 16:31:36 Updated: gtk-update-icon-cache-3.22.30-8.el7_9.x86_64
May 26 16:31:36 Updated: python-perf-3.10.0-1160.66.1.el7.x86_64
May 26 16:31:36 Updated: 14:libpcap-1.5.3-13.el7_9.x86_64
May 26 16:31:37 Updated: gzip-1.5-11.el7_9.x86_64
May 26 16:31:43 Installed: kernel-3.10.0-1160.66.1.el7.x86_64
May 30 12:56:00 Installed: cmix-fw_openvpn_radiusplugin_opennac-1.6.0-23.7267.SVN.el7.x86_64