3.6. HA in ELK Cluster
3.6.1. Introduction
In this section, we are going to see how to configure a high availability ELK cluster. Following this guide will ensure data conservation even in the case of losing cluster servers.
3.6.1.1. ELK services
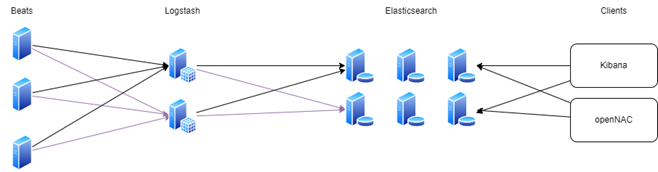
The ELK services that run in our architectures are the following:
Beats: open source data shippers that you install as agents on your servers to send operational data to Elasticsearch. Beats can send data directly to Elasticsearch or via Logstash, where you can further process and enhance the data, before visualizing it in Kibana.
Logstash: open source data collection engine with real-time pipelining capabilities. Logstash can dynamically unify data from disparate sources and normalize the data into destinations of your choice. Cleanse and democratize all your data for diverse advanced downstream analytics and visualization use cases.
Elasticsearch: the distributed search and analytics engine at the heart of the Elastic Stack. Logstash and Beats facilitate collecting, aggregating, and enriching your data and storing it in Elasticsearch.
Kibana: Kibana enables you to give shape to your data and navigate the Elastic Stack. With Kibana, you can:
Search, observe, and protect your data. From discovering documents to analyzing logs to finding security vulnerabilities, Kibana is your portal for accessing these capabilities and more.
Analyses your data. Search for hidden insights, visualize what you’ve found in charts, gauges, maps, graphs, and more, and combine them in a dashboard.
Manage, monitor, and secure the Elastic Stack. Manage your data, monitor the health of your Elastic Stack cluster, and control which users have access to which features.
3.6.1.2. ELK component
Oncore: Provides the administration console, where the policy engine and the compliance rules engine reside. It can take 4 different roles:
Onprincipal
Onsecondary
Onworker
Onproxy
In all the oncore roles the Beats service is running, getting some relevant logs and sending them to Logstash.
Onaggregator: Provides the enrichment of all the information generated by any component of OpenNAC Enterprise. This is provided by Logstash filters, that enrich the logs that arrives from the Beats and send them to Elasticsearch.
Onanalytics: Provides search engine, based on Elasticsearch engine that allows you to easily search the information generated and collected by the OpenNAC Enterprise components. It also provides dashboards and reports using Kibana, that can be accessed from OpenNAC in the Analytics module. You can create and generate your own custom dashboards.
Onsensor: It processes the traffic generated in the network and using Beats sends it to Logstash.
Note
Onaggregator and onanalytics roles can be in the same server, but when we want to have high availability, we need to consider them as two separate servers.
3.6.1.3. ELK flow
In the architectures with our components, we can find the following flow:
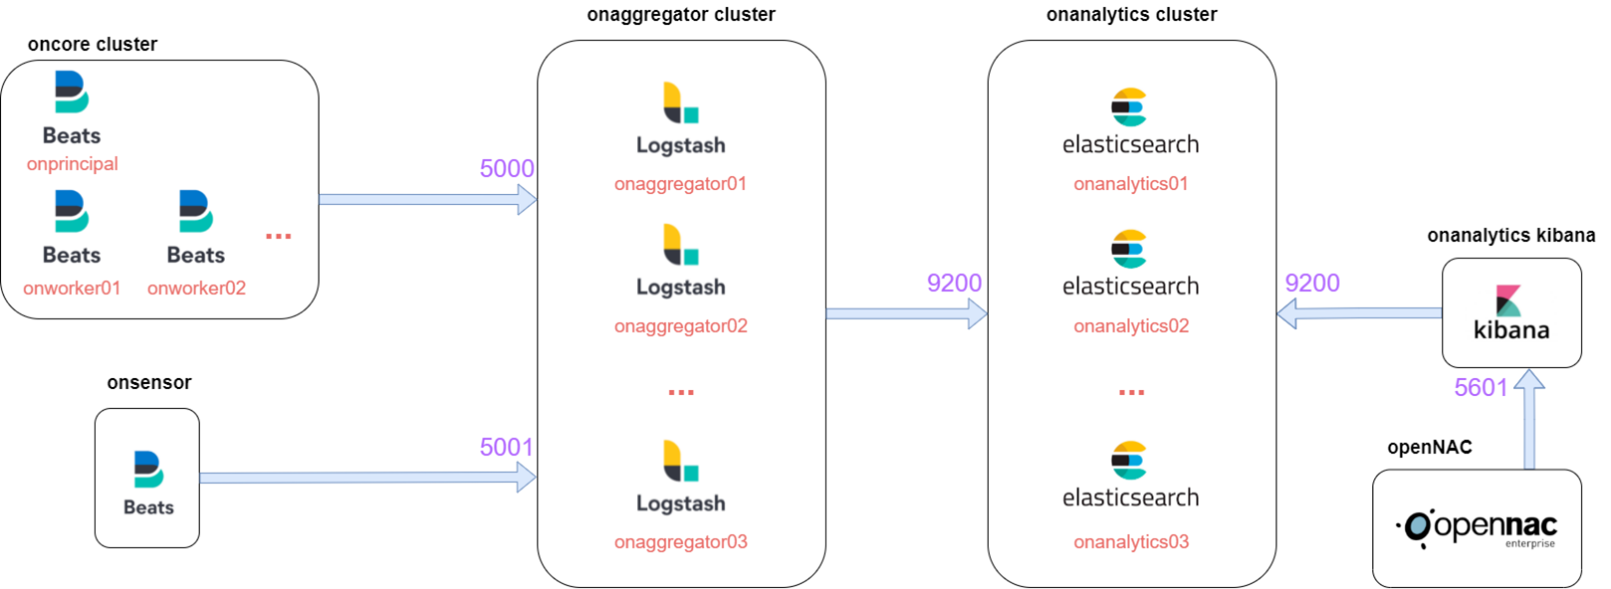
The components of oncore and onsensor contain the Beats, that will send the logs to Logstash situated at onaggregator on the ports 5000 and 5001.
Then, Logstash will enrich the logs and send them to the onanalytics cluster where there is the Elasticsearch cluster on port 9200.
Finally, Kibana connects to Elasticsearch cluster on port 9200 to get the data and provide dashboards, and OpenNAC connects to Kibana on port 5601 to represent the dashboards on its menu.
Note
It is important to keep this flow in mind when performing troubleshooting.
3.6.2. Components /etc/hosts
It is necessary to configure on the /etc/hosts of every component the different IPs associated with their role on the network. To do that, we need to edit the following file:
vi /etc/hosts
Every /etc/hosts needs to have all the network components added in the following format:
####################################################
# Hostname Guide
#
# The following is the structure that must be used
# when defining the different hostnames
#
# ON Core
# * Principal -> onprincipal
#
# ON Core (clustered)
# * Principal -> onprincipal
# * Secondary (Prin. Backup) -> onsecondary
# * Workers -> onworkerNN
# * Proxy -> onproxy
#
# ON Analytics
# * ON Analytics (single) -> onanalytics
# * ON Analytics (multiple) -> onanalyticsNN
#
# ON Aggregator
# * ON Aggregator (single) -> onaggregator
# * ON Aggregator (multiple) -> onaggregatorNN
#
# ON Sensor
# * ON Sensor (single) -> onsensor
# * ON Sensor (multiple) -> onsensorNN
#
# Cloud Deployment
# * <hostname>-<region>-<zone>
# * Example: onprincipal-westus-1
####################################################
It also needs to have the localhost configured for IPv4 and IPv6.
127.0.0.1    localhost localhost.localdomain localhost4 localhost4.localdomain4
::1          localhost localhost.localdomain localhost6 localhost6.localdomain6
127.0.0.1    {{ component_role }}
For example, a onprincipal /etc/hosts should look like the following:
127.0.0.1    localhost localhost.localdomain localhost4 localhost4.localdomain4
::1          localhost localhost.localdomain localhost6 localhost6.localdomain6
127.0.0.1    onprincipal
192.168.69.101    onprincipal oncore
192.168.69.103    onworker
192.168.69.102    onproxy
192.168.69.107    onaggregator
192.168.69.104    onanalytics01
192.168.69.105    onanalytics02
192.168.69.106    onanalytics03
192.168.69.122    onsensor
3.6.3. Beats HA
The Beats service running in oncore and onsensor is Filebeat. Filebeat is configured at oncores clusters and at onsensors to send the logs file that we want to parse to Logstash on onaggregators.
To have HA and load balance the traffic, we need to add the following lines:
In the case of oncore:
output.logstash:
  enabled: true
  hosts: ["onaggregator01:5000","onaggregator02:5000"]
  loadbalance: true
  timeout: 300
  bulk_max_size: 100
In the case of onsensor:
output.logstash:
  enabled: true
  hosts: ["onaggregator01:5001","onaggregator02:5001"]
  loadbalance: true
  timeout: 300
  bulk_max_size: 512
3.6.3.1. Iptables
The are some iptables needed for ELK communication at oncore. We need to edit the file:
vi /etc/sysconfig/iptables
Logstash filters, make some Redis requests to the oncore for enrich with OpenNAC Enterprise information some logs. That is why we need to allow the access to oncores Redis for all the onaggregators in the network.
-A INPUT -s {{ onaggregatorXX_ip }} -p tcp -m state --state NEW -m tcp --dport 6379 -j ACCEPT
It is necessary to restart the following services:
systemctl restart iptables
3.6.4. Logstash HA
Logstash service is running in onaggregator component. It will receive the data logs from the Beats, and it will filter and enrich them. Then, it will send them to Elasticsearch to store them.
By default, all the elasticsearch output plugins in Logstash are configured to send information to only one specific onanalytics:
elasticsearch {
    hosts => ["onanalytics:9200”]
    index => "radius-%{+YYYY.MM.dd}"
}
To configure the HA and load balance the output sent to Elasticsearch, it’s necessary to add all the onanalytics that we want to load balance.
elasticsearch {
    hosts => ["onanalytics01:9200","onanalytics02:9200"]
    index => "radius-%{+YYYY.MM.dd}"
}
For do that automatically, we need to change the variable OPENNAC_ES_HOSTS.
vi /etc/default/opennac
We need to add all the different onanalytics we have with the format specified:
#This parameter is only used on packet updates. The format for multiple hosts is '"onanalytics01:9200","onanalytics02:9200","etc"'
OPENNAC_ES_HOSTS='"onanalytics01:9200","onanalytics02:9200"'
To change the new configuration in the logstash file, we need to execute the following command.
yes | cp /usr/share/opennac/analytics/logstash/conf.d/999_output.conf /etc/logstash/conf.d/999_output.conf
eshosts=$(grep OPENNAC_ES_HOSTS /etc/default/opennac | awk -F"=" '{print $2}' | sed "s_'__g")
sed -i "s/#OPENNAC_ES_HOSTS#/${eshosts}/" /etc/logstash/conf.d/*.conf
Finally, we need to restart the logstash service:
systemctl restart logstash
3.6.4.1. Iptables
The are some iptables needed for ELK communication at onaggregator. We need to edit the file:
vi /etc/sysconfig/iptables
The different Beats on the network will access Logstash on ports 5000,5001 and 5002 (if it comes from rsyslog). So, it is necessary to add the following lines
-A INPUT -s {{ oncoreXX_ip }} -p tcp -m state --state NEW -m tcp --dport 5000 -j ACCEPT
-A INPUT -s {{ onsensorXX_ip }} -p tcp -m state --state NEW -m tcp --dport 5001 -j ACCEPT
-A INPUT -p tcp -m state --state NEW -m tcp --dport 5002 -j ACCEPT
It is necessary to restart the service:
systemctl restart iptables
3.6.5. Elasticsearch HA
Normally, ON Analytics clusters are configured without an aggregator, so we must first configure the analytics without an aggregator.
A cluster is a collection of connected nodes identified by its cluster name. Each node in a cluster knows about the other nodes. Each node can accept a client request and forward that to the appropriate node.
It is important to have a resilient cluster, that permits a redundant cluster. If a node is down, the replicas for the primaries in that node are promoted in the nodes that are up, and other replicas are created.
To have a resilient cluster we need the following:
At least three master nodes
At least two nodes of each role
At least one replica per primary shard
A node is a single Elasticsearch instance composed of compute and disk.
It can take multiple roles. The most important roles are:
Master-eligible node: A node that has the master role, which makes it eligible to be elected as the master node, which controls the cluster. This role is in charge with the following actions in the cluster:
Cluster settings
Deleting or creating indices and settings
Adding or removing nodes
Shard allocation to the notes
Data node: A node that has the data role. Data nodes hold data and perform data-related operations such as CRUD, search, and aggregations. A node with the data role can fill any of the specialized data node roles.
Ingest node: A node that has the ingest role. Ingest nodes can apply an ingest pipeline to a document in order to transform and enrich the document before indexing. With a heavy ingest load, it makes sense to use dedicated ingest nodes to not include the ingest role from nodes that have master or data roles.
Small clusters allow some nodes to be assigned as data and master roles at the same time. Instead, large clusters need to have dedicated master nodes and data nodes separated. The dedicated masters don’t need to have the same computing resources as the data nodes.
An index is used to store JSON documents in dedicated data structures corresponding to the data type of fields. An Elasticsearch index is divided into shards.
A shard stores data from an index. We can find two types of shards:
Primary shard: Data that is used by elastic to search.
Replica shard: Replications of primary shards in other nodes. Elasticsearch takes care of promoting replicas to primary.
3.6.5.1. Cluster Sizing
The number of nodes is unlimited, it can go through the next range:
1 <= Number of nodes <= no_limit
The characteristics of a large cluster (> 100 nodes) are the following:
More searchable data.
Larger cluster state
Harder for the master to manage
More operational issues
We need to consider the number of shards for our indices. As more primary shards, the consequences are the following:
More parallelism
Faster indexing performance
A bit slower search performance
Our shard should aim for a size between 10 GB and 50 GB. It is recommended 25 GB for search use cases. Larger shards make the cluster less likely to recover from failure (harder to move when a node is going under maintenance).
We also should aim for 20 shards or fewer per GB of heap memory. For example, a node with 30GB of heap memory should have at most 600 shards.
To calculate the number of shards for our indices we can use the following formula:
Number of shards = (index_data + data_to_grow) x (1 + 10% indexing overhead) / desired_shard_size
To calculate the minimum storage required we can use the following formula:
Minimum number required = (index_data ) x (1 + number_replicas) x 1.45
For a cluster handling complex aggregations, search queries, high throughout and frequent updates, the node config should have 2 vCPUs cores, and 8 GB of memory for every 100 GB of storage.
It is necessary to set the elastic search node JVM heap size to no more than 50% (32 GB max) of the physical memory of the backing node.
For example, let’s assume that we have 150 GB of existing data to be indexed.
Number of shards (starting from scratch or no growth)= (150+0) x (1.10) / 25 =~ 7 shards
Number of shards (with 100% growth in a year)= (150+150) x (1.10) / 25 =~ 13 shards
Going with the minimum 3 nodes (master + data). Assuming we would have 1 replica per shard.
Minimum number required = 150 x (1 + 1) x 1.45 = 435 GB of total disk space
Compute and Memory = 435 x (2 vCPUs and 8 GB memory) / 100 = 9 vCPUs and 34.8 GB of memory.
In conclusion, we are going to need 3 nodes each having 3vCPUs, 12 GB of memory, and 150 GB of disk storage. With 12 GB of memory, you can set the JVM heap size to 6 GB (max 120 shards per node, 360 shards in total).
3.6.5.2. Cluster architecture
Before seeing different examples of the elastic cluster, we need to know that to not lose data, the minimum number of nodes required are three. That is why two analytics should not be deployed in clients.
The cluster architecture will depend on the number of analytics we want to have on our cluster, if we need or no high availability (HA), and the number of zones we are going to have. The zones are used to define groups of nodes, which can fail all together. Example, imagine you have two data centers, if a data center goes down, you want the other data center to have at least one copy of each shard. With the zones, you can achieve this.
In the following table, we can see the main characteristics of a cluster depending on the number of analytics.
Analytics |
When? |
HA |
Zones |
Replicas |
Shards |
|---|---|---|---|---|---|
1 |
Client that does not need HA |
No |
No zones |
0 |
1 |
2 |
DO NOT USE |
No |
No zones |
0 |
C1 && C2 |
3 |
Clients with just one sites |
Yes |
No zones |
1 |
C1 && C2 |
4 |
Clients with two sites |
Yes |
2 zones |
1 |
C1 && C2 |
5 |
Clients with two sites |
Yes |
2 zones |
1 |
C1 && C2 |
6 |
Clients with two sites or three |
Yes |
2 or 3 zones |
1 or 2 |
C1 && C2 |
… |
More than two sites |
Yes |
corresponding to sites |
replicas = sites |
C1 && C2 |
Note
The number of replicas can be adjusted to clients preferences.
Shards conditions:
C1 = DS * NA - (INDX1 + INDX2 + INDX3 …) > 0
C2 = MAX(INDX{N}) / NS < DS
Where:
DS= Disk space for one node
NS= Number of shards
NA= Number of analytics
INDX{N}= Elastic indexes size
C{N} = Conditions
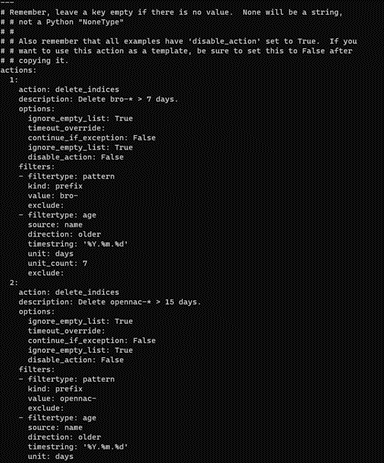
Given the above conditions, we need to adjust the onanalytics curator to prevent the sum of the index sizes from exceeding 85% of the disk space. If this happens, the indexes will enter the read_only state and no information will be ingested into Elasticsearch until the following script located in onanalytics is executed:
/usr/share/opennac/analytics/scripts/read_only.sh
To adjust the index curator, we need to change the days they will be remaining on the disk. To do that, it is necessary to change the following file:
/etc/elastCurator/action.yaml
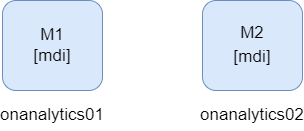
3.6.5.2.1. One analytics
In this case, we only have one Elasticsearch node, so all the information will be ingested in it.

* mdi = master, data and ingest roles
If the onanalytics fall, data will be lost because it would not be ingested.
This kind of architecture does not follow the cluster configuration. The default configuration should be valid. We only need to correctly configure the following parameter.
vi /etc/elasticsearch/elasticsearch.yml
Put the onanalytics IP.
cluster.initial_master_nodes: ["10.10.36.175"]
3.6.5.2.2. Two analytics
2 nodes 1 replica
Warning
Do not use it on clients.
In this case we can find a cluster with two nodes. The two nodes have data, master and ingest roles. What is necessary in these cases, is to configure one replica to always have a backup shard.
* mdi = master, data and ingest roles
It is not recommended to have only two nodes. Imagine that onanalytics01 is the master elected. If onanalytics02 falls, the shards would be promoted, and the cluster will work correctly without data loss. But, if the node that falls is the master elected, in this case onanalytics01, the cluster will fall because the onanalytics02 would not have any other active master to do a master election. In this second case, the data ingested when the cluster is down, will be lost.
2 nodes 1 replica with a tiebreaker
Warning
If it is possible, use example 3.
In this case we can find the same scenario as in the Example 1. The difference is that we have a master voting that will help us keep the cluster up when a node fails. This will avoid data loss.
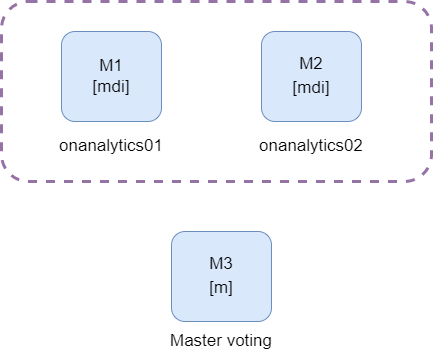
* mdi = master, data and ingest roles
3.6.5.2.3. Three analytics
In this case, we can find a cluster with three nodes. The three nodes have data, master and ingest roles. What is necessary in these cases, is to configure one replica to always have a backup shard.
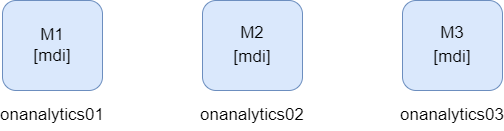
* mdi = master, data and ingest roles
In this case, if one node falls, there would be two master up, so the data will not be lost and the cluster would not fall down.
3.6.5.2.4. Four analytics
The minimum number of analytics to have a multizone cluster is 4. In this case we can find two zones with two master nodes each.
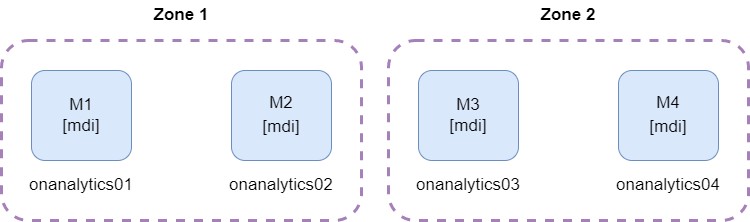
* mdi = master, data and ingest roles
If one of the zones fall down, we will have the other zone with two masters, so it will be possible to do the master election and the cluster will continue up.
3.6.5.2.5. Five analytics
In this case, we can find two zones with two masters each, and one data node in one of the zones. One zone will have more disk space than the other.
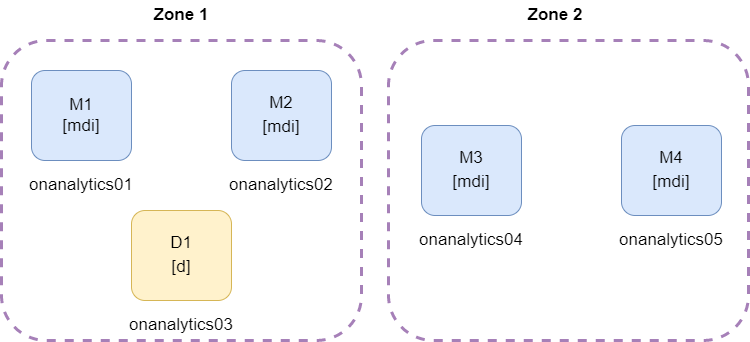
* mdi = master, data and ingest roles
The necessary disk space must be considered, because if the zone with three nodes falls, the zone with two nodes must have enough capacity to store all the information.
3.6.5.2.6. Six analytics
2 zones with 3 nodes
In this example, we can see two different zones. It is recommended to separate the elastic nodes in zones when they are connected to different network devices. When one device of the zone gets down, it is possible that all the nodes for that zone are offline.
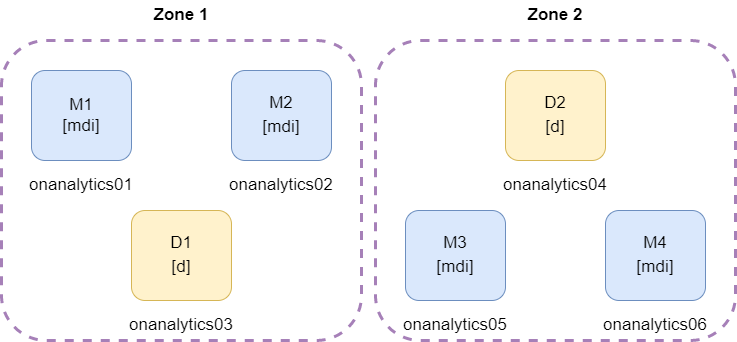
* mdi = master, data and ingest roles
It is necessary to have two masters for every zone because if one zone falls, the other zone conserve two master nodes and the cluster continue up.
2 zones with 3 nodes and 1 voting master
In this example, every zone has one master, and there is a third node, that has another master node. This third zone helps to avoid cluster failure when one zone comes down, because the cluster conserve two active masters.
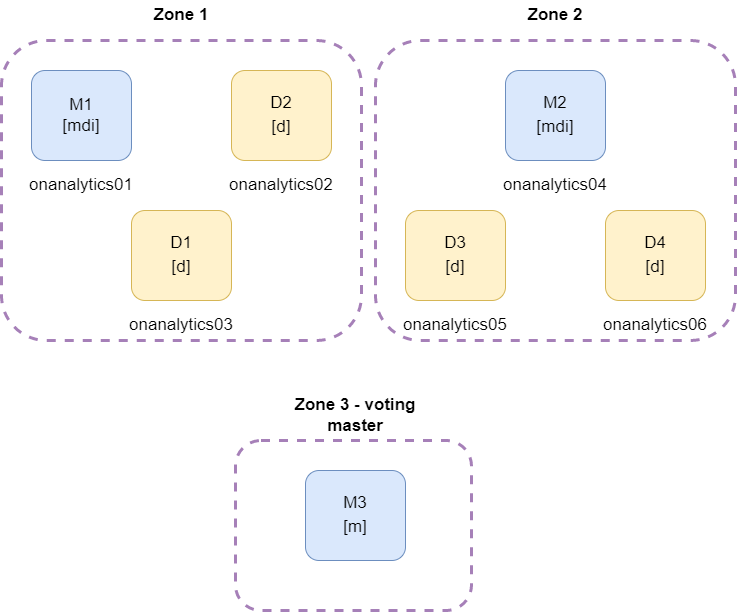
* mdi = master, data and ingest roles
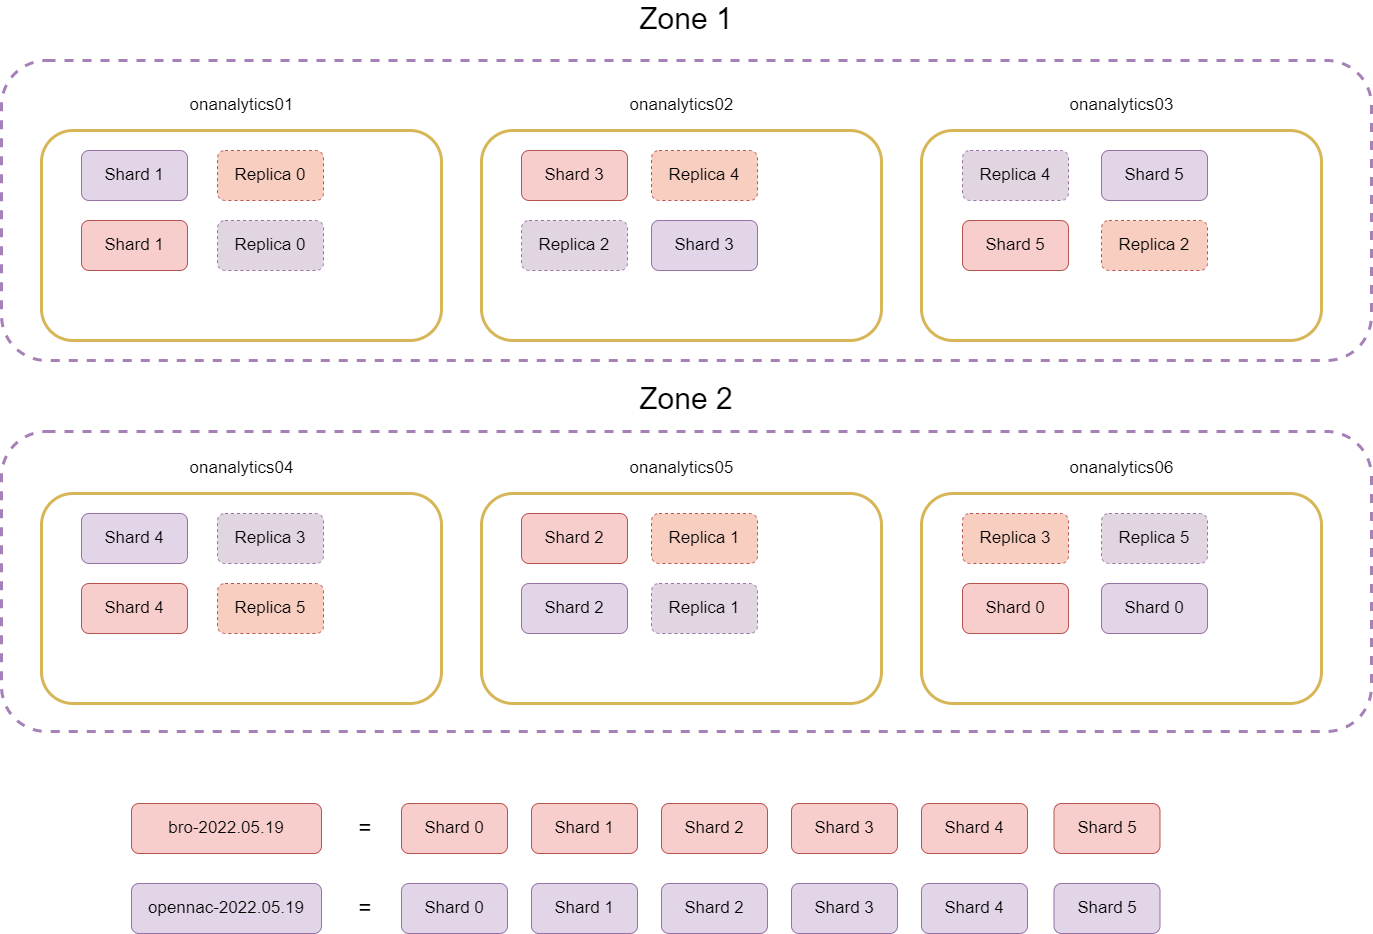
An example of the shards distribution with one replica and two zones can be something similar to the following:
3.6.5.2.7. More than six analytics
If we have more than 6 analytics, it is necessary to create the zones corresponding to the number of sites of the client. Then, we need to distribute two master nodes to each zone. The nodes remaining will be data nodes equitably distributed among the different zones.
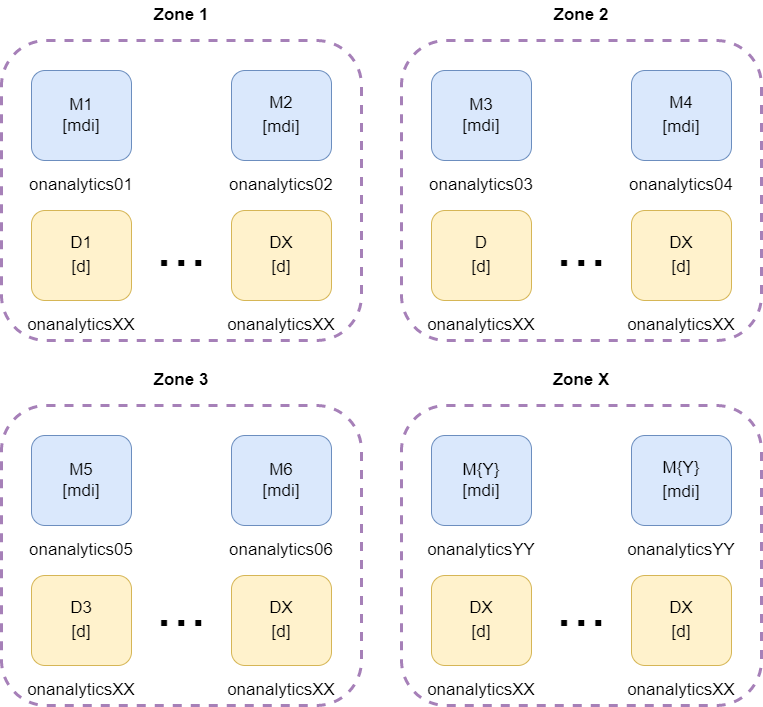
* mdi = master, data and ingest roles
3.6.5.3. Iptables
The are some iptables needed for ELK communication at onanalytics. We need to edit the file:
vi /etc/sysconfig/iptables
The Logstash pipelines will send data to Elasticsearch on port 9200. The ON Cores will access the elasticsearch data on port 9200. And the Elasticsearch cluster needs to have the port 9300 accessible for the other onanalytics on the cluster:
-A INPUT -s {{ onaggregatorXX_ip }} -p tcp -m state --state NEW -m tcp --dport 9200 -j ACCEPT
-A INPUT -s {{ oncoreXX_ip }} -p tcp -m state --state NEW -m tcp --dport 9200 -j ACCEPT
-A INPUT -s {{ onanalyticsXX_ip }} -p tcp -m state --state NEW -m tcp --dport 9300 -j ACCEPT
It is necessary to restart the service:
systemctl restart iptables
3.6.5.4. Cluster Configuration
Note
Remember to perform the Basic Configuration before proceeding.
Before creating a cluster, we need to delete all the elastic data. If we have important info in our elastic, we will need to export the data before deleting it and import it when the cluster is up again. If we want to add a node to the current cluster, we also need to delete the data of the new node.
systemctl stop elasticsearch
rm -rf /var/lib/elasticsearch/nodes
3.6.5.4.1. Master
First, we need to edit the elasticsearch configuration file:
vi /etc/elasticsearch/elasticsearch.yml
For a Master node we need to edit the following lines:
The cluster name. It needs to be the same on all the analytics in the cluster.
cluster.name: {{CLUSTER_NAME}}
The node name.
node.name: {{NODE_NAME}}
The zone configuration if it is necessary. All the nodes in the same zone need to have the same zone ID.
node.attr.rack: {{ZONE_ID}}
cluster.routing.allocation.awareness.attributes: rack
The discover seed hosts. We need to add the master’s IPs, excluding its own IP.
discovery.seed_hosts: ["{{ MASTER2_IP }}","{{ MASTER3_IP }}"]
The cluster initial master nodes. We need to add the master’s node names.
cluster.initial_master_nodes: ["{{ MASTER1_NODE_NAME }}","{{ MASTER2_NODE_NAME }}","{{ MASTER3_NODE_NAME }}"]
We need to add the following lines for select master role, data role, and ingestion role.
node.master: true
node.data: true
node.ingest: true
Save the file and restart the elasticsearch.
systemctl restart elasticsearch
3.6.5.4.2. Data
First, we need to edit the elasticsearch configuration file:
vi /etc/elasticsearch/elasticsearch.yml
For a Data node, we need to edit the following lines:
The cluster name. It needs to be the same on all the analytics in the cluster.
cluster.name: {{CLUSTER_NAME}}
The node name.
node.name: {{NODE_NAME}}
The zone configuration if it is necessary. All the nodes in the same zone need to have the same zone ID.
node.attr.rack: {{ZONE_ID}}
cluster.routing.allocation.awareness.attributes: rack
The discover seed hosts that provide a list of the addresses of the master-eligible nodes in the cluster. We need to add the master’s Ips or the name resolution in /etc/hosts, excluding its own IP.
discovery.seed_hosts: ["{{ MASTER2_IP }}","{{ MASTER3_IP }}"]
The cluster’s initial master nodes, that sets the initial set of master-eligible nodes in a new cluster. We need to add the masters node names.
cluster.initial_master_nodes: ["{{ MASTER1_NODE_NAME }}","{{ MASTER2_NODE_NAME }}","{{ MASTER3_NODE_NAME }}"]
We need to add the following lines for select master role, data role, and ingestion role.
node.master: false
node.data: true
node.ingest: false
Save the file and restart the Elasticsearch service.
systemctl restart elasticsearch
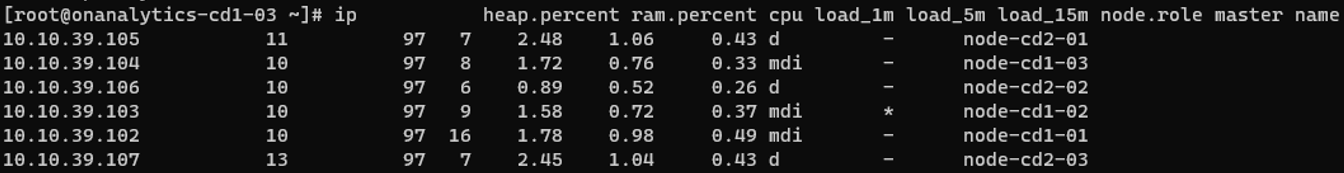
To see that all the roles and nodes are configured properly we can execute the next command on any node in the cluster:
curl -XGET localhost:9200/_cat/nodes?v=true&pretty=true
We will see something like the following:
3.6.5.5. Number of shards and replicas
To add the number of shards and replicas, we need to go to a Master cli and execute the following curl:
curl -XPUT localhost:9200/_template/index_defaults -H "Content-Type: application/json" -d '
{
    "template": "*",
    "settings": {
        "number_of_shards": {{ NUMBER_OF_SHARDS }},
        "number_of_replicas": {{ NUMBER_OF_REPLICAS }}
    }
}'
All the indexes that will be created in the future will be divided in the number of shards entered, and every shard will have the number of replicas entered.
If an index already exists, the number of shards will not be modified, but we can reindex it to get the number of shards we want. To reindex an index, we need to execute the following steps:
Copy the index into a new index. It will create a new index with the new shards and replica number.
curl -X POST "localhost:9200/_reindex" -H 'Content-Type: application/json' -d '
{
    "source": {
        "index": "<INDEX_NAME>"
    },
    "dest": {
        "index": "new_index"
    }
}'
Remove the old index.
curl -XDELETE http://localhost:9200/<INDEX_NAME>
Copy the new index into the index we are reindexing:
curl -X POST "localhost:9200/_reindex" -H 'Content-Type: application/json' -d '
{
    "source": {
        "index": "new_index"
    },
    "dest": {
        "index": "<INDEX_NAME>"
    }
}'
Delete the auxiliary index created:
curl -XDELETE http://localhost:9200/new_index
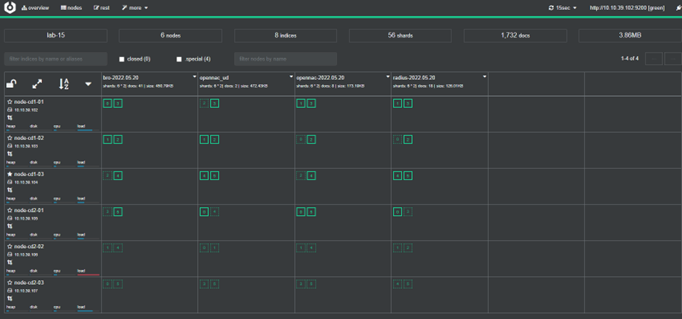
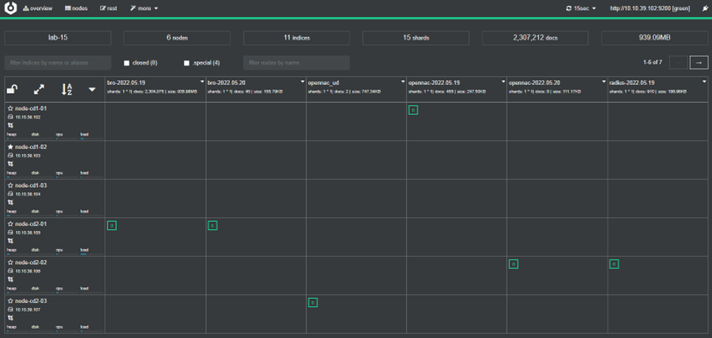
With the open source Cerebro (Annex A - Install Cerebro), we can see that the new changes have been applied:
3.6.5.6. Elasticsearch networking
There are some parameters that can be useful in the elasticsearch.yml file:
vi /etc/elasticsearch/elasticsearch.yml
By default, Elasticsearch only binds to loopback addresses such as 127.0.0.1 and [::1]. This is sufficient to run a cluster of one or more nodes on a single server for development and testing, but a resilient production cluster must involve nodes on other servers. There are many network settings, but usually, all you need to configure is network.host:
network.host: 192.168.1.10
When you provide a value for network.host, Elasticsearch assumes that you are moving from development mode to production mode, and upgrades a number of system start-up checks from warnings to exceptions. See the differences between development and production modes.
The network.host setting explained in Commonly used network settings is a shortcut that sets the bind host and the publish host at the same time. In advanced used cases, such as when running behind a proxy server, you may need to set these settings to different values:
network.bind_host: This specifies which network interface(s) a node should bind to in order to listen for incoming requests. A node can bind to multiple interfaces, e.g. two network cards, or a site-local address and a local address. Defaults to network.host.
network.publish_host: The publish host is the single interface that the node advertises to other nodes in the cluster, so that those nodes can connect to it. Currently, an Elasticsearch node may be bound to multiple addresses, but only publishes one. If not specified, this defaults to the “best” address from network.host, sorted by IPv4/IPv6 stack preference, then by reachability. If you set a network.host that results in multiple bind addresses yet rely on a specific address for node-to-node communication, you should explicitly set network.publish_host.
When the parameters are changed, save the file and restart the Elasticsearch service.
systemctl restart elasticsearch
3.6.5.7. Import Data to Elasticsearch
When the Elasticsearch cluster is created and up, we need to add the following templates mappings executing the following curls:
curl -s --noproxy "*" -H 'Content-Type: application/json' -XPUT 'http://localhost:9200/_template/identities' -d@/usr/share/opennac/analytics/elasticsearch/index_template_identities.json
curl -s --noproxy "*" -H 'Content-Type: application/json' -XPUT 'http://localhost:9200/_template/bro' -d@/usr/share/opennac/analytics/elasticsearch/index_template_bro.json
curl -s --noproxy "*" -H 'Content-Type: application/json' -XPUT 'http://localhost:9200/_template/radius' -d@/usr/share/opennac/analytics/elasticsearch/index_template_radius.json
curl -s --noproxy "*" -H 'Content-Type: application/json' -XPUT 'http://localhost:9200/_template/opennac_captive' -d@/usr/share/opennac/analytics/elasticsearch/index_template_opennac_captive.json
curl -s --noproxy "*" -H 'Content-Type: application/json' -XPUT 'http://localhost:9200/_template/opennac' -d@/usr/share/opennac/analytics/elasticsearch/index_template_opennac.json
curl -s --noproxy "*" -H 'Content-Type: application/json' -XPUT 'http://localhost:9200/_template/opennac_macport' -d@/usr/share/opennac/analytics/elasticsearch/index_template_opennac_macport.json
curl -s --noproxy "*" -H 'Content-Type: application/json' -XPUT 'http://localhost:9200/_template/opennac_net_dev' -d@/usr/share/opennac/analytics/elasticsearch/index_template_opennac_nd.json
curl -s --noproxy "*" -H 'Content-Type: application/json' -XPUT 'http://localhost:9200/_template/opennac_nd-' -d@/usr/share/opennac/analytics/elasticsearch/index_template_opennac_nd-.json
curl -s --noproxy "*" -H 'Content-Type: application/json' -XPUT 'http://localhost:9200/_template/opennac_ud' -d@/usr/share/opennac/analytics/elasticsearch/index_template_opennac_ud.json
curl -s --noproxy "*" -H 'Content-Type: application/json' -XPUT 'http://localhost:9200/_template/misc' -d@/usr/share/opennac/analytics/elasticsearch/index_template_misc.json
curl -s --noproxy "*" -H 'Content-Type: application/json' -XPUT 'http://localhost:9200/_template/external_syslog' -d@/usr/share/opennac/analytics/elasticsearch/index_template_external_syslog.json
curl -s --noproxy "*" -H 'Content-Type: application/json' -XPUT 'http://localhost:9200/_template/third_party_vpn' -d@/usr/share/opennac/analytics/elasticsearch/index_template_third_party_vpn.json
Then, we need to import all the Kibana customized data to the .kibana index in Elasticsearch:
3.6.6. Kibana HA
Kibana service is showing the information saved on elasticsearch cluster. So, we will connect elasticsearch to port 9200 to get this information.
vi /etc/kibana/kibana.yml
The lines need to be the following:
server.port: 5601
server.host: "0.0.0.0"
server.basePath: "/admin/rest/elasticsearch"
server.rewriteBasePath: false
#elasticsearch.hosts: ["onanalytics01:9200","onanalytics02:9200"]
If we want to have another architecture with lower Kibana running on the cluster, or only one Kibana, we need the following.
To configure HA in Kibana we need to add the following line with the onanalytics on the cluster:
elasticsearch.hosts: ["onanalytics01:9200","onanalytics02:9200"]
This will allow to ask one onanalytics for the data to show, and if it doesn’t work, we will be able to get the data from the other onanalytics. The data is the same because onanalytics are forming a cluster of elasticsearch.
It is necessary to restart the service:
systemctl restart kibana
3.6.6.1. Iptables
There are some iptables needed for ELK communication at onanalytics with Kibana. We need to edit the file:
vi /etc/sysconfig/iptables
OpenNAC Enterprise accesses Kibana at port 5601.
-A INPUT -s {{ oncoreXX_ip }} -p tcp -m state --state NEW -m tcp --dport 5601 -j ACCEPT
It is necessary to restart the service:
systemctl restart iptables
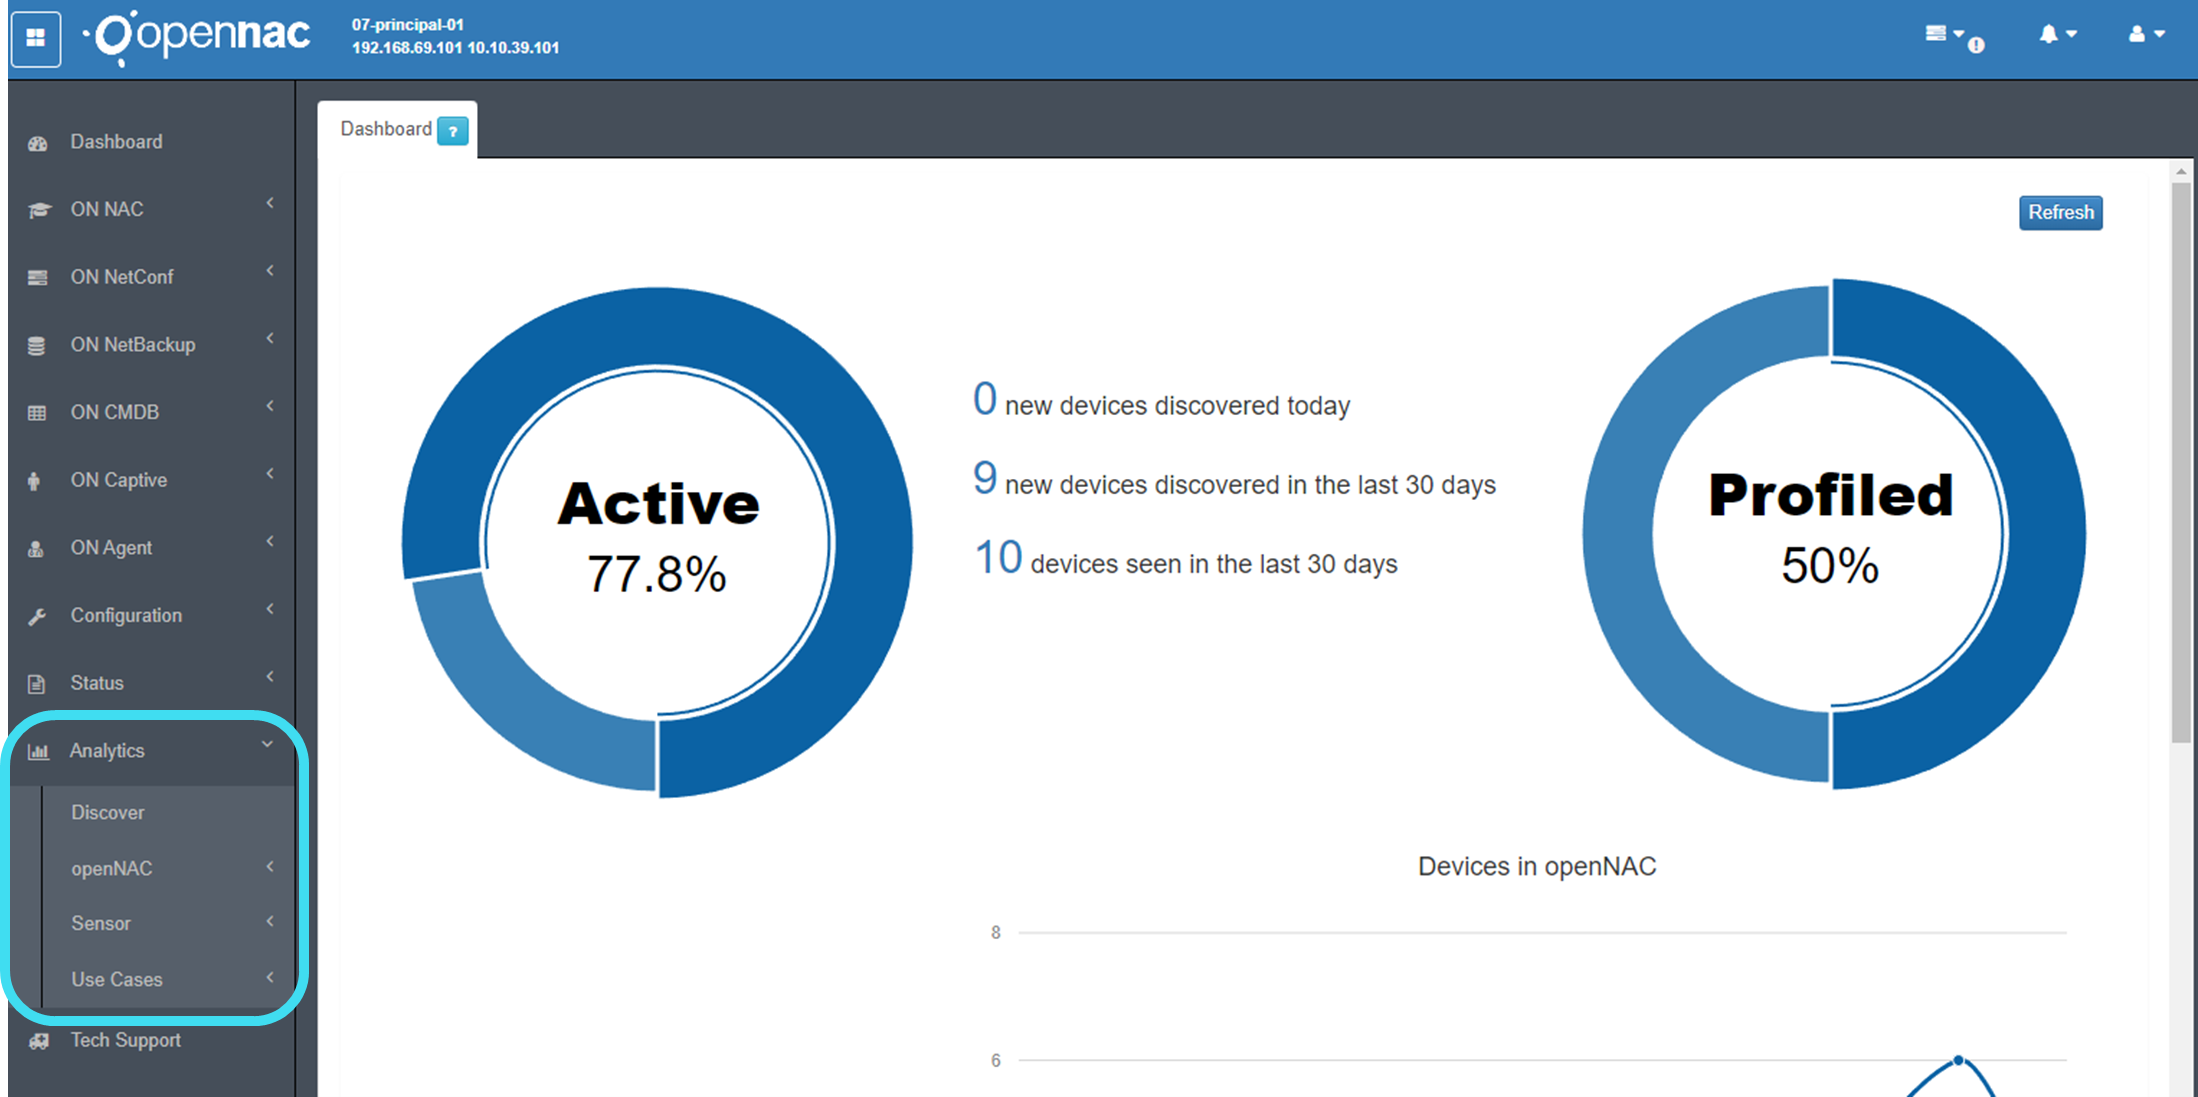
3.6.7. OpenNAC ELK
From OpenNAC Enterprise we access Kibana to show all the information logged by our ELK. The access is on the port 5601, and the information is represented on the Analytics module.
On the discover we can find the logs that arrive to an index:
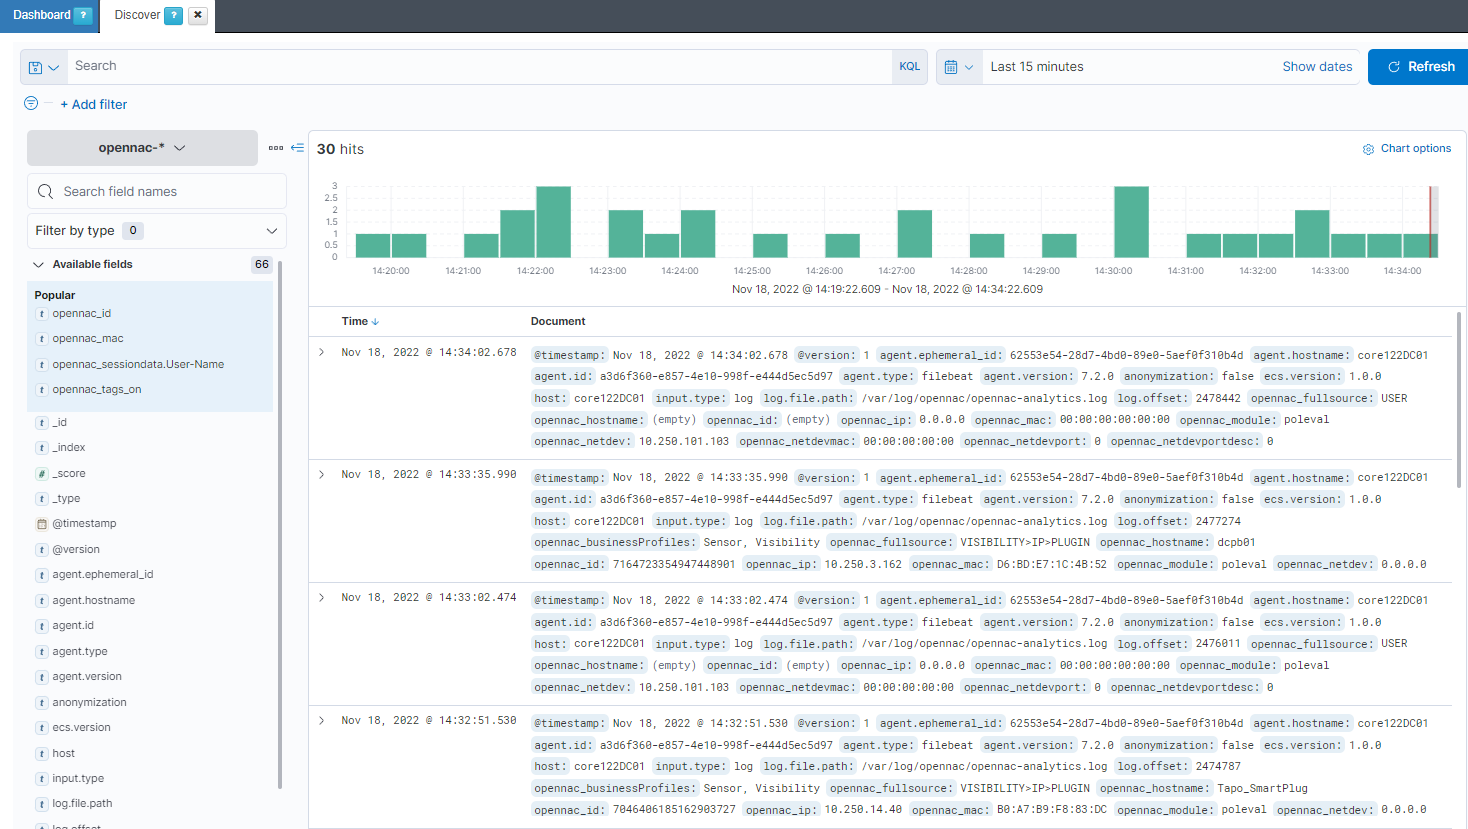
And on the other sections on the Analytics module, we can find different dashboards.
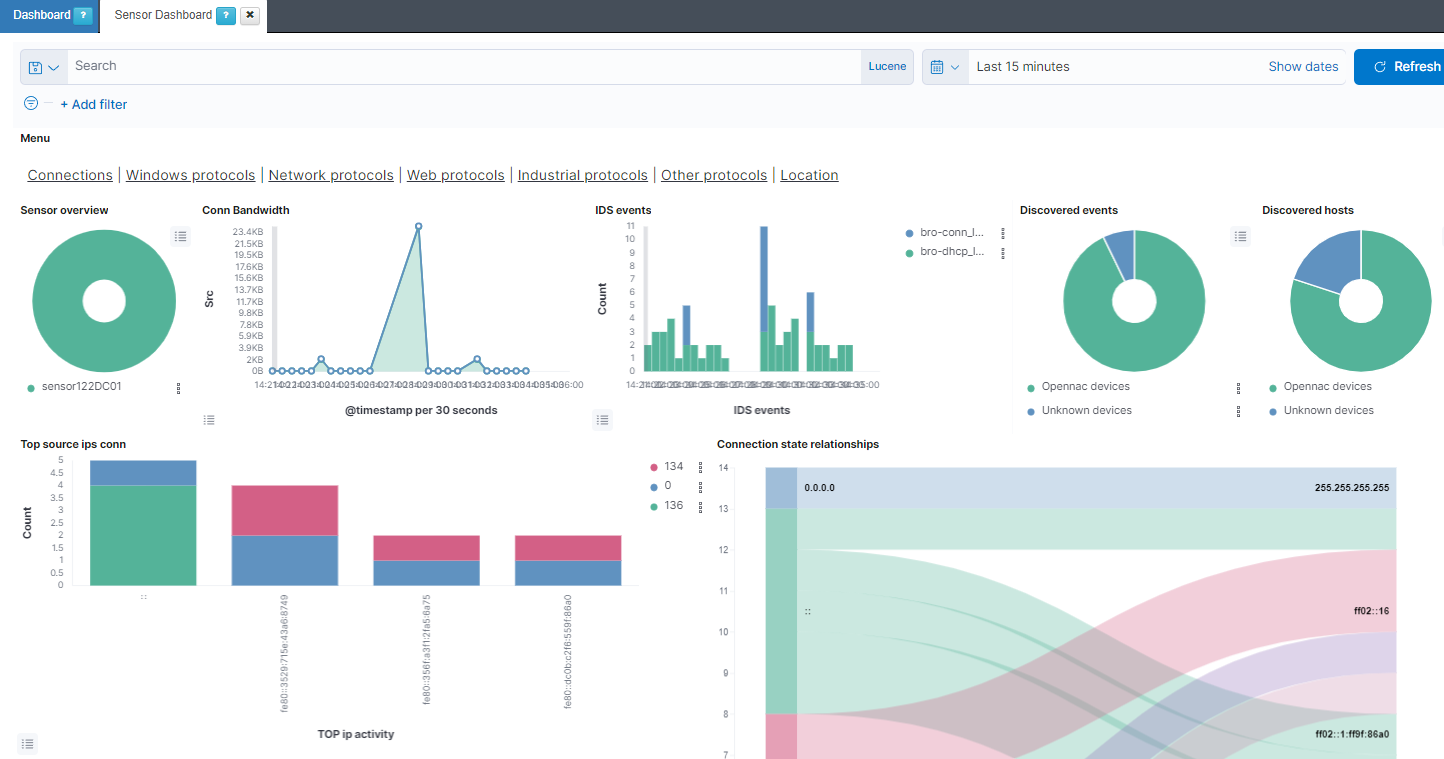
Discover and User Device Profiling plugins also uses ELK to get information about the different devices.
bash /usr/share/opennac/analytics/scripts/elk8_update.sh -o update
3.6.8. Annex A - Install Cerebro
Cerebro is an open source (MIT License) elasticsearch web admin tool built using Scala, Play Framework, AngularJS and Bootstrap.
https://github.com/lmenezes/cerebro
Is it important to install Cerebro in a server that has access to the elasticsearch cluster.
To install Cerebro, we need to download the last release from:
https://github.com/lmenezes/cerebro/releases
In our case, we are going to download the next release:
wget https://github.com/lmenezes/cerebro/releases/download/v0.9.4/cerebro-0.9.4-1.noarch.rpm
It is necessary to install it:
rpm -i cerebro-0.9.4-1.noarch.rpm
And then we need to execute it:
/bin/cerebro
The default port for Cerebro is 9000. If we want to execute Cerebro in another port we can use the following command:
bin/cerebro -Dhttp.port={{ NEW_PORT }}
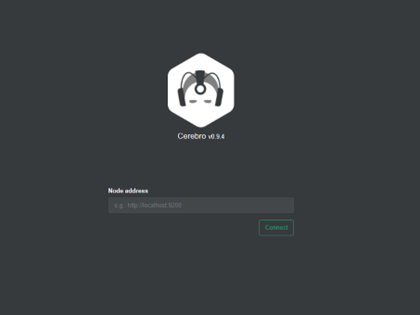
When Cerebro is running we can access from a browser with the following URL:
http://{{ SERVER_IP }}:{{ CEREBRO_PORT }}
We will see the following:
Entering an elastic server IP, we will see all the information that Cerebro give us about the elastic cluster. For example:
http://{{ ELASTIC_SERVER_IP }}:9200
3.6.9. Annex B - Development Kibana
To start the development Kibana, first we need to configure it by editing the following file:
vi /opt/kibana-7.17.6-linux-x86_64/config/kibana.yml
It is necessary to have the following variables:
server.port: 5600
server.host: "0.0.0.0"
#server.basePath: ""
We will run the following command to execute the Kibana in the background:
screen
Then we need to execute the following command to run development Kibana:
/opt/kibana-7.17.6-linux-x86_64/bin/kibana --allow-root
To exit the screen we need to execute CTRL+A+D.